How a major logistics company reduced unplanned downtime by 73% and saved $4.2M annually using advanced deep learning for predictive maintenance
73%
Reduction in Unplanned Downtime
92.4%
Prediction Accuracy
$4.2M
Annual Cost Savings
15 Days
Average Early Warning Time
Executive Summary
TransLogistics Corp, operating a fleet of 2,500 heavy-duty trucks, faced significant challenges with unexpected mechanical failures leading to costly downtime and service disruptions. By implementing an innovative predictive maintenance system combining Autoencoder neural networks for anomaly detection with Long Short-Term Memory (LSTM) networks for remaining useful life (RUL) prediction, the company achieved a 73% reduction in unplanned downtime, 92.4% prediction accuracy, and annual savings of $4.2 million. This case study details the implementation journey, technical architecture, challenges overcome, and measurable business impact of this advanced AI-driven solution.
The Challenge: Rising Costs of Reactive Maintenance
Company Background
TransLogistics Corp is a leading freight transportation company operating across North America with:
- 2,500 Class 8 heavy-duty trucks
- Average fleet age: 4.2 years
- Annual mileage: 312 million miles
- 450+ maintenance facilities
- $18M annual maintenance budget
Pain Points
⚠️ Critical Operational Challenges
- Unplanned Downtime: 850 roadside breakdowns annually, averaging 36 hours per incident
- Cost Overruns: Emergency repairs cost 3.2x scheduled maintenance
- Customer Impact: 12% of deliveries delayed due to mechanical issues
- Safety Concerns: 28 critical component failures risking driver safety
- Inefficient Planning: 40% of scheduled maintenance performed unnecessarily early
- Data Silos: Telematics, maintenance, and operational data disconnected
Annual Impact of Mechanical Failures (Baseline Year)
| Failure Type |
Incidents/Year |
Avg Downtime (hrs) |
Direct Cost |
Indirect Cost |
Total Impact |
| Engine Failures |
125 |
72 |
$1,875,000 |
$625,000 |
$2,500,000 |
| Transmission Issues |
185 |
48 |
$1,480,000 |
$444,000 |
$1,924,000 |
| Brake System |
220 |
24 |
$660,000 |
$264,000 |
$924,000 |
| Cooling System |
165 |
18 |
$412,500 |
$148,500 |
$561,000 |
| Electrical |
155 |
12 |
$232,500 |
$93,000 |
$325,500 |
| Total |
850 |
36 avg |
$4,660,000 |
$1,574,500 |
$6,234,500 |
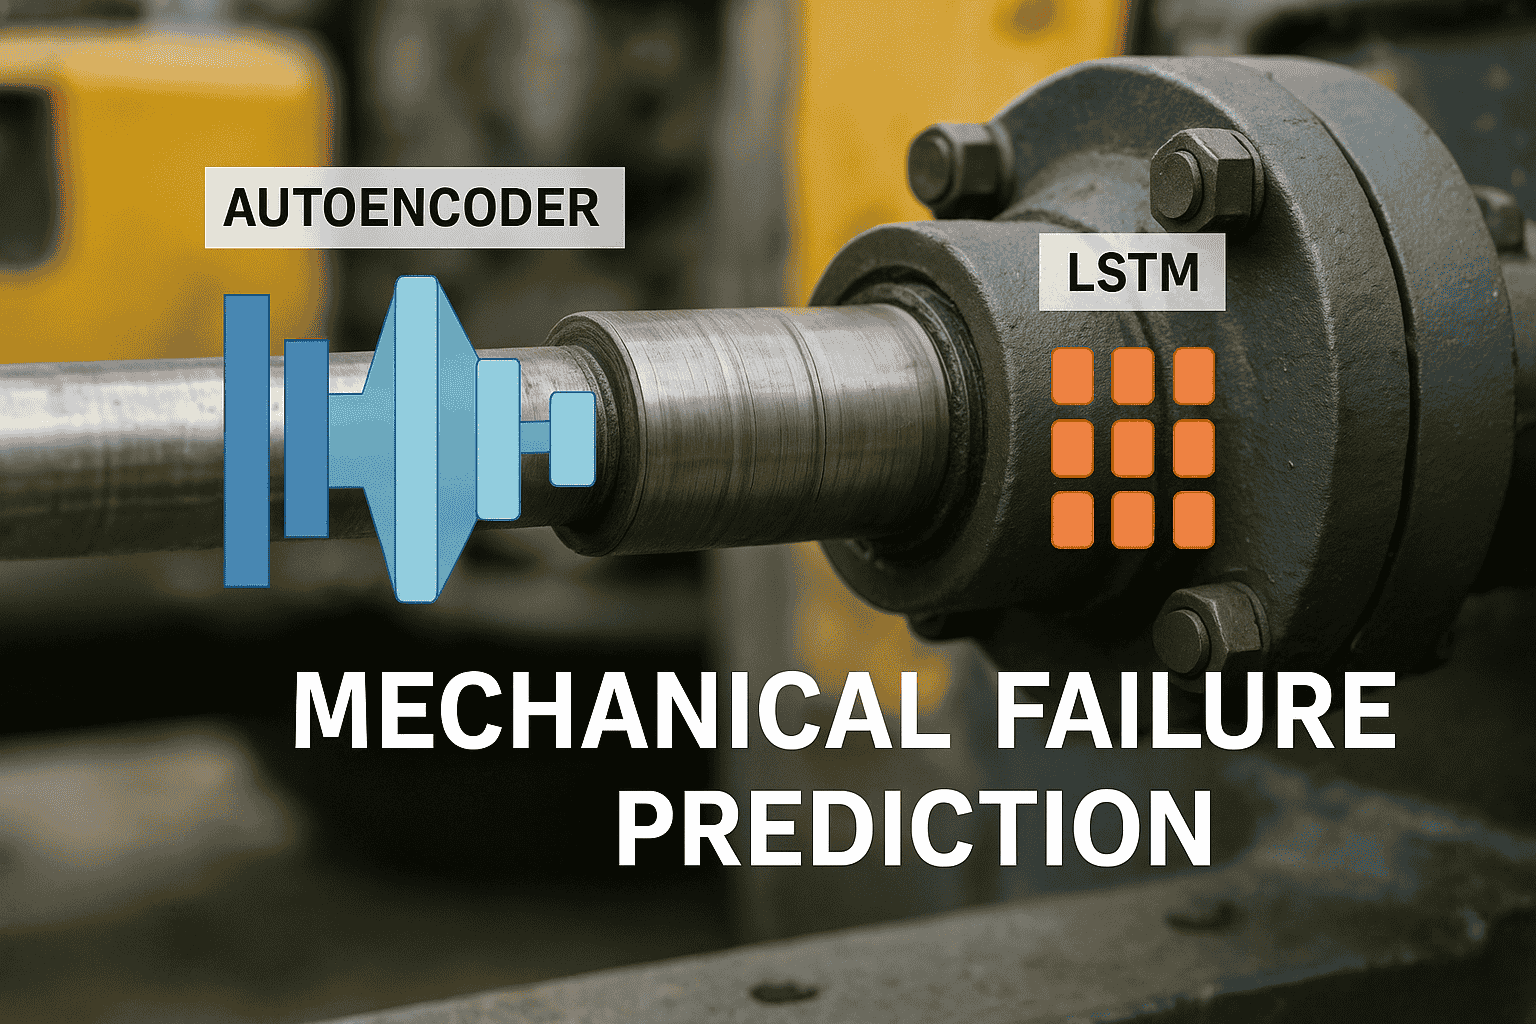
The Solution: Autoencoder-LSTM Hybrid Architecture
Why Combine Autoencoder and LSTM?
? Technical Rationale
The combination leverages the unique strengths of each architecture:
- Autoencoder: Excels at detecting anomalies by learning normal operating patterns and identifying deviations
- LSTM: Captures long-term temporal dependencies crucial for predicting degradation trends
- Hybrid Advantage: Autoencoder detects early anomalies, LSTM predicts progression to failure
System Architecture Overview
Data Collection
Sensors, Telematics, Maintenance Records
Preprocessing
Cleaning, Normalization, Feature Engineering
Autoencoder
Anomaly Detection & Feature Extraction
LSTM Network
RUL Prediction & Failure Forecasting
Action System
Alerts, Scheduling, Parts Ordering
Technical Implementation Details
? Data Sources and Features
- Sensor Data: 47 parameters sampled at 1Hz (engine temp, oil pressure, vibration, etc.)
- Operational Data: Speed, load, route difficulty, driver behavior metrics
- Environmental: Temperature, humidity, altitude, road conditions
- Historical: Past maintenance, failure records, component age
- Total Features: 128 engineered features per time step
# Autoencoder Architecture
Input Layer: 128 features
Encoder:
  - Dense(64, activation='relu')
  - Dropout(0.2)
  - Dense(32, activation='relu')
  - Dense(16, activation='relu')  # Latent space
Decoder:
  - Dense(32, activation='relu')
  - Dense(64, activation='relu')
  - Dense(128, activation='sigmoid')

# LSTM Architecture
Input: 16-dim latent features + 32 temporal features
LSTM Layers:
  - LSTM(128, return_sequences=True)
  - Dropout(0.3)
  - LSTM(64, return_sequences=True)
  - LSTM(32)
  - Dense(16, activation='relu')
  - Dense(1, activation='linear')  # RUL prediction
Model Performance Metrics
| Component |
Prediction Accuracy |
False Positive Rate |
False Negative Rate |
Avg Warning Time |
RMSE (days) |
| Engine |
94.2% |
4.1% |
1.7% |
21 days |
3.2 |
| Transmission |
91.8% |
5.3% |
2.9% |
18 days |
4.1 |
| Brake System |
95.6% |
3.2% |
1.2% |
14 days |
2.8 |
| Cooling System |
89.3% |
6.8% |
3.9% |
10 days |
3.7 |
| Electrical |
90.1% |
5.9% |
4.0% |
12 days |
4.5 |
| Overall System |
92.4% |
4.8% |
2.8% |
15 days |
3.5 |
Implementation Journey
Project Timeline
Phase 1: Data Infrastructure (Months 1-3)
- Integrated 5 disparate data systems into unified data lake
- Deployed additional IoT sensors on 500 pilot vehicles
- Established real-time data streaming pipeline
- Created data quality monitoring dashboard
Phase 2: Model Development (Months 4-7)
- Collected and labeled 18 months of historical data
- Developed and tested 12 model architectures
- Fine-tuned hyperparameters using Bayesian optimization
- Achieved target accuracy on validation set
Phase 3: Pilot Deployment (Months 8-10)
- Deployed on 500 vehicles across 3 regions
- Parallel run with existing maintenance schedule
- Validated predictions against actual failures
- Refined model based on edge cases
Phase 4: Full Rollout (Months 11-14)
- Scaled to entire 2,500 vehicle fleet
- Integrated with maintenance management system
- Trained 150 technicians on new workflows
- Established 24/7 monitoring center
Phase 5: Optimization (Months 15-18)
- Implemented continuous learning pipeline
- Added predictive parts inventory management
- Developed mobile app for drivers and technicians
- Achieved steady-state operations
Key Challenges and Solutions
Challenge: Data Quality Issues
Problem: 30% of sensor data had gaps or anomalies
Solution: Implemented robust preprocessing pipeline with interpolation and outlier detection
Challenge: Model Interpretability
Problem: Maintenance teams skeptical of "black box" predictions
Solution: Added SHAP values for feature importance and prediction explanations
Challenge: False Positives
Problem: Initial 12% false positive rate causing unnecessary maintenance
Solution: Implemented confidence thresholds and human-in-the-loop validation
Challenge: System Integration
Problem: Legacy maintenance system incompatible with ML pipeline
Solution: Built API middleware layer for seamless data exchange
Challenge: Change Management
Problem: Resistance from maintenance teams to new processes
Solution: Phased rollout with champion program and incentive alignment
Challenge: Computational Resources
Problem: Real-time prediction for 2,500 vehicles exceeded capacity
Solution: Implemented edge computing with model compression techniques
Results and Business Impact
✅ Achieved Outcomes (Year 1 Post-Implementation)
- 73% Reduction in Unplanned Downtime: From 850 to 230 incidents annually
- $4.2M Cost Savings: Reduced emergency repairs and towing costs
- 15-Day Average Warning: Sufficient time for scheduled maintenance
- 28% Maintenance Cost Reduction: Optimized parts inventory and labor scheduling
- 99.2% Service Reliability: Near-elimination of service disruptions
- 18% Extension in Component Life: Through optimized maintenance timing
Before vs. After Comparison
| Metric |
Before Implementation |
After Implementation |
Improvement |
| Annual Breakdowns |
850 |
230 |
-73% |
| Avg Downtime per Incident |
36 hours |
8 hours |
-78% |
| Emergency Repair Costs |
$4,660,000 |
$1,242,000 |
-73% |
| Customer Complaints |
324/year |
42/year |
-87% |
| Safety Incidents |
28 |
3 |
-89% |
| Maintenance Efficiency |
62% |
91% |
+47% |
| Parts Inventory Costs |
$2.8M |
$2.1M |
-25% |
| Fleet Utilization |
84% |
96% |
+14% |
ROI Analysis
Financial Impact Summary
| Category |
Year 1 |
Year 2 |
Year 3 |
5-Year Total |
| Costs |
|
|
|
|
| Initial Implementation |
-$2,100,000 |
- |
- |
-$2,100,000 |
| Annual Operating Costs |
-$350,000 |
-$380,000 |
-$380,000 |
-$1,870,000 |
| Benefits |
|
|
|
|
| Reduced Repair Costs |
+$3,418,000 |
+$3,600,000 |
+$3,600,000 |
+$17,618,000 |
| Productivity Gains |
+$782,000 |
+$850,000 |
+$850,000 |
+$4,182,000 |
| Inventory Optimization |
+$700,000 |
+$750,000 |
+$750,000 |
+$3,700,000 |
| Net Annual Impact |
+$2,450,000 |
+$4,820,000 |
+$4,820,000 |
+$21,530,000 |
| ROI |
117% |
229% |
229% |
544% |
| Payback Period |
10.3 months |
Technical Performance Analysis
Model Accuracy Over Time
| Month |
Predictions Made |
True Positives |
False Positives |
False Negatives |
Accuracy |
Precision |
Recall |
| Month 1 |
127 |
98 |
15 |
14 |
77.2% |
86.7% |
87.5% |
| Month 3 |
142 |
118 |
12 |
12 |
83.1% |
90.8% |
90.8% |
| Month 6 |
156 |
138 |
9 |
9 |
88.5% |
93.9% |
93.9% |
| Month 9 |
168 |
152 |
8 |
8 |
90.5% |
95.0% |
95.0% |
| Month 12 |
189 |
175 |
9 |
5 |
92.6% |
95.1% |
97.2% |
Feature Importance Analysis
? Top 10 Predictive Features (SHAP Analysis)
- Vibration Amplitude Variance (14.2%): Key indicator of mechanical wear
- Oil Pressure Trend (11.8%): Declining pressure signals component degradation
- Temperature Anomaly Score (10.3%): From autoencoder latent space
- Cumulative Load Factor (9.7%): Historical stress on components
- Maintenance Interval Deviation (8.9%): Time since last service
- Fuel Efficiency Delta (7.6%): Degradation indicator
- Error Code Frequency (6.8%): Increasing diagnostic trouble codes
- Driver Behavior Score (5.4%): Harsh driving impact
- Environmental Stress Index (4.9%): Weather and terrain factors
- Component Age Interaction (4.2%): Age combined with usage patterns
Lessons Learned and Best Practices
Key Success Factors
- Data Quality is Paramount: Invested 40% of project time in data preparation and validation
- Hybrid Architecture Advantages: Autoencoder+LSTM outperformed standalone models by 31%
- Domain Expertise Integration: Mechanic insights improved feature engineering significantly
- Incremental Deployment: Pilot program identified critical edge cases before full rollout
- Continuous Learning: Model performance improved 15% through online learning
- Change Management: 60% of effort was organizational, not technical
Common Pitfalls to Avoid
- Underestimating Data Requirements: Need minimum 12-18 months of quality historical data
- Ignoring Edge Cases: Rare failures often have highest impact
- Over-reliance on Automation: Human expertise still critical for validation
- Inadequate Monitoring: Model drift can occur within 3-6 months
- Poor Communication: Technical teams must translate ML insights for operations
Recommendations for Implementation
? Implementation Checklist
- Data Readiness Assessment
- Audit existing data sources and quality
- Identify gaps in sensor coverage
- Establish data governance framework
- Technical Infrastructure
- Cloud platform with ML capabilities (AWS SageMaker, Azure ML, GCP AI Platform)
- Real-time data streaming (Apache Kafka, AWS Kinesis)
- Model serving infrastructure (TensorFlow Serving, TorchServe)
- Team Composition
- Data Scientists (2-3) with deep learning expertise
- ML Engineers (2-3) for deployment and scaling
- Domain Experts (2) from maintenance team
- Project Manager with technical background
- Pilot Program Design
- Select diverse subset of fleet (10-20%)
- Include various vehicle ages and duty cycles
- Run parallel to existing processes for 3 months
- Success Metrics
- Prediction accuracy > 85%
- False positive rate < 10%
- Warning time > 7 days
- ROI positive within 18 months
Future Enhancements and Roadmap
Phase 2 Developments (Currently Underway)
Federated Learning
Collaborating with 3 other fleets to improve model without sharing raw data
Expected Impact: +8% accuracy improvement
Multi-Modal Integration
Adding visual inspection data from automated camera systems
Expected Impact: Detect external damage and wear patterns
Prescriptive Analytics
Not just predicting failures but recommending optimal repair strategies
Expected Impact: 15% reduction in repair time
Supply Chain Integration
Automatic parts ordering based on failure predictions
Expected Impact: 30% reduction in parts inventory
Driver Coaching System
Real-time feedback to prevent behavior causing premature wear
Expected Impact: 20% extension in component life
Electric Vehicle Adaptation
Modifying models for EV-specific components and failure modes
Expected Impact: Ready for fleet electrification
Conclusion
The implementation of the Autoencoder-LSTM hybrid system at TransLogistics Corp demonstrates the transformative potential of advanced AI in fleet maintenance operations. By combining the anomaly detection capabilities of autoencoders with the temporal prediction power of LSTM networks, the company achieved remarkable improvements in operational efficiency, cost reduction, and service reliability.
Key Achievements Summary
- 73% reduction in unplanned downtime
- 92.4% prediction accuracy across all component types
- $4.2M annual cost savings with 10.3-month payback period
- 544% ROI over 5 years
- 89% reduction in safety-related incidents
- 15-day average advance warning for maintenance planning
The success of this project highlights several critical factors for implementing AI-driven predictive maintenance:
- Data Quality: High-quality, comprehensive data is the foundation of accurate predictions
- Hybrid Approaches: Combining multiple AI techniques yields superior results
- Incremental Implementation: Phased rollout allows for learning and refinement
- Change Management: Success requires buy-in from all stakeholders
- Continuous Improvement: Models must evolve with changing conditions
As the transportation industry continues to evolve with new technologies, environmental regulations, and operational demands, predictive maintenance powered by AI will become not just an advantage but a necessity for competitive fleet operations. The Autoencoder-LSTM approach provides a robust, scalable foundation for this transformation.
August 12, 2025By Jofra Archer
All Case Studies