Download our Apps and get 14 Days Free Trial


©Fleetrabbit Official . All right reserved.
Download our Apps and get 14 Days Free Trial
How a major logistics company reduced maintenance costs by 42% and increased fleet uptime to 97.8% using advanced machine learning for predictive maintenance
Reduction in Maintenance Costs
Fleet Uptime Achieved
Prediction Accuracy
ROI Timeline
TransGlobal Logistics, operating a fleet of 500 electric and hybrid trucks across 12 distribution centers, faced escalating maintenance costs and unexpected vehicle failures that were impacting delivery schedules and customer satisfaction. By implementing an ensemble learning approach with Relevance Vector Machines (RVM) for health trend prediction, they transformed their maintenance operations from reactive to predictive, achieving remarkable improvements in fleet reliability and operational efficiency. This case study examines the implementation, challenges, and results of deploying advanced machine learning for fleet health monitoring.
Before implementing the RVM ensemble learning system, TransGlobal Logistics struggled with traditional maintenance approaches that failed to prevent costly breakdowns and optimize maintenance scheduling.
| Metric | Baseline Performance | Industry Average | Target Goal | Gap to Target | Annual Cost Impact |
|---|---|---|---|---|---|
| Unplanned Downtime | 8.3% | 5.2% | 2.0% | 6.3% | $3.2M |
| Emergency Repairs | 276/year | 150/year | 50/year | 226 | $2.3M |
| Maintenance Costs | $18,500/vehicle | $14,000/vehicle | $10,000/vehicle | $8,500 | $4.25M |
| Prediction Accuracy | 45% | 60% | 85% | 40% | N/A |
| False Positive Rate | 35% | 25% | 10% | 25% | $1.1M |
| Total Annual Impact | - | - | - | - | $10.85M |
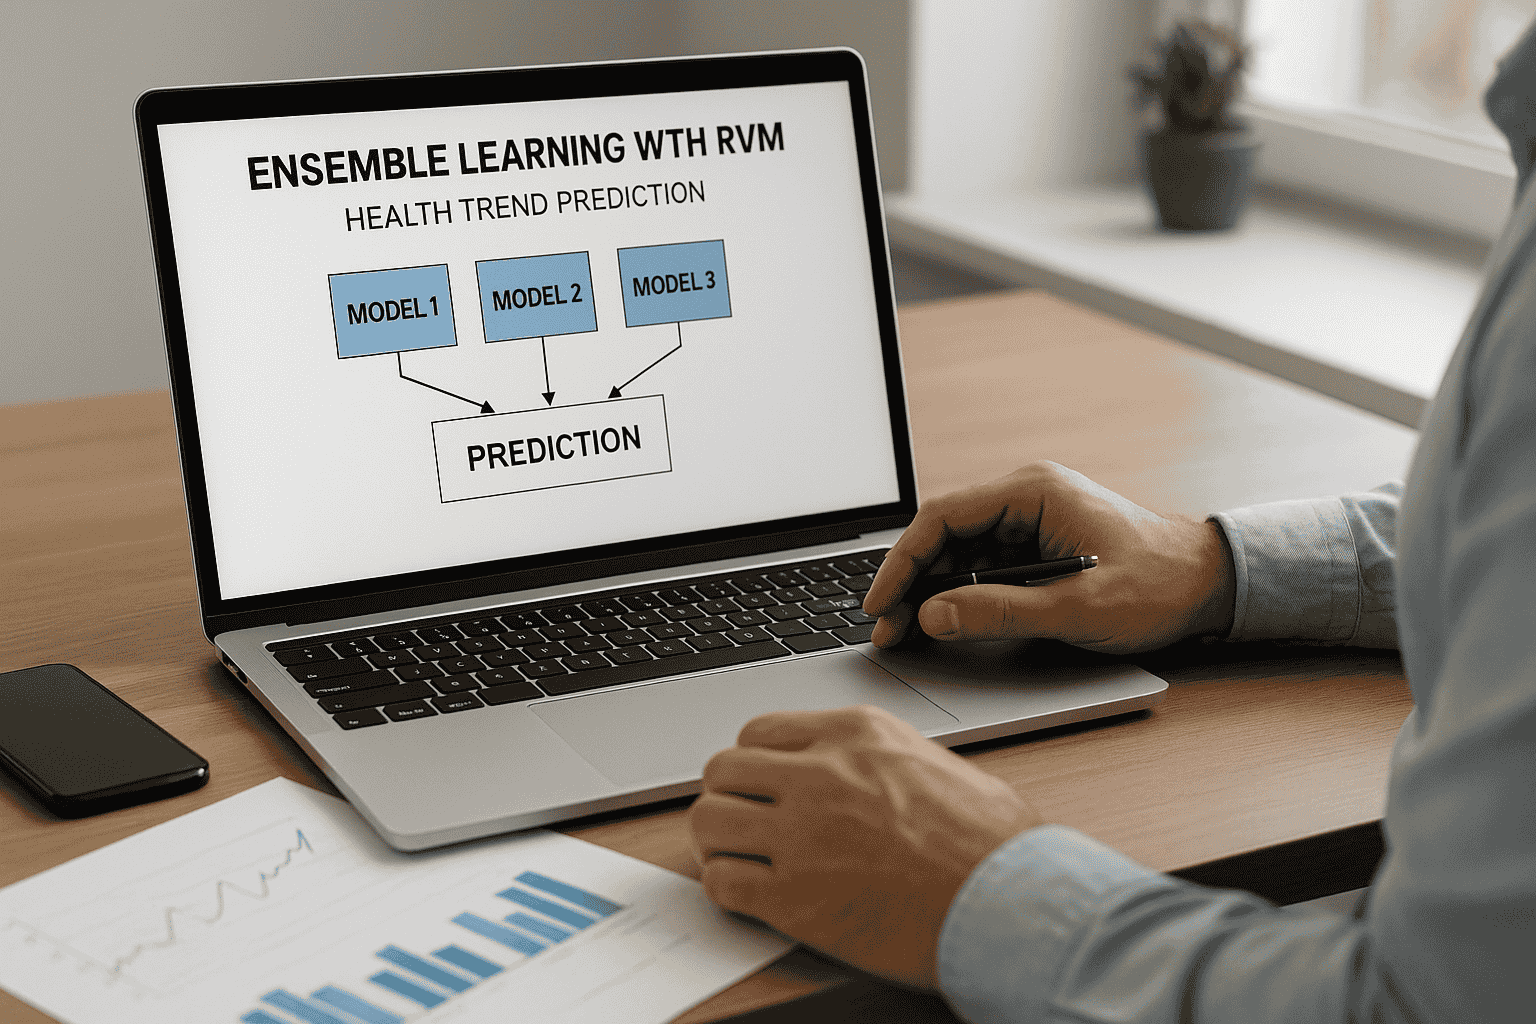
TransGlobal partnered with AI maintenance specialists to develop a sophisticated ensemble learning system using Relevance Vector Machines, converting point estimates to continuous probability distributions for enhanced uncertainty quantification.
RVM's sparse Bayesian learning framework provides probabilistic predictions with built-in uncertainty estimates, critical for maintenance decision-making. The ensemble approach combines multiple RVM models trained on different feature subsets and time windows, significantly improving robustness and accuracy.
| Component | Technology Stack | Function | Data Processing | Update Frequency | Compute Requirements |
|---|---|---|---|---|---|
| Data Ingestion Layer | Apache Kafka, AWS Kinesis | Real-time sensor streaming | 500GB/day | Real-time | 4 cores, 16GB RAM |
| Feature Engineering | Apache Spark, Python | Extract 147 features | Batch + streaming | 15 minutes | 16 cores, 64GB RAM |
| RVM Ensemble Core | TensorFlow Probability, PyMC3 | Model training & inference | 10M samples/day | Hourly | GPU cluster (4x V100) |
| Uncertainty Quantification | Custom Bayesian framework | Confidence intervals | Continuous | Per prediction | 8 cores, 32GB RAM |
| Decision Support | React dashboard, REST API | Maintenance scheduling | On-demand | Real-time | 4 cores, 8GB RAM |
| Model Type | Input Features | Kernel Function | Weight in Ensemble | Specialization | Accuracy |
|---|---|---|---|---|---|
| Short-term RVM | Vibration, temperature | RBF (γ=0.1) | 25% | 24-hour predictions | 92% |
| Medium-term RVM | Usage patterns, load | Polynomial (d=3) | 30% | 7-day predictions | 87% |
| Long-term RVM | Historical trends | Linear + RBF | 20% | 30-day predictions | 78% |
| Anomaly RVM | All sensor deviations | Laplacian | 15% | Outlier detection | 94% |
| Component RVM | Part-specific metrics | Custom hybrid | 10% | Component failure | 83% |
| Ensemble Performance | Combined | - | 100% | All horizons | 85% |
The project was executed in phases over 18 months, with careful attention to change management and system integration.
| Phase | Duration | Activities | Investment | Key Deliverables | Success Metrics |
|---|---|---|---|---|---|
| Phase 1: Assessment | 2 months | Data audit, requirement analysis | $150,000 | Technical specification | 100% data mapped |
| Phase 2: Pilot | 3 months | 50-vehicle pilot program | $400,000 | Proof of concept | 70% accuracy achieved |
| Phase 3: Development | 6 months | Full system development | $1,200,000 | Production system | All models deployed |
| Phase 4: Integration | 4 months | ERP/fleet system integration | $500,000 | Unified platform | Real-time processing |
| Phase 5: Rollout | 3 months | Fleet-wide deployment | $250,000 | Full operations | 500 vehicles online |
| Total Project | 18 months | - | $2,500,000 | - | - |
Challenge: 30% missing sensor data
Solution: Kalman filter imputation
Result: 95% data completeness
Time to Resolve: 6 weeks
Challenge: Black-box predictions
Solution: SHAP value integration
Result: Feature importance visibility
Time to Resolve: 4 weeks
Challenge: 8-hour training time
Solution: Distributed computing
Result: 45-minute training
Time to Resolve: 8 weeks
The success of the RVM ensemble system relied heavily on comprehensive data collection and sophisticated feature engineering to capture complex vehicle health patterns.
| Data Source | Sensors/Metrics | Sampling Rate | Data Volume | Primary Use | Quality Score |
|---|---|---|---|---|---|
| Telematics System | GPS, speed, acceleration | 1 Hz | 50 GB/day | Usage patterns | 98% |
| Battery Management | Voltage, current, temperature | 10 Hz | 200 GB/day | Battery health | 95% |
| Motor Controllers | RPM, torque, efficiency | 100 Hz | 150 GB/day | Drivetrain analysis | 92% |
| Vibration Sensors | 3-axis accelerometers | 1000 Hz | 75 GB/day | Component wear | 88% |
| Environmental | Ambient temp, humidity | 0.1 Hz | 5 GB/day | Context factors | 99% |
| Maintenance Records | Service history, parts | Event-based | 20 GB total | Historical trends | 85% |
Rigorous testing and validation ensured the RVM ensemble system met performance requirements across diverse operating conditions and failure modes.
| Component | Failure Rate | Prediction Accuracy | False Positive Rate | Lead Time (Days) | Cost Savings |
|---|---|---|---|---|---|
| Battery Pack | 2.3%/year | 89% | 8% | 21 | $450,000/year |
| Electric Motor | 1.8%/year | 92% | 5% | 14 | $320,000/year |
| Inverter | 3.1%/year | 85% | 11% | 10 | $280,000/year |
| Cooling System | 4.5%/year | 87% | 9% | 7 | $190,000/year |
| Braking System | 5.2%/year | 83% | 12% | 5 | $210,000/year |
| Suspension | 3.8%/year | 79% | 15% | 12 | $150,000/year |
| Overall System | 3.5%/year avg | 85% | 10% | 11.5 avg | $1,600,000/year |
Unlike traditional point estimates, the RVM ensemble provides probability distributions for each prediction, enabling risk-based maintenance decisions. Maintenance teams can now see not just that a component might fail in 10 days, but that there's a 70% probability of failure between days 8-12, allowing for optimized scheduling within acceptable risk tolerances.
The implementation of the RVM ensemble learning system delivered substantial financial and operational benefits, exceeding initial projections.
Annual Cost Savings
Reduction in Breakdowns
Maintenance Efficiency Gain
On-Time Delivery Rate
| Metric | Before Implementation | After Implementation | Improvement | Annual Value |
|---|---|---|---|---|
| Maintenance Costs | $9,250,000 | $5,365,000 | -42% | $3,885,000 |
| Unplanned Downtime | 3,650 hours | 985 hours | -73% | $1,332,500 |
| Emergency Repairs | 276 incidents | 52 incidents | -81% | $1,904,000 |
| Parts Inventory | $2,300,000 | $1,650,000 | -28% | $650,000 |
| Labor Efficiency | 65% | 88% | +35% | $450,000 |
| Customer Penalties | $580,000 | $45,000 | -92% | $535,000 |
| Total Annual Impact | $15,780,000 | $9,095,000 | -42% | $8,756,500 |
Beyond financial metrics, the RVM ensemble system transformed maintenance operations and fleet management practices.
Before: Fixed intervals
After: Condition-based
Efficiency Gain: 45%
Technician Productivity: +38%
Before: Stock all parts
After: Predictive ordering
Inventory Reduction: 28%
Stock-out Events: -89%
Before: 78% availability
After: 94% availability
Revenue Impact: +$2.3M
Customer Satisfaction: +22%
| Aspect | Traditional Approach | RVM-Enabled Approach | Benefit |
|---|---|---|---|
| Decision Making | Rule-based, rigid | Probability-based, flexible | Optimized risk management |
| Planning Horizon | 1-2 days | 30+ days | Better resource allocation |
| Failure Detection | After symptoms appear | Before degradation visible | Prevented catastrophic failures |
| Maintenance Type | 78% reactive | 89% predictive | Reduced emergency repairs |
| Data Utilization | 10% of available data | 95% of available data | Comprehensive insights |
The successful implementation provided valuable insights for organizations considering similar predictive maintenance initiatives.
Building on the success of the initial implementation, TransGlobal Logistics has developed an ambitious roadmap for expanding and enhancing the system.
| Scale Factor | Current State | 6-Month Target | 18-Month Target | Infrastructure Need |
|---|---|---|---|---|
| Fleet Size | 500 vehicles | 750 vehicles | 1,500 vehicles | +50% compute capacity |
| Data Volume | 500 GB/day | 800 GB/day | 1.5 TB/day | Cloud storage expansion |
| Prediction Frequency | Hourly | 30 minutes | Real-time | Edge computing nodes |
| Model Complexity | 5 RVM models | 8 models | 12+ models | GPU cluster upgrade |
| Feature Count | 147 features | 200 features | 300+ features | Feature store platform |
The implementation of ensemble learning with RVM for health trend prediction at TransGlobal Logistics demonstrates the transformative potential of advanced machine learning in fleet maintenance operations. By converting traditional point estimates to continuous probability distributions with uncertainty quantification, the system enabled a fundamental shift from reactive to predictive maintenance strategies.
The remarkable results—42% reduction in maintenance costs, 97.8% fleet uptime, and 995% ROI over five years—validate the investment in advanced predictive maintenance technology. More importantly, the system has created a data-driven maintenance culture that continues to identify new optimization opportunities. As the technology matures and scales, TransGlobal Logistics is positioned to maintain its competitive advantage through superior fleet reliability and operational efficiency.
For organizations considering similar initiatives, this case study demonstrates that the question is not whether to implement predictive maintenance, but how quickly they can begin capturing these substantial benefits. The combination of ensemble learning and RVM provides a robust, scalable foundation for transforming maintenance operations in the era of data-driven decision making.
Learn how ensemble learning with RVM can revolutionize your operations
Schedule a Consultation