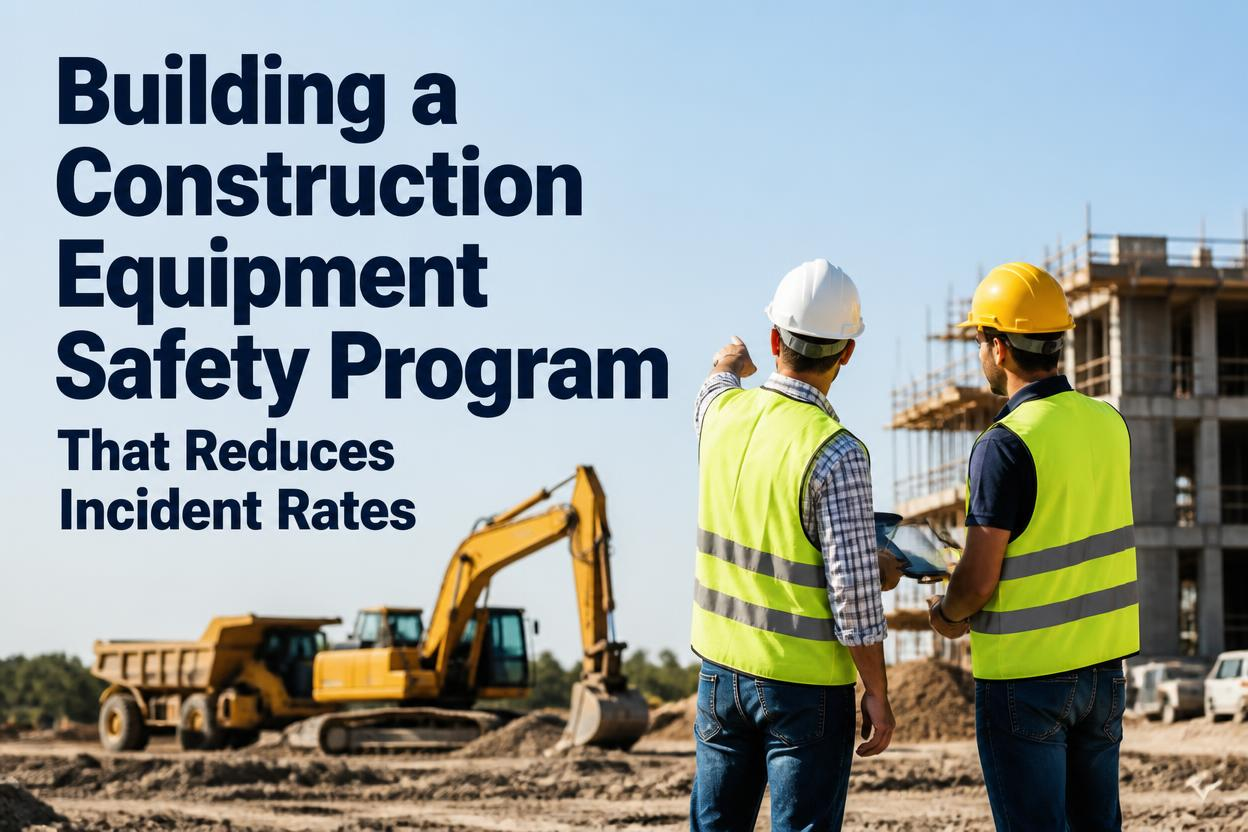
Most construction companies already have a safety program. It's in a binder somewhere, updated once a year, discussed at a monthly meeting that covers the same points as last month. Nobody's ignoring safety on purpose, but a program built on meetings and memory has no way of knowing whether it's actually working until an injury happens and someone pulls the incident report. A program that reduces incident rates looks different: it runs on data collected every single day, not recalled once a month, and it tracks the activities that prevent incidents, not just the ones that follow them.
Effective construction safety programs track leading indicators, like inspections completed, certifications current, and corrective actions closed, not just lagging indicators like injury rates after the fact. Research on major construction projects found injury rates were roughly seven times lower on projects implementing at least nine leading indicator practices compared to those implementing four or fewer. The industry average total recordable incident rate sits around 2.3 per 100 full-time workers, and companies that consistently track leading indicators see that number improve over 12 to 18 months. FleetRabbit pairs equipment inspections, operator certifications, and incident tracking in one system to drive that improvement.
Leading Indicators Versus Lagging Indicators
Every safety metric falls into one of two categories, and understanding the difference is the foundation of a program that actually reduces incidents instead of just reporting them after the fact.
| Indicator Type | What It Measures | Common Examples |
|---|---|---|
| Lagging Indicators | Outcomes that already happened, useful for compliance and benchmarking | Total recordable incident rate, days away/restricted/transferred rate, lost time incidents |
| Leading Indicators | Prevention activities happening right now, predictive of future outcomes | Inspections completed, certifications current, corrective actions closed, near-miss reports filed |
Why Relying On Lagging Indicators Alone Backfires
A low injury rate can mean a program is working, or it can simply mean a company has been lucky so far. Because lagging indicators only reflect what's already happened, they give no early warning and, if overemphasized, can even encourage underreporting to keep the number looking good. A program that only checks its lagging indicators finds out something was wrong months after the conditions that caused it first appeared.
The Data Behind Leading Indicators
This isn't just theory. Research specifically studying major construction projects has quantified the difference leading indicator practices make.
Leading Indicators In One Dashboard
FleetRabbit tracks inspections, certifications, and corrective actions automatically, giving you real leading indicator data instead of a monthly guess. Sign up free and see where your program stands.
Four Pillars Of An Equipment-Centered Safety Program
A safety program built around equipment, rather than just paperwork, needs to cover four connected areas. Weakness in any one of them undermines the others.
Pre-Start Inspections
Operator Certification
Preventive Maintenance
Incident And Near-Miss Tracking
Why These Four Have To Work Together
A pristine inspection record doesn't help if the operator running the machine isn't certified for it. A well-maintained fleet doesn't matter if nobody's tracking near misses that would reveal a recurring hazard. These four pillars only function as a real prevention system when the data from each one feeds into the same place, where patterns across all four become visible instead of staying siloed in separate binders and spreadsheets.
Building The Program Step By Step
Moving from a paper-based program to a data-driven one doesn't require starting over. It requires connecting what's already happening on site to a system that can actually see it.
Establish Your Baseline
Pull your current TRIR and DART numbers, along with however many inspections, certifications, and near-miss reports you can find, to see where the program actually stands today.
Digitize The Leading Indicators First
Move pre-start inspections, certification tracking, and near-miss reporting into a digital system, since these are the metrics that predict what your lagging indicators will look like months from now.
Review Both Indicator Types Monthly
Set a recurring review of leading indicators alongside lagging ones, so the team can see whether prevention activity is actually moving in the direction that should improve outcomes.
Close The Loop On Every Finding
Track corrective actions from identification to completion, since a defect or hazard that's flagged but never resolved provides no protection at all.
Twelve to eighteen months in, companies that stick with this consistently see their lagging numbers start to reflect the prevention work happening underneath them. You can book a demo to see how this fits your current program, or sign up free to start capturing leading indicator data today.
Inspections, Certifications, And Incidents In One Place
FleetRabbit connects the data behind a real safety program, so you can see the patterns that predict incidents before they happen.
Frequently Asked Questions
Build A Safety Program That Predicts Incidents, Not Just Reports Them
FleetRabbit pairs equipment inspections, operator certifications, and incident tracking in one system, giving you the leading indicator data that actually drives incident reduction. Start free with three assets, no credit card required.







