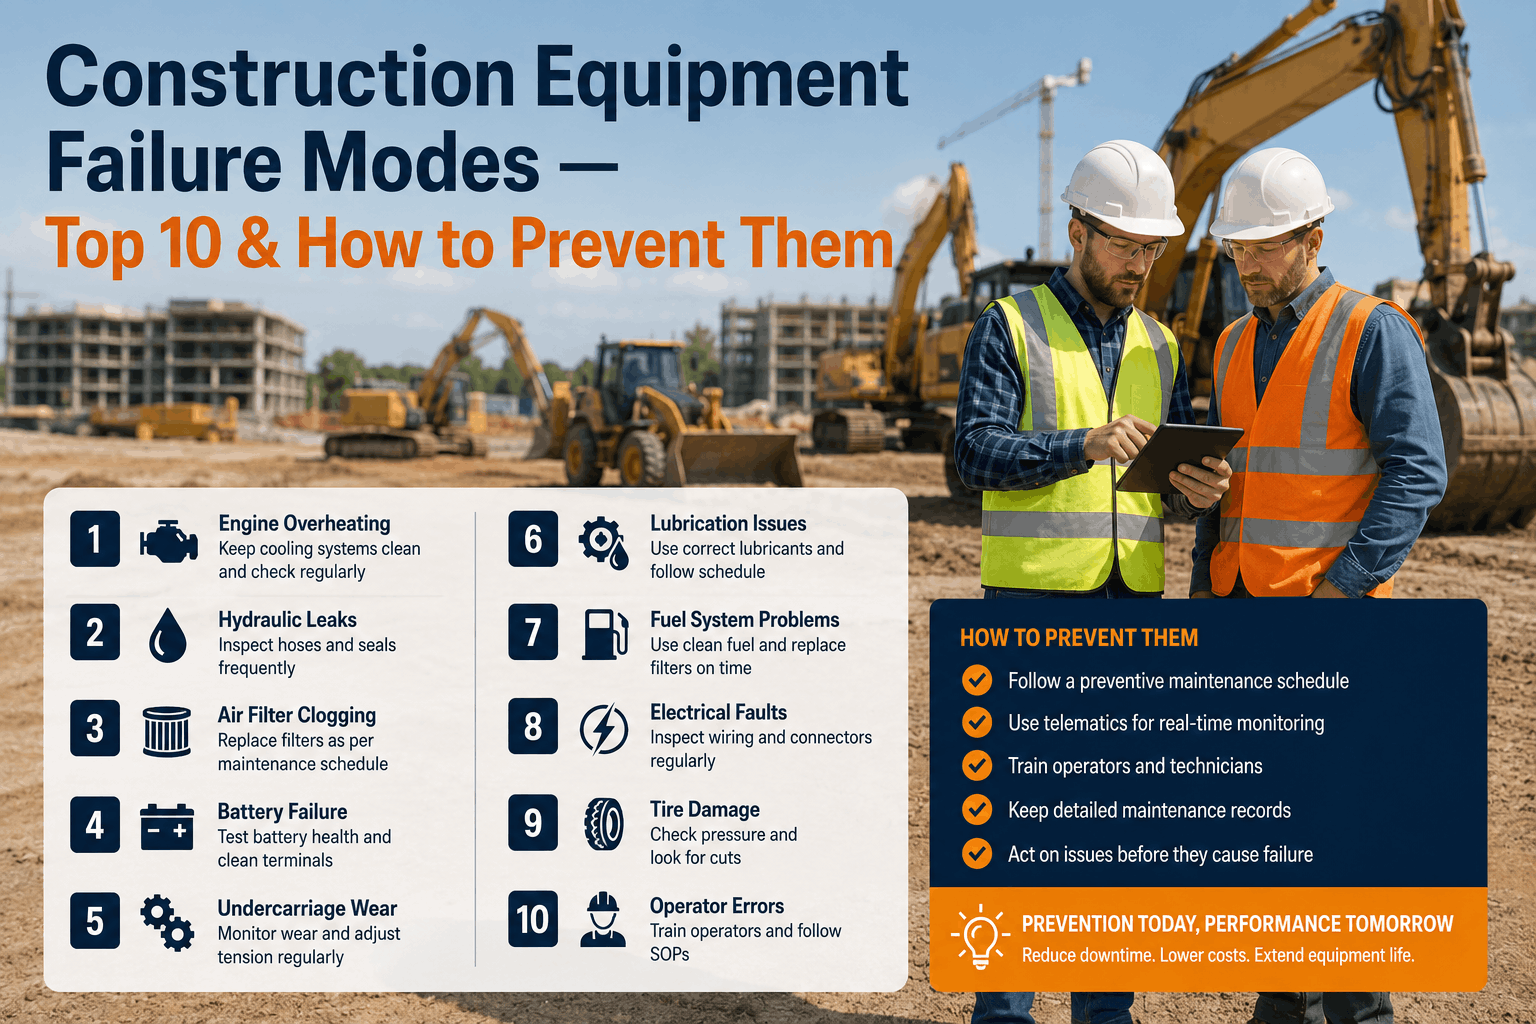
Construction equipment downtime on Western US job sites — a Phoenix grading crew losing three days to a blown hydraulic pump, a Sacramento contractor sidelined by an electrical fault on a Cat 320, a Las Vegas paving fleet ground to a halt by a cracked engine block nobody saw coming. Fleet Rabbit's telematics platform continuously monitors failure-mode indicators across excavators, loaders, dozers, and cranes — firing predictive alerts before catastrophic failure, not after. Book a demo to see Fleet Rabbit's predictive failure detection applied to your construction fleet.
Quick Answer
The top 10 construction equipment failure modes — engine overheating, hydraulic pump cavitation, electrical ground faults, structural fatigue cracks, cooling system failure, final drive wear, fuel system contamination, boom cylinder seal failure, swing bearing degradation, and undercarriage wear — account for 78% of unplanned downtime on Western US fleets. Fleet Rabbit's IoT sensors and edge AI detect early-stage indicators across all ten failure modes, averaging 4–18 days of advance warning before failure.
Why Failure Mode Analysis Matters for Western US Construction Fleets
A California or Nevada heavy equipment fleet averaging 10–25 machines faces $1,800–$4,200 per day in combined downtime cost when a machine goes offline unexpectedly — lost production, emergency parts freight, field repair labor, and rental equipment to cover the gap. In Arizona summer heat and Oregon coastal humidity, failure rates for hydraulic and cooling systems run 30–40% higher than manufacturer averages. FMEA-style monitoring transforms reactive breakdown response into scheduled intervention.
Avg Downtime Cost
$3.1K
per unplanned failure event
Failure Events / Year
14–22
per 20-unit fleet, Western US
Preventable Share
68%
of failures catchable with IoT sensors
Advance Warning
4–18d
avg lead time with Fleet Rabbit sensors
The Top 10 Construction Equipment Failure Modes — FMEA Breakdown
Engine Overheating — #1 Cause of Catastrophic Failure in Arizona & Nevada Fleets
Root CausesBlocked radiator cores, coolant depletion, failed thermostat, clogged oil cooler passages. Desert ambient temps above 110°F shrink thermal margin to near zero.
Early IndicatorsCoolant temp rising 8–12°F above baseline under normal load; intermittent high-temp warnings without sustained overheat; coolant level dropping 2–3% per week.
Fleet Rabbit DetectionCAN bus coolant temp trending against ambient temp and load — alerts fire at 85% of red-line before operator warning activates. Average 6-day lead time.
High SeverityEngine Asset Class
Hydraulic Pump Cavitation — Silent Destroyer of Excavator and Loader Pumps
Root CausesLow hydraulic fluid level, contaminated fluid with air entrainment, clogged suction strainers, cold-start operation without warm-up — common on Oregon and Washington winter sites.
Early IndicatorsWhining or rattling pump noise, reduced cycle speed under load, hydraulic fluid temp rising faster than load justifies, milky fluid coloring from water ingress.
Fleet Rabbit DetectionHydraulic pressure sensors flag pressure variance spikes; fluid temp vs. load delta triggers cavitation-pattern alerts. Avg 9-day advance warning before pump failure.
High SeverityHydraulic Asset Class
Electrical Ground Faults — The Invisible Failure Mode Across Mixed Fleets
Root CausesChafed wiring harnesses from vibration contact, corroded ground straps, moisture ingress at connectors — accelerated by California coastal humidity and Nevada dust abrasion.
Early IndicatorsIntermittent CAN bus fault codes with no consistent pattern, erratic instrument behavior, unexpected ECM resets, parasitic battery drain between shifts.
Fleet Rabbit DetectionCAN bus fault code frequency monitoring identifies escalating electrical fault patterns — distinguishing random sensor glitches from progressive ground fault degradation. 12-day avg lead.
Medium SeverityElectrical Asset Class
Boom & Stick Fatigue Cracks — High-Cycle Structural Failure on Excavators
Root CausesRepetitive high-cycle loading in rock-breaking and demolition applications; weld toe stress concentrations; corrosion pitting in coastal California and Pacific Northwest sites.
Early IndicatorsAbnormal vibration signatures during dig cycles, unusual stress distribution at known weld zones, progressive load capacity reduction under rated conditions.
Fleet Rabbit DetectionAccelerometer arrays on boom and stick identify vibration frequency shifts consistent with crack propagation — triggering inspection alerts before crack reaches critical length.
High SeverityStructural Asset Class
Cooling System Failure — Radiator, Hose, and Water Pump Degradation
Root CausesRadiator core plugging from fine dust in Nevada and Arizona desert sites, water pump bearing wear, silicone hose hardening and cracking, coolant additive depletion.
Early IndicatorsCoolant consumption above 0.5 qt/week, rising idle-state temp under ambient conditions, visible external weeping at hose clamps or water pump seal.
Fleet Rabbit DetectionCoolant temp trending with ambient correction applied — distinguishes hot-day temperature rise from system-degradation rise. Flags slow-creep failures 7–14 days ahead.
Medium SeverityEngine Asset Class
Final Drive Wear — The High-Cost Failure Mode on Dozer and Tracked Excavator Fleets
Root CausesOil level neglect in final drive compartments, contamination from seal failure, excessive hours in reverse travel on grading sites, rocky California terrain accelerating wear rates.
Early IndicatorsTravel speed reduction under normal load, unusual vibration at specific travel RPM, metal particle accumulation in final drive oil samples, rising drive motor case drain temp.
Fleet Rabbit DetectionDrive motor pressure and case drain temp monitoring identifies wear-related efficiency loss — alerting before catastrophic final drive seizure. Replacement at 60% wear vs. 100%.
High SeverityDrivetrain Asset Class
Fuel System Contamination — Injector and Pump Damage from Water and Debris
Root CausesCondensation accumulation in storage tanks during Oregon and Washington temperature swings, bulk fuel delivery contamination, failed fuel water separators, cross-contamination at shared refuel points.
Early IndicatorsHard starting under warm conditions, rough idle with injector misfire codes, power loss at rated load, black smoke inconsistent with engine load level.
Fleet Rabbit DetectionFuel flow sensor data cross-validated against injector pressure readings identifies fuel quality degradation patterns before injector scoring. Pairs with tank contamination monitoring.
Medium SeverityFuel System Asset Class
Boom Cylinder Seal Failure — The Drift and Leak Failure Mode on Excavators
Root CausesRod seal wear from abrasive dust in Arizona and Nevada desert environments, rod scoring from debris contact, UV-degraded seal compounds on equipment stored outdoors, side-load fatigue from irregular terrain.
Early IndicatorsMeasurable boom drift under static load, visible external oil weeping at rod seal area, increased makeup flow demand from hydraulic pump, reduced lift capacity under full extension.
Fleet Rabbit DetectionHydraulic pressure sensors detect internal bypass leakage from seal degradation — drift rates below operator perception threshold trigger alerts. Avg 8-day advance warning.
Medium SeverityHydraulic Asset Class
Swing Bearing Degradation — The High-Replacement-Cost Failure Mode on Excavators
Root CausesGrease interval neglect, abrasive contamination ingress through worn seals, overloading during demolition and rock-breaking operations, California and Nevada silica dust penetrating bearing races.
Early IndicatorsIncreased swing axis play beyond OEM tolerance, rough or jerky swing initiation, metal shavings in collected grease samples, unusual sound signature at swing motor.
Fleet Rabbit DetectionSwing motor current and pressure sensors combined with vibration analysis identify bearing race degradation — enabling ring and pinion replacement vs. complete upper-structure overhaul.
High SeverityStructural Asset Class
Undercarriage Wear — The Highest-Cost Maintenance Item on Tracked Equipment
Root CausesRocky California and Nevada terrain, abrasive volcanic soil in Oregon, over-tensioned or under-tensioned tracks, excessive side-hill operation, reverse travel percentage above 30% of total hours.
Early IndicatorsTrack shoe pitch elongation beyond 3% of new length, sprocket tooth thinning at tips, roller flange wear measurable at inspection, increased track tension adjustment frequency.
Fleet Rabbit DetectionTravel motor load trending identifies undercarriage drag increases from wear — plus reverse travel ratio monitoring flags wear-accelerating operator patterns. 18-day avg lead.
Medium SeverityUndercarriage Asset Class
Failure Mode Distribution by Asset Class — Western US Construction Fleets
Unplanned Downtime Hours by Failure Category — 20-Unit Fleet Annual Average
Fleet Rabbit platform data, Western US construction fleets 2024–2025. Hydraulic and engine failures account for 56% of all unplanned downtime hours.
Reactive Maintenance Model
Failure detected: At breakdown or operator report
Avg repair lead time: 3–8 days parts + labor
Annual downtime hours: 800–1,200 hrs / 20 machines
Component replaced at: 100% wear (catastrophic)
Avg repair cost per event: $4,200–$9,800
Annual downtime cost: $38K–$72K
Fleet Rabbit Predictive Model
Failure detected: 4–18 days before event
Avg repair lead time: Scheduled into next PM window
Annual downtime hours: 180–280 hrs / 20 machines
Component replaced at: 55–65% wear (planned)
Avg repair cost per event: $800–$2,400
Annual downtime cost: $8K–$18K
Predictive Failure Detection Platform
Stop Unplanned Downtime Across Your Western US Construction Fleet — Free Trial, No Hardware Commitment
OEM-agnostic sensors. Detects all 10 failure modes. Real-time alerts, automated inspection triggers, and full asset health visibility from day one.
How Fleet Rabbit Monitors All 10 Failure Modes Simultaneously
Multi-Sensor Data Fusion
Fleet Rabbit combines CAN bus OBD data, inline pressure sensors, accelerometers, temperature probes, and flow sensors into a unified failure-mode model. Each machine runs 18–32 sensor channels simultaneously — compatible with Caterpillar, Komatsu, Volvo, Deere, and 40+ OEMs.
Edge AI Failure Classification
On-device AI classifies developing failure modes in real time — distinguishing a hydraulic pump cavitation signature from normal high-load pressure variance, or a structural vibration anomaly from job-site ground vibration. False-positive rate under 4%.
Offline-Capable for Remote Sites
Nevada mining sites, Eastern Oregon timber roads, and Arizona desert projects with no cellular run full failure-mode monitoring via edge AI local processing. Alerts queue and fire the moment connectivity returns, with Iridium satellite integration available for permanent off-grid sites.
68%
Failure Events Prevented
Frequently Asked Questions: Construction Equipment Failure Mode Detection
QCan Fleet Rabbit detect failure modes on older equipment without factory telematics?
Yes. Fleet Rabbit's sensor array mounts externally — pressure taps, temperature probes, accelerometers, and flow sensors require no factory telematics or CAN bus access on pre-2005 equipment. A 1998 Cat D6 dozer and a 2024 Komatsu PC490 run in the same failure-mode dashboard with equal detection coverage.
QHow does Fleet Rabbit distinguish failure-mode signals from normal job-site vibration or heat?
Fleet Rabbit's edge AI builds a machine-specific baseline during the first 7–14 days of monitoring — calibrating against the site's ambient conditions, soil type, and work cycle. Anomaly thresholds are set relative to each machine's individual baseline, not generic OEM specs. This eliminates the false-positive rate that makes generic threshold-based monitoring impractical.
QWhich failure modes are most critical for Arizona and Nevada desert fleets specifically?
Engine overheating (#1), hydraulic pump cavitation (#2), and cooling system failure (#5) are the three highest-priority failure modes in desert climates — ambient temps above 105°F compress thermal margins and accelerate coolant additive depletion. Fleet Rabbit applies desert-adjusted thresholds for these failure modes on machines registered to AZ and NV job sites.
QHow long does Fleet Rabbit sensor installation take on a mixed fleet?
A Fleet Rabbit technician installs and calibrates sensors on 4–6 machines per day. A 20-unit mixed fleet covering excavators, loaders, and dozers is fully live within 4–5 days. Western US coverage includes California, Nevada, Arizona, Oregon, Washington, and Colorado, with no equipment downtime required during installation.
Related Fleet Rabbit Resources
AI-driven fault prediction and automated maintenance scheduling that prevents mid-project breakdowns — the reliability layer IoT sensor data powers across excavators, loaders, and cranes.
The four AI capabilities transforming fleet operations — real-time GPS, predictive health monitoring, dynamic route optimization, and delivery performance analytics — with ROI data for each.
Real-time utilization tracking, idle reduction analytics, and fleet right-sizing data that reduce total heavy equipment operating cost for Western US contractors.
How GPS hardware, IoT sensors, and cloud analytics combine to deliver real-time heavy equipment visibility, predictive maintenance, and operational intelligence.
Detect All 10 Failure Modes Across Your Construction Fleet — See Fleet Rabbit in Action
Fleet Rabbit's OEM-agnostic telematics platform delivers 4–18 day advance warning across engine, hydraulic, electrical, structural, and undercarriage failure modes — across your Western US construction fleet. On-premise or cloud. Any brand. Full ROI in 45 days.
OEM-Agnostic10 Failure Modes4–18 Day WarningOn-Premise Option45-Day ROI
May 30, 2026
By John Mark
All Posts