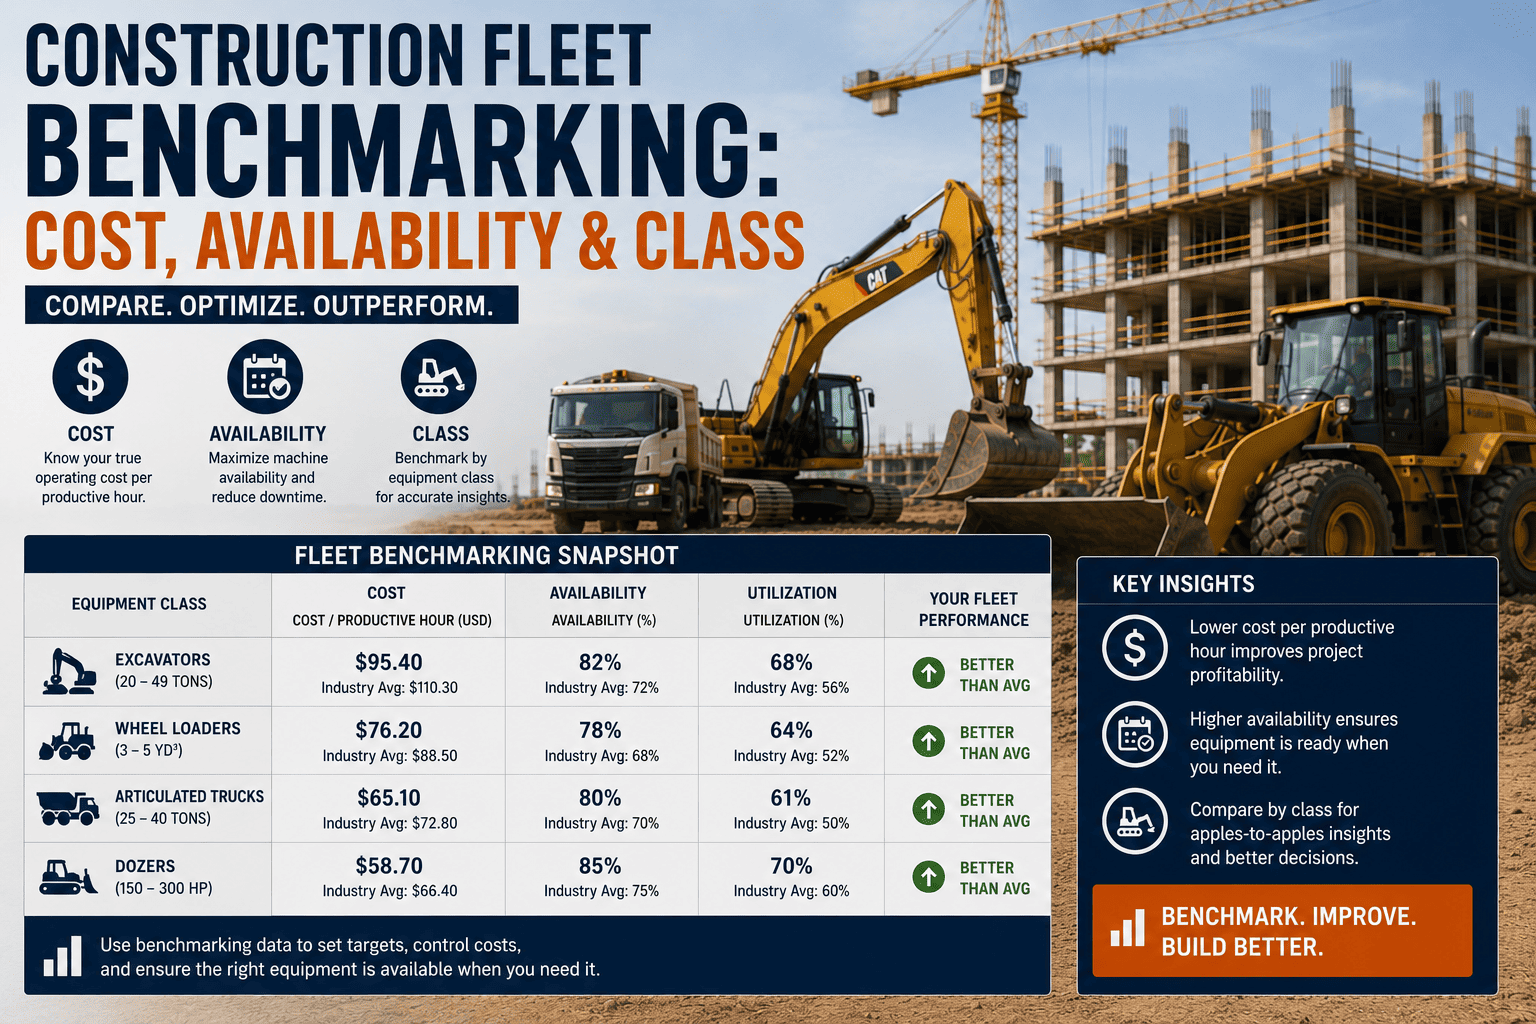
Benchmarking Construction Fleet Cost and Availability by Class

construction-fleet-benchmarking-cost-availability-class

Ask most fleet managers whether Excavator #7 is performing well and you'll get a shrug. Compared to what? A rate sheet from three years ago? A gut feeling? Without a benchmark for what a machine in its class should cost and how available it should be, every equipment decision is a guess dressed up as an estimate. Benchmarking by class turns that guess into a number you can actually act on — and it usually exposes a handful of machines quietly dragging the whole fleet's numbers down.

What Benchmarking By Class Means

Every equipment class — excavators, dozers, loaders, cranes — has a typical cost-per-hour range and a healthy availability or utilization target. Comparing each machine you own against its class benchmark, rather than against your whole fleet average, reveals which specific units are costing more or producing less than they should. Fleets that benchmark by class typically find that a small number of underperforming units are responsible for most of the fleet's excess cost.

Why Fleet-Wide Averages Hide the Real Problem

A fleet average tells you almost nothing useful. If your excavators average 70 percent utilization, that number could mean every unit runs close to 70 percent, or it could mean three machines run at 95 percent while two others sit at 35 percent. Only one of those situations needs action, and the average can't tell you which one you're looking at. Benchmarking has to happen at the class level and then at the individual asset level within that class, or the outliers stay invisible.

The same logic applies to cost per hour. A dozer costing 15 percent more per hour than its class benchmark isn't obviously a problem on a monthly cost report — it just looks like "dozer expenses." It's only a problem once you know what a dozer of that size and age should cost, and can see this specific unit running above that line month after month.

Benchmark Ranges by Equipment Class

These figures are directional starting points pulled from current market rate data. Your own region, fleet age, and utilization pattern will shift the exact numbers, but the structure — cost range paired with an availability target — is what makes the benchmark useful.

Excavators
Owned Cost/Hr60 – 95 dollars
Utilization Target70 – 85%
Availability Target92 – 96%
Dozers
Owned Cost/Hr75 – 150 dollars
Utilization Target55 – 70%
Availability Target90 – 95%
Wheel Loaders
Owned Cost/Hr55 – 90 dollars
Utilization Target65 – 80%
Availability Target92 – 96%
Mobile Cranes
Owned Cost/Hr150 – 220 dollars
Utilization Target40 – 55%
Availability Target88 – 93%

Reading the Two Numbers Together

Cost per hour and availability need to be read side by side, not separately. A machine can look cheap on cost per hour while quietly failing on availability — sitting in the shop often enough that it can't be scheduled reliably even though each repair is inexpensive. The reverse also happens: a machine with excellent availability but a cost per hour well above its class benchmark is usually running on outdated parts pricing, an inefficient duty cycle, or maintenance patterns worth reviewing.

Benchmark Your Fleet By Class Automatically

Find Out Which Machines Are Actually Underperforming

FleetRabbit tracks cost per hour, utilization, and availability for every machine and benchmarks each one against its equipment class automatically, so outliers surface without a manual spreadsheet review. You can start a free trial to see how your fleet benchmarks by class, or book a demo to walk through your numbers with our team.

What an Outlier Actually Looks Like

Benchmarking is only useful once you can spot the gap between what a machine is doing and what its class predicts. Here's a simple example of how that comparison plays out for a single unit.

Example: Excavator #7 vs. Class Benchmark
Class Benchmark
Cost/Hr: 78 dollars
Utilization: 75%
Availability: 94%
Excavator #7 Actual
Cost/Hr: 101 dollars
Utilization: 48%
Availability: 87%
Verdict: Running 29% above its class cost benchmark while sitting well below its utilization and availability targets — a strong candidate for a maintenance review, redeployment, or disposal.

Building a Benchmarking Process in Three Steps

1. Group Assets by True Class, Not Just Type

"Excavator" isn't specific enough. A 13-ton mini excavator and a 30-ton excavator belong to different cost and productivity brackets, and comparing them against the same benchmark produces meaningless outliers. Group by size class and application first.

2. Set a Benchmark From Your Own Best Performers

Published industry ranges are a useful starting point, but your top-performing units in each class are a more accurate benchmark for your fleet, your climate, and your typical job mix. Recalculate this benchmark at least annually as fuel and parts costs shift.

3. Review Outliers Monthly, Not Annually

A machine that's 25 percent over benchmark for one month might be a one-off repair. The same pattern across three consecutive months is a signal worth acting on. Monthly review catches the trend while it's still cheap to fix.

What to Do With a Confirmed Outlier

Depending on the specific gap, the fix is usually one of three things: a maintenance or operator review if cost is high but availability is fine, redeployment if utilization is the problem, or disposal if the machine is consistently behind on all three benchmarks with no clear path to improvement.

Why This Pays Off Beyond the Obvious Machine

The real value of class benchmarking isn't just catching the one bad excavator — it's what it does to every decision that follows. Bids get more accurate because equipment line items are based on what a machine actually costs in its class, not an outdated rate sheet. Buy, rent, and disposal decisions get faster because the data already flags the candidates. And negotiations with dealers or maintenance vendors get sharper once you know exactly how far off benchmark a repair estimate really is. If you want to see where your own fleet sits against class benchmarks before making a decision, you can book a demo and bring your current equipment list.

Frequently Asked Questions

QWhat does benchmarking construction equipment by class mean
It means comparing each machine's cost per hour, utilization, and availability against a benchmark set for its specific equipment class and size — rather than against a single fleet-wide average that hides which units are actually underperforming.
QWhy is a fleet-wide average not good enough
A fleet average can look healthy even when a few specific machines are badly underperforming, because strong performers offset the weak ones in the average. Benchmarking at the class and asset level is what actually surfaces the outliers.
QWhat availability rate should construction equipment target
Most core equipment classes target 90 to 96 percent availability. Availability consistently below that range, paired with cost per hour above the class benchmark, is a strong signal that a machine needs a maintenance review.
QHow often should benchmarks be recalculated
At minimum annually, since fuel and parts pricing shift the cost side of the benchmark. Reviewing individual asset performance against the benchmark should happen monthly so outliers are caught early.
QShould benchmarks come from industry data or my own fleet
Industry ranges are a reasonable starting point, but your own top-performing units in each class are usually a more accurate benchmark, since they reflect your actual climate, job mix, and maintenance standards.
QHow does FleetRabbit support class benchmarking
FleetRabbit tracks cost per hour, utilization, and availability for every machine automatically and compares each one against its equipment class, surfacing outliers without requiring a manual spreadsheet review every month.

Know Which Machines Are Actually Worth Keeping

Stop guessing at what a machine should cost or produce. FleetRabbit benchmarks every asset in your fleet against its equipment class automatically, so the outliers costing you money show up before they quietly drag down another year's numbers. Sign up to see your fleet's benchmark comparison, or book a demo to walk through your equipment list with our team.



July 10, 2026 By John
All Posts

Benchmarking Construction Fleet Cost and Availability by Class

construction-fleet-benchmarking-cost-availability-class

Ask most fleet managers whether Excavator #7 is performing well and you'll get a shrug. Compared to what? A rate sheet from three years ago? A gut feeling? Without a benchmark for what a machine in its class should cost and how available it should be, every equipment decision is a guess dressed up as an estimate. Benchmarking by class turns that guess into a number you can actually act on — and it usually exposes a handful of machines quietly dragging the whole fleet's numbers down.

What Benchmarking By Class Means

Every equipment class — excavators, dozers, loaders, cranes — has a typical cost-per-hour range and a healthy availability or utilization target. Comparing each machine you own against its class benchmark, rather than against your whole fleet average, reveals which specific units are costing more or producing less than they should. Fleets that benchmark by class typically find that a small number of underperforming units are responsible for most of the fleet's excess cost.

Why Fleet-Wide Averages Hide the Real Problem

A fleet average tells you almost nothing useful. If your excavators average 70 percent utilization, that number could mean every unit runs close to 70 percent, or it could mean three machines run at 95 percent while two others sit at 35 percent. Only one of those situations needs action, and the average can't tell you which one you're looking at. Benchmarking has to happen at the class level and then at the individual asset level within that class, or the outliers stay invisible.

The same logic applies to cost per hour. A dozer costing 15 percent more per hour than its class benchmark isn't obviously a problem on a monthly cost report — it just looks like "dozer expenses." It's only a problem once you know what a dozer of that size and age should cost, and can see this specific unit running above that line month after month.

Benchmark Ranges by Equipment Class

These figures are directional starting points pulled from current market rate data. Your own region, fleet age, and utilization pattern will shift the exact numbers, but the structure — cost range paired with an availability target — is what makes the benchmark useful.

Excavators
Owned Cost/Hr60 – 95 dollars
Utilization Target70 – 85%
Availability Target92 – 96%
Dozers
Owned Cost/Hr75 – 150 dollars
Utilization Target55 – 70%
Availability Target90 – 95%
Wheel Loaders
Owned Cost/Hr55 – 90 dollars
Utilization Target65 – 80%
Availability Target92 – 96%
Mobile Cranes
Owned Cost/Hr150 – 220 dollars
Utilization Target40 – 55%
Availability Target88 – 93%

Reading the Two Numbers Together

Cost per hour and availability need to be read side by side, not separately. A machine can look cheap on cost per hour while quietly failing on availability — sitting in the shop often enough that it can't be scheduled reliably even though each repair is inexpensive. The reverse also happens: a machine with excellent availability but a cost per hour well above its class benchmark is usually running on outdated parts pricing, an inefficient duty cycle, or maintenance patterns worth reviewing.

Benchmark Your Fleet By Class Automatically

Find Out Which Machines Are Actually Underperforming

FleetRabbit tracks cost per hour, utilization, and availability for every machine and benchmarks each one against its equipment class automatically, so outliers surface without a manual spreadsheet review. You can start a free trial to see how your fleet benchmarks by class, or book a demo to walk through your numbers with our team.

What an Outlier Actually Looks Like

Benchmarking is only useful once you can spot the gap between what a machine is doing and what its class predicts. Here's a simple example of how that comparison plays out for a single unit.

Example: Excavator #7 vs. Class Benchmark
Class Benchmark
Cost/Hr: 78 dollars
Utilization: 75%
Availability: 94%
Excavator #7 Actual
Cost/Hr: 101 dollars
Utilization: 48%
Availability: 87%
Verdict: Running 29% above its class cost benchmark while sitting well below its utilization and availability targets — a strong candidate for a maintenance review, redeployment, or disposal.

Building a Benchmarking Process in Three Steps

1. Group Assets by True Class, Not Just Type

"Excavator" isn't specific enough. A 13-ton mini excavator and a 30-ton excavator belong to different cost and productivity brackets, and comparing them against the same benchmark produces meaningless outliers. Group by size class and application first.

2. Set a Benchmark From Your Own Best Performers

Published industry ranges are a useful starting point, but your top-performing units in each class are a more accurate benchmark for your fleet, your climate, and your typical job mix. Recalculate this benchmark at least annually as fuel and parts costs shift.

3. Review Outliers Monthly, Not Annually

A machine that's 25 percent over benchmark for one month might be a one-off repair. The same pattern across three consecutive months is a signal worth acting on. Monthly review catches the trend while it's still cheap to fix.

What to Do With a Confirmed Outlier

Depending on the specific gap, the fix is usually one of three things: a maintenance or operator review if cost is high but availability is fine, redeployment if utilization is the problem, or disposal if the machine is consistently behind on all three benchmarks with no clear path to improvement.

Why This Pays Off Beyond the Obvious Machine

The real value of class benchmarking isn't just catching the one bad excavator — it's what it does to every decision that follows. Bids get more accurate because equipment line items are based on what a machine actually costs in its class, not an outdated rate sheet. Buy, rent, and disposal decisions get faster because the data already flags the candidates. And negotiations with dealers or maintenance vendors get sharper once you know exactly how far off benchmark a repair estimate really is. If you want to see where your own fleet sits against class benchmarks before making a decision, you can book a demo and bring your current equipment list.

Frequently Asked Questions

QWhat does benchmarking construction equipment by class mean
It means comparing each machine's cost per hour, utilization, and availability against a benchmark set for its specific equipment class and size — rather than against a single fleet-wide average that hides which units are actually underperforming.
QWhy is a fleet-wide average not good enough
A fleet average can look healthy even when a few specific machines are badly underperforming, because strong performers offset the weak ones in the average. Benchmarking at the class and asset level is what actually surfaces the outliers.
QWhat availability rate should construction equipment target
Most core equipment classes target 90 to 96 percent availability. Availability consistently below that range, paired with cost per hour above the class benchmark, is a strong signal that a machine needs a maintenance review.
QHow often should benchmarks be recalculated
At minimum annually, since fuel and parts pricing shift the cost side of the benchmark. Reviewing individual asset performance against the benchmark should happen monthly so outliers are caught early.
QShould benchmarks come from industry data or my own fleet
Industry ranges are a reasonable starting point, but your own top-performing units in each class are usually a more accurate benchmark, since they reflect your actual climate, job mix, and maintenance standards.
QHow does FleetRabbit support class benchmarking
FleetRabbit tracks cost per hour, utilization, and availability for every machine automatically and compares each one against its equipment class, surfacing outliers without requiring a manual spreadsheet review every month.

Know Which Machines Are Actually Worth Keeping

Stop guessing at what a machine should cost or produce. FleetRabbit benchmarks every asset in your fleet against its equipment class automatically, so the outliers costing you money show up before they quietly drag down another year's numbers. Sign up to see your fleet's benchmark comparison, or book a demo to walk through your equipment list with our team.


July 10, 2026 By John
All Posts

Share This Story, Choose Your Platform!

Latest Posts

Scroll



