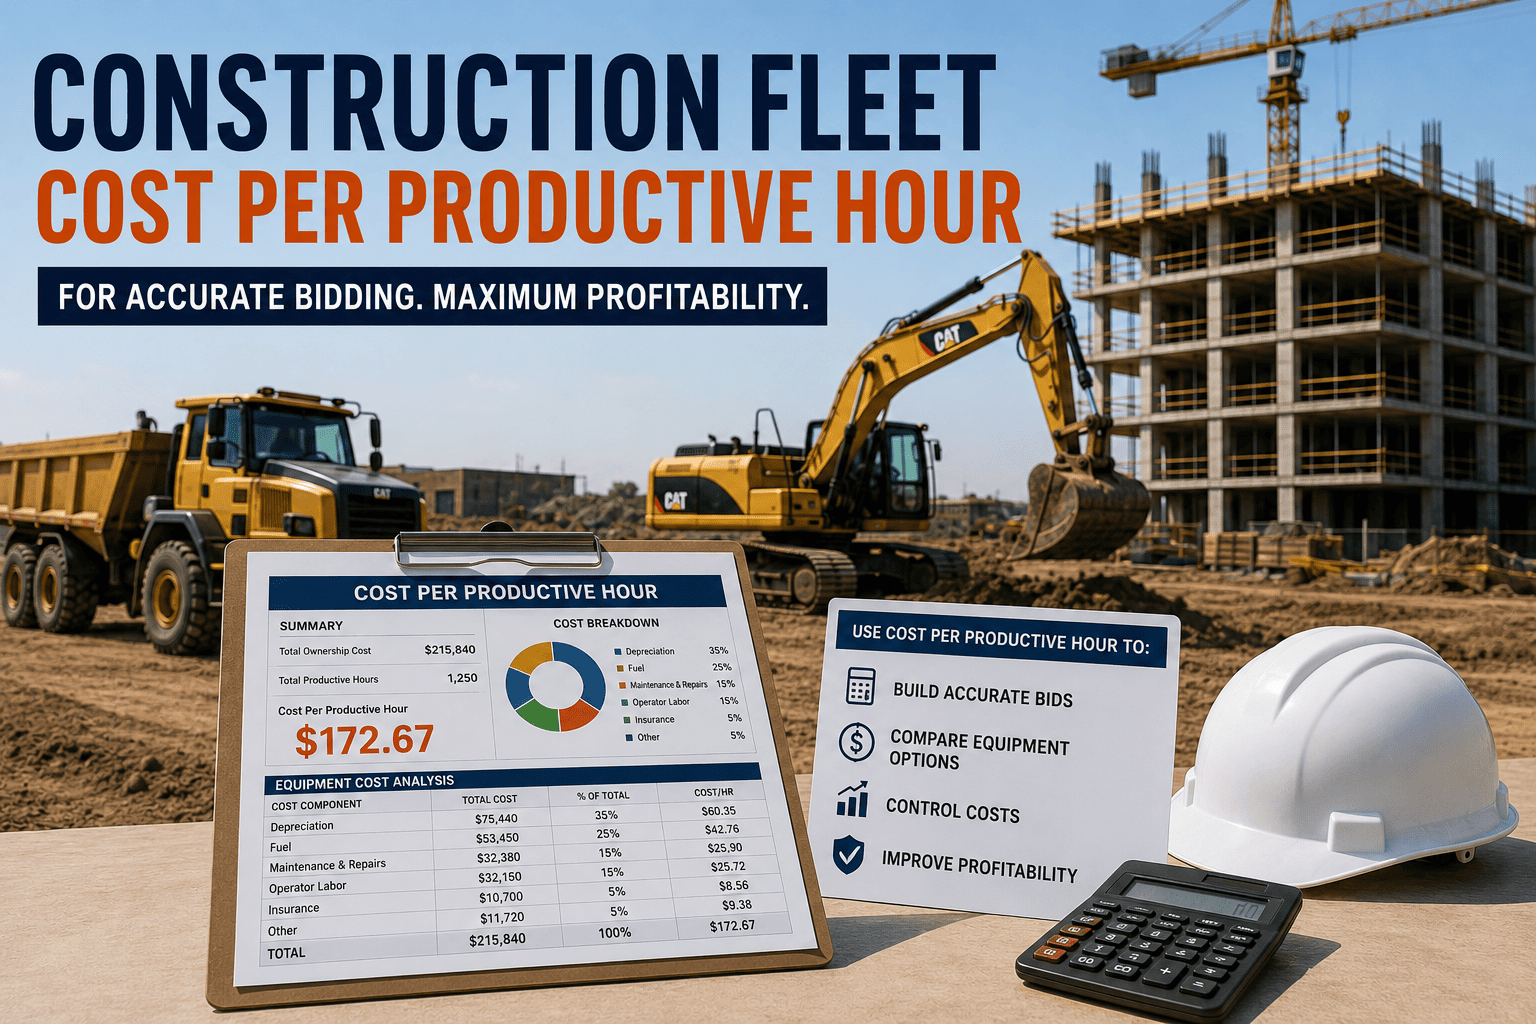
A backhoe that costs $60 an hour to own and operate can still lose you money on a bid if it only produces 40 minutes of real work in every hour. Most contractors price jobs using a flat hourly rate pulled from a rental sheet or an old spreadsheet, then wonder why a "profitable" bid ends up breaking even. The number that actually protects your margin is cost per productive hour — what a machine truly costs for every hour of work it delivers, not just every hour it sits on site.
Cost per productive hour is calculated as total hourly ownership and operating cost divided by utilization rate. A machine costing 65 dollars per clock hour but working at only 65 percent utilization actually costs 100 dollars per productive hour. Bidding on the clock-hour number instead of the productive-hour number is the single most common reason construction bids come in profitable on paper and underwater in the field.
Why Cost Per Productive Hour Beats a Flat Hourly Rate
Every equipment rate sheet lists a number: excavator, 65 dollars an hour, dozer, 80 dollars an hour. Estimators plug that number straight into the bid and move on. The problem is that number describes what the machine costs while the clock is running, not what it costs to get a unit of work finished. Weather delays, mobilization, operator breaks, waiting on trucks, and mechanical downtime all eat into the hours a machine is actually producing. A machine that's on the clock for 10 hours a day but only cutting, digging, or paving for 7 of those hours has a real cost per productive hour that's 30 to 40 percent higher than the rate sheet suggests.
This gap is invisible until the job is finished and the numbers come in short. Contractors who track only clock-hour rates consistently underbid equipment-heavy scopes like earthwork, paving, and grading, because the rate sheet hides the utilization problem entirely. Fixing this starts with separating two numbers that estimators often treat as one.
What Counts as "Total Hourly Cost"
Total hourly cost combines ownership cost (depreciation, financing, insurance, taxes) and operating cost (fuel, maintenance, repairs, wear parts, operator wages). Neither number alone tells the full story — a machine can look cheap on ownership cost and expensive on operating cost, or the reverse, and only the combined figure reflects what it actually costs to run.
Ownership Cost Components
Purchase price minus resale value, spread across expected life hours, plus financing interest, insurance, and property tax. A machine used heavily spreads this fixed cost across more hours and lowers its ownership cost per hour — which is exactly why underutilized equipment is so expensive to keep on the books.
Operating Cost Components
Fuel or electricity, scheduled maintenance, wear parts like tires and cutting edges, unscheduled repairs, and the operator's fully burdened wage. Operating cost usually swings more than ownership cost from job to job because site conditions, fuel prices, and maintenance history vary.
Stop Bidding Off Last Year's Rate Sheet
FleetRabbit tracks ownership cost, operating cost, and real utilization for every machine in your fleet, and turns it into a live cost-per-productive-hour figure your estimators can trust. You can start a free trial with three machines to see your true numbers, or book a demo to walk through your fleet with our team.
How Utilization Rate Quietly Wrecks Bid Accuracy
Utilization rate is the percentage of clock hours a machine spends doing productive work versus idling, waiting, traveling within the site, or sitting down for repairs. It is the single biggest driver of the gap between a rate-sheet price and a true bid price, and it varies enormously by machine type, site conditions, and crew coordination.
- Uses a flat hourly cost from a spreadsheet or rental quote
- Assumes the machine works every clock hour it's billed for
- Ignores mobilization, idle time, and mechanical downtime
- Margin erodes silently and shows up only at project close-out
- Divides true hourly cost by actual utilization rate from field data
- Reflects what the machine really costs to finish the scope
- Accounts for weather, waiting time, and downtime patterns
- Margin is protected because the bid matches field reality
Typical Utilization Rates by Machine Type
Utilization is not the same across a fleet. Excavators on a steady dig-and-load cycle often run 70 to 80 percent utilization. Dozers on grading work, where they wait on other equipment or reposition frequently, often sit closer to 55 to 65 percent. Cranes and specialty lift equipment, which spend significant time staged and waiting on rigging, frequently fall to 40 to 55 percent. Bidding all three machine types off the same assumed utilization number is one of the fastest ways to misprice a multi-equipment scope.
Calculating Your Cost Per Productive Hour in Four Steps
Sample Cost Per Productive Hour by Machine Class
| Machine Type | Clock-Hour Cost | Typical Utilization | True Cost Per Productive Hour |
|---|---|---|---|
| Mid-Size Excavator | 60 to 70 dollars | 70 to 80 percent | 80 to 95 dollars |
| Dozer | 75 to 90 dollars | 55 to 65 percent | 120 to 150 dollars |
| Motor Grader | 70 to 85 dollars | 60 to 70 percent | 105 to 130 dollars |
| Mobile Crane | 150 to 220 dollars | 40 to 55 percent | 300 to 450 dollars |
| Dump Truck | 45 to 55 dollars | 65 to 75 percent | 62 to 80 dollars |
These figures are directional starting points, not a substitute for your own fleet data. Every yard, climate, and crew is different, which is why estimators who rely on published averages instead of their own machine history still end up with wide bid variance from job to job.
Turning This Into a Live Number With FleetRabbit
Spreadsheet-based cost tracking goes stale the moment fuel prices move, a machine ages past its depreciation schedule, or a repair pattern emerges. FleetRabbit pulls ownership cost, live fuel and maintenance spend, and actual utilization data from telematics into one dashboard, so every machine's cost per productive hour updates automatically instead of waiting for a quarterly spreadsheet refresh.
Estimators building a bid can pull the current figure for any machine in seconds rather than guessing from a static rate card. Fleet managers can see immediately which machines are dragging down margin because of low utilization, and decide whether that's a scheduling fix, a maintenance issue, or a candidate for sale. Contractors using real-time cost-per-productive-hour data in their bidding process typically tighten estimate-to-actual variance considerably within the first few bid cycles, because the number in the estimate finally matches the number the job actually produces.
What Changes Once Estimators Have Real Numbers
Bid line items for equipment stop being a guess and start being a defensible figure backed by your own fleet's history. That matters most on competitive public bids, where a few dollars per hour on a multi-week earthwork scope is the difference between winning the job profitably and winning it at a loss. If you want to see what this looks like against your own fleet, you can book a demo and bring a recent job's equipment numbers to compare.
Frequently Asked Questions
Bid With Real Numbers, Not Rate-Sheet Guesses
FleetRabbit turns ownership cost, operating cost, and real utilization data into a live cost-per-productive-hour figure for every machine in your fleet, so your next bid reflects what the job will actually cost. Sign up and connect your fleet in minutes, or book a demo to see it against your own equipment numbers.







