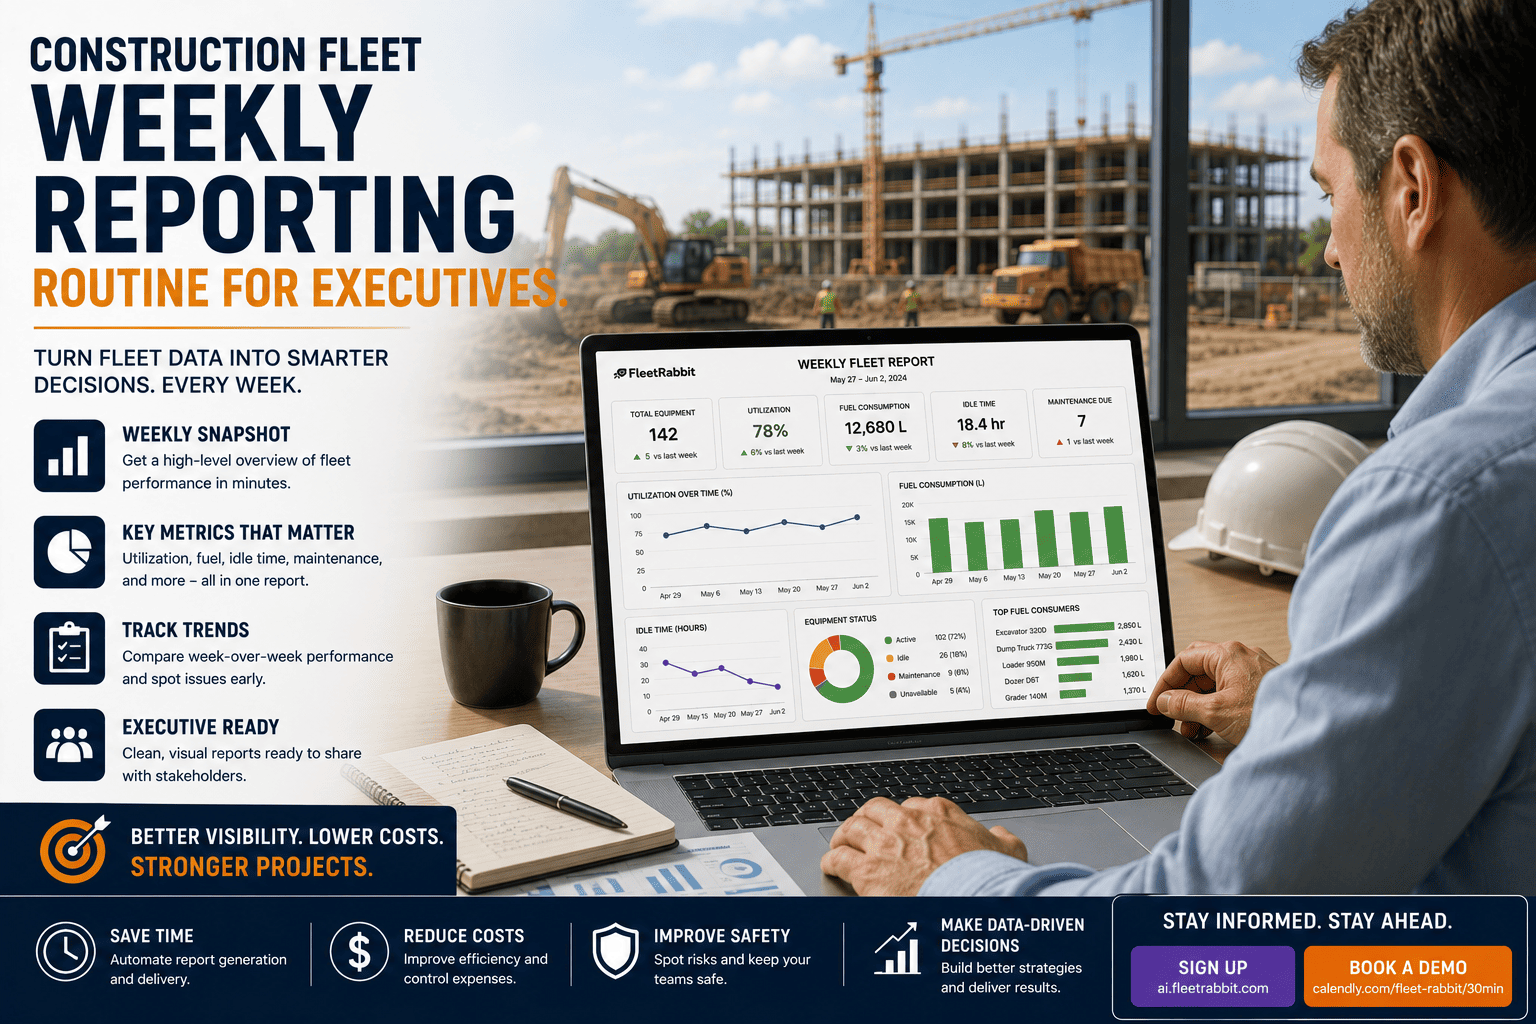
Every Friday afternoon, someone on the team closes their laptop tabs, opens a spreadsheet, and starts pulling numbers from three different systems: fuel card data from one login, maintenance records from another, and GPS mileage from a third. Two hours later, a PDF goes out to leadership. By the time an executive opens it Monday morning, the numbers are already five days old, and half the questions they actually care about, like which equipment is sitting idle or which site is bleeding maintenance cost, aren't even in it. Construction fleets don't have a data problem. They have a reporting problem, and it's costing hours every single week that could go toward actually managing the fleet instead of describing it after the fact.
Executives ignore weekly fleet reports that are manually built, days out of date, and packed with numbers that don't connect to a decision. The reports that actually get read cover five areas: safety, maintenance, utilization, cost, and availability, delivered automatically on the same day every week with the same format executives already recognize. Automating this routine turns a Friday afternoon spreadsheet chore into a five-minute Monday morning read that leadership actually opens.
The Weekly Cycle Behind Every Fleet Report
A construction fleet generates its reporting data every day of the week, whether anyone is watching or not. The problem is that most fleets only look at it once, right before the report is due, instead of tracking it as it happens.
Why Most Weekly Fleet Reports Get Ignored
Fleet managers aren't lacking effort. They're producing reports that fail before an executive even opens the file. The problems tend to repeat across every construction fleet that struggles to get leadership engaged with its numbers.
Too Much Data, No Clear Decision
A report listing twenty-five metrics with equal visual weight forces the reader to do the prioritizing themselves. Most executives don't have time for that, so they skim the top, see nothing urgent flagged, and close the file without absorbing anything useful.
Manually Built Means Already Outdated
If a report takes half a day to assemble by hand, it's describing last week's fleet, not this week's. By the time it reaches leadership, decisions that should have been made days earlier, like reassigning idle equipment or approving an urgent repair, have already been delayed.
Inconsistent Format Breaks Trust
When a report's layout, metrics, and terminology change from week to week depending on who built it, executives can't compare this week against last week at a glance. Consistency is what makes a report scannable in under five minutes instead of requiring a full re-read every time.
FleetRabbit pulls safety, maintenance, utilization, cost, and availability data into one consistent report, delivered automatically the same day every week. Sign up and see your first automated report before Friday.
The Five Reports Executives Actually Read
Not every metric deserves a slot in a weekly executive report. The reports that hold attention are the ones tied directly to a decision leadership might need to make that week. Construction fleets that get this right narrow their weekly summary down to five areas.
What An Executive-Ready Report Actually Looks Like
Building a report executives will actually open comes down to matching the format to how leadership reads, not how the data happens to be stored in the source systems.
Lead With The Number That Matters
Every section should open with one headline figure, like utilization percentage or unplanned downtime hours, large enough to read in a glance before any supporting detail. Executives should be able to understand fleet health from the top of the report alone.
Flag Only What Changed
Instead of repeating every metric at full detail every week, highlight what moved since the last report. A cost that jumped, a utilization rate that dropped, or a safety metric trending the wrong direction deserves attention. A number sitting flat where it always sits doesn't.
Keep The Same Layout Every Week
Consistency lets an executive scan a report in the same order every time, building familiarity that makes each week's read faster than the last, instead of hunting for where a metric moved to this time.
Deliver It On A Fixed Schedule
Reports that arrive at an unpredictable time train recipients to ignore them. A report that lands in the same inbox at the same time every week becomes part of an executive's routine instead of one more email competing for attention.
Turning This Into An Automated Routine
The fastest way to fix a broken reporting habit isn't asking the team to work faster, it's removing the manual assembly step entirely. Automated fleet reporting platforms pull live data from GPS, telematics, maintenance systems, and fuel cards, and generate the same five-part report every week without anyone opening a spreadsheet. Instead of a fleet manager losing a Friday afternoon to copy-paste work, the report builds itself in the background and lands in leadership's inbox on schedule, already formatted, already accurate, and already tied to the numbers that matter.
FleetRabbit was built around exactly this routine. Safety, maintenance, utilization, cost, and availability data flow into one dashboard and one recurring report, so fleet managers stop rebuilding the same document from scratch every week and executives finally get a report worth opening. Teams that want to see it against their own fleet's data can book a demo and walk through a sample report built from their actual assets before rolling it out fleet-wide.
FleetRabbit automatically builds your weekly safety, maintenance, utilization, cost, and availability report, delivered on schedule with no manual spreadsheet work. Turn Friday afternoon report-building into a five-minute setup that runs itself every week.







