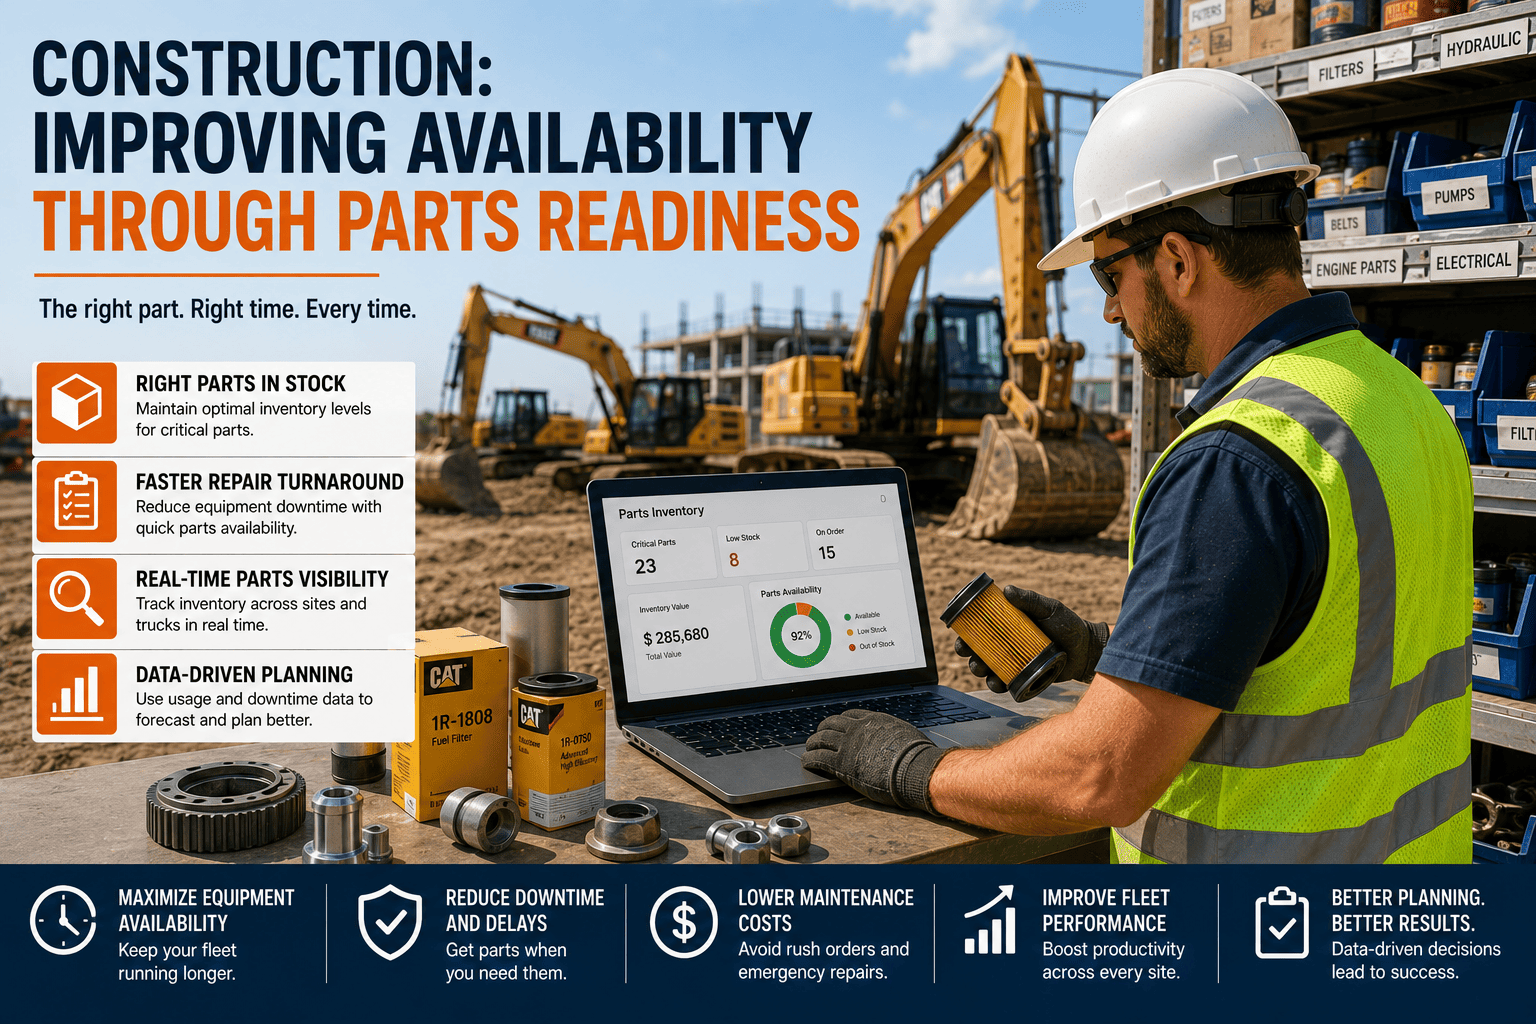
A dozer breaks down on a Tuesday morning. The mechanic gets there fast, diagnoses the problem in twenty minutes, and then waits three more days for the part to arrive. The machine wasn't down because nobody noticed the failure. It was down because nobody had the part on the shelf. This is the story behind most "unplanned" downtime in construction, and it rarely gets fixed by working harder. It gets fixed by planning parts the same way you plan maintenance.
Equipment availability depends less on how fast a technician can fix a machine and more on whether the right part is already on hand. Roughly 23 percent of unplanned downtime traces back to a missing spare part, not a missing skill. FleetRabbit uses maintenance history and failure patterns to flag which parts a machine will likely need before it breaks, so critical spares are staged ahead of the repair instead of ordered after it.
The Hidden Link Between Parts and Uptime
Fleet managers usually track uptime, repair time, and technician performance closely. Parts availability gets far less attention, even though it quietly decides how long a repair actually takes. A skilled technician with no part in stock is no faster than an empty bay.
Understocking Costs More Than It Looks Like
When a critical part isn't on the shelf, the repair doesn't get faster, it gets more expensive. Emergency orders bypass normal procurement, so the same part that costs one price on a standard order can cost three to five times more when it has to arrive overnight to stop a machine from sitting idle.
Overstocking Is Just as Costly, Only Quieter
The opposite mistake rarely shows up on a downtime report, but it still drains the budget. Carrying costs from excess inventory, tied-up capital, and parts that slowly become obsolete typically consume 20 to 30 percent of total inventory value every year, money spent on parts that may never get used.
FleetRabbit connects maintenance history directly to your parts inventory, so stocking decisions come from real failure patterns instead of habit. Sign up for free and see which parts your fleet actually needs on hand.
Not Every Part Deserves the Same Attention
Most fleets discover that only 15 to 20 percent of their parts inventory is genuinely critical to keep on hand. Sorting parts into clear tiers, rather than treating every SKU the same way, is what makes a parts program manageable instead of overwhelming.
| Class | What Belongs Here | Stocking Approach | Review Frequency |
|---|---|---|---|
| Class A: Critical | High failure risk, long lead time, stops the machine cold | Always in stock, minimum one unit as insurance | Quarterly |
| Class B: Moderate | Delays repair but does not halt operations immediately | Lower minimums, faster reorder cycle | Semi-Annually |
| Class C: Low Priority | Low cost, low criticality, widely available | Order as needed, minimal safety stock | Annually |
How Classification Changes the Math
For a true Class A part, the holding cost of keeping one in stock is almost always a rounding error compared to the cost of the downtime it prevents. Once a part is correctly classified, the stocking decision stops being a debate and becomes a simple, defensible rule your whole team can follow.
Building a Parts Readiness System
Turning scattered parts data into a system that actually predicts what you need takes a handful of concrete steps, not a full inventory overhaul.
Link Every Part to the Asset It Serves
Connect each SKU in your inventory to the specific machines it fits, so the system knows exactly which repair history to watch when predicting future part demand.
Set Min-Max Thresholds by Class
Give Class A parts higher minimum stock levels and automatic reorder triggers, while letting Class C parts run leaner without tying up unnecessary capital.
Read Failure Trends, Not Just Usage Logs
Use maintenance history to spot which components fail repeatedly on which machines, then stage those specific parts ahead of the next scheduled service.
Automate the Reorder, Not Just the Alert
A low-stock notification only helps if someone acts on it fast. Automated reorder triggers close that gap so critical spares are already inbound before the shelf goes empty.
Metrics Worth Watching Every Month
A parts readiness program is only as good as the numbers behind it. Fleets that track a short list of KPIs consistently outperform those that only look at downtime after the fact.
| KPI | What It Tells You | Healthy Target |
|---|---|---|
| Fill Rate | Percent of part requests met immediately from stock | Near 100% for Class A |
| Stockout Rate | How often a needed part is not on the shelf | As close to zero as possible |
| Days of Supply | How long current stock lasts at typical usage | Matched to supplier lead time |
| Dead Stock Percentage | Share of inventory that has not moved in a year | Reviewed and reduced regularly |
Bring your current parts list to a live session and see exactly which items should be classified as critical. Book your demo and get a readiness plan built around your equipment.
Frequently Asked Questions
Equipment availability is rarely won in the repair bay. It is won weeks earlier, in the decision about which parts sat on the shelf before the breakdown ever happened. Sign up for free to connect your maintenance history to a smarter parts plan, or book a demo to see how FleetRabbit flags your next critical part before it runs out.
Stop losing days to overnight shipping and emergency orders. FleetRabbit turns your maintenance history into a parts readiness plan, so the right spare is on the shelf before the machine ever goes down.







