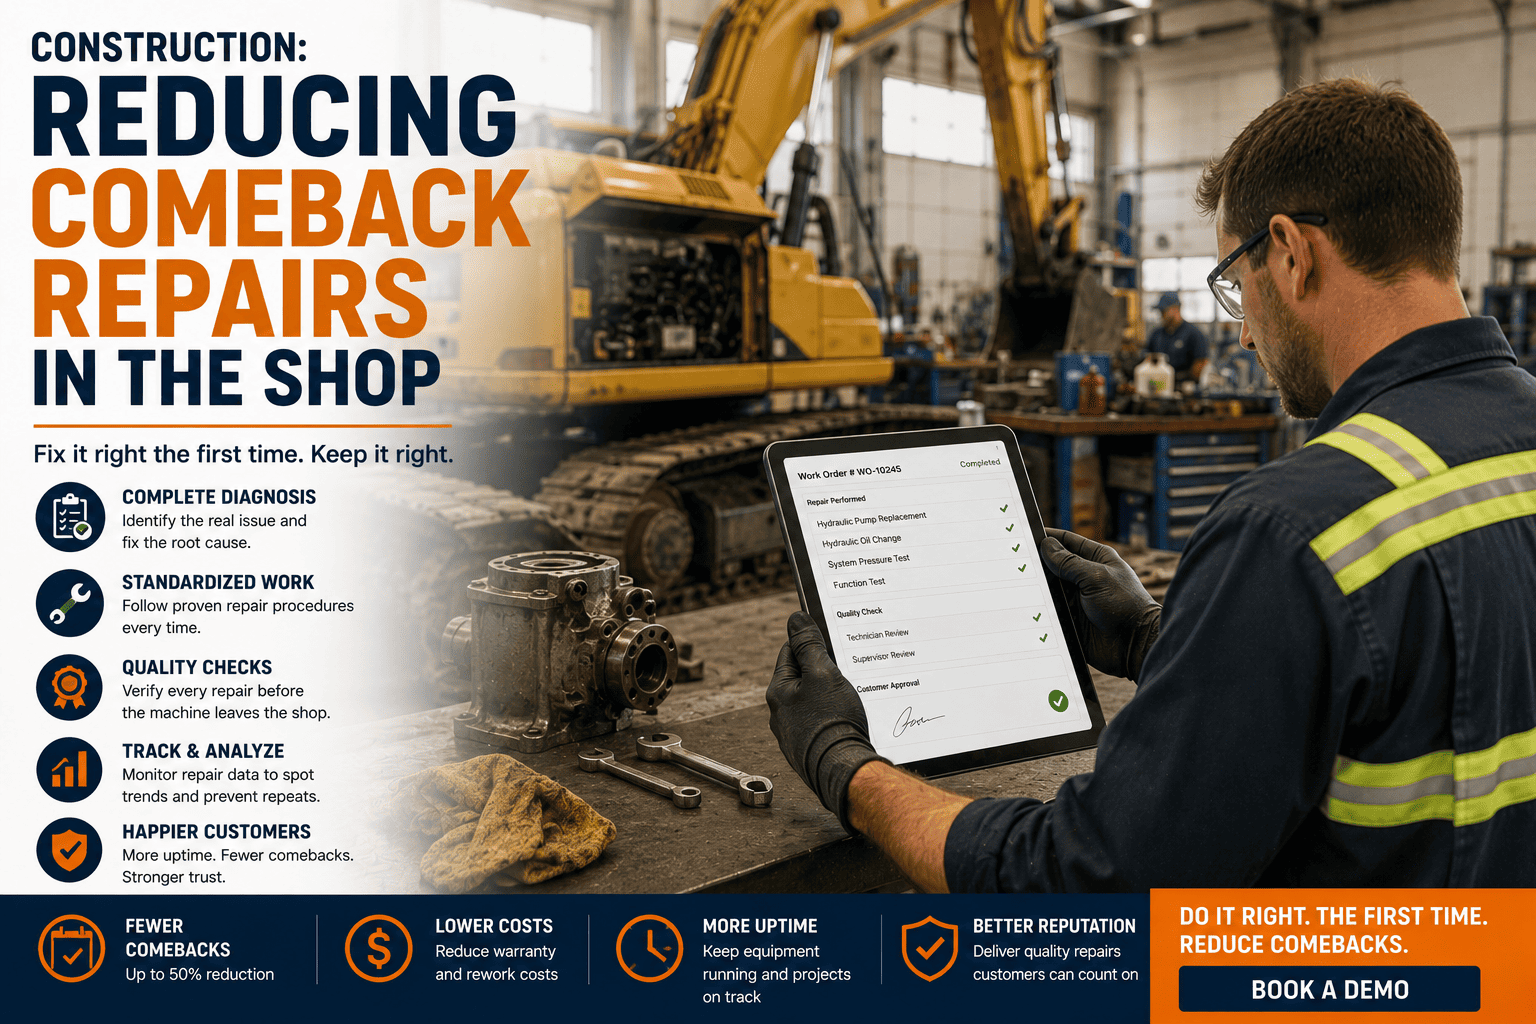
A technician closes a work order, the machine rolls back onto the job site, and three days later it's back in the shop for the exact same problem. That's a comeback repair, and it's one of the most expensive words in a construction equipment manager's vocabulary. It doesn't just cost a second round of labor and parts. It costs a second round of downtime, a second disruption to the job schedule, and a growing sense among your crews that the shop can't be trusted to fix things right the first time.
Industry benchmarks put a healthy comeback rate at under 3 percent of completed repairs, yet many construction fleets run 8 to 15 percent because root causes go undiagnosed. Every comeback repair adds 1 to 3 extra shop hours, delays the next job in queue, and typically costs 60 to 90 percent of what the original repair cost, again. Fixing this is less about hiring better technicians and more about giving them better information before they ever pick up a wrench.
What Counts as a Comeback Repair
A comeback repair happens when a machine returns to the shop for the same fault, or a directly related fault, within a defined window, usually 30 to 90 days depending on the component. It's different from routine wear replacement. If a hydraulic hose fails and gets replaced, then a second unrelated hose fails four months later, that's normal wear. If the same hose fails again six weeks after replacement because the root cause, a chafing point or a pressure spike, was never addressed, that's a comeback. The distinction matters because comebacks are almost always preventable, while general wear is not.
Why Excavators, Loaders, and Compactors Are Especially Comeback-Prone
Construction equipment operates in conditions that hide root causes better than almost any other asset class. Dust and debris disguise electrical faults. Hydraulic systems mask slow leaks until a hose bursts under load. Undercarriage components wear unevenly depending on terrain, so a track adjustment that looks correct in the shop can fail again within days on a slope. Technicians working against tight job-site deadlines often treat the symptom, tighten the fitting, top off the fluid, swap the part, without time to trace the failure back to its source. That shortcut is exactly what produces a comeback.
FleetRabbit gives technicians instant access to a machine's complete repair timeline before they touch it, so recurring faults get diagnosed at the root instead of patched again. Sign up free and see your comeback rate on day one.
The Real Cost of Sending a Machine Back Twice
A comeback repair rarely costs the same as the first visit, it usually costs more. The second visit often needs additional diagnostic time because the obvious fix already happened and failed. Parts already installed may need to be removed and inspected again. And the machine has now been down twice for the same underlying issue, which means the job site absorbed two separate schedule disruptions instead of one thorough fix.
| Comeback Repair Cost Driver | Typical Added Cost | Root Cause |
|---|---|---|
| Repeat Diagnostic Time | 1 to 2 additional labor hours | Technician starts from scratch without prior repair notes |
| Duplicate Parts Order | 200 to 900 dollars per part | Wrong part swapped first, or correct part failed due to unresolved root cause |
| Second Downtime Window | 1 to 3 additional idle days on site | Machine pulled from active job a second time for the same fault |
| Shop Capacity Loss | 1 bay-day per comeback | Comeback repairs displace new work orders waiting in queue |
| Crew Confidence Cost | Hard to quantify, high impact | Operators stop trusting machine reliability, request equipment swaps |
Reading Your Shop's Real Comeback Rate
Most shops underestimate their comeback rate because it's rarely tracked as its own metric. First-time fix rate and comeback rate are two sides of the same coin. First-time fix rate measures how many jobs close successfully on the first visit, industry average sits around 75 percent, with best-in-class shops reaching 88 to 90 percent and struggling shops falling to 60 percent or lower. Comeback rate measures the mirror image, repairs that return for the same fault, and a well-run shop should keep that number under 3 percent.
The gap between those two numbers rarely comes down to technician skill. It comes down to whether the person doing the repair has the full picture, past repair history on that exact machine, known failure patterns across similar units, and whether the correct parts were staged before the job started. Shops that close that information gap consistently outperform shops that rely on technician memory alone.
The Four Recurring Root Causes Behind Comeback Repairs
Across construction fleets, four patterns explain the overwhelming majority of comeback repairs. Symptom-only repairs address the visible fault, a leaking seal, a tripped sensor, without checking what caused it to fail early. Missing repair history means a technician has no way of knowing this is the third time this hydraulic cylinder has failed, information that would change the entire diagnostic approach. Incomplete parts matching happens when a lower-cost or slightly incorrect part gets installed under job-site time pressure, and it fails again under the same stress the original part couldn't handle. Undocumented operator behavior, like consistently overloading a specific machine, keeps causing the same component to fail because nobody flagged the pattern back to the operations team.
| Root Cause | How It Shows Up | Fix |
|---|---|---|
| Symptom-Only Repair | Part replaced, underlying stress point untouched | Require a root-cause note before closing any work order |
| Missing Repair History | Technician unaware this is a repeat failure | Surface full machine history automatically at job open |
| Incomplete Parts Matching | Wrong grade or spec part installed under time pressure | Flag verified part numbers per machine model before dispatch |
| Undocumented Operator Behavior | Same component fails across shifts or operators | Log usage patterns alongside repair records for pattern detection |
A Practical Path to Fewer Comebacks
Reducing comeback repairs doesn't require a complete overhaul of your shop process. It requires closing the information gap at the exact moment a technician starts a job.
Step One: Pull the Machine's Full History Before Diagnosis Starts
Before a technician touches a machine, they should see every prior repair on that unit, not just the most recent one. A pattern of three seal failures in eight months tells a completely different diagnostic story than a single isolated failure.
Step Two: Require a Root-Cause Field on Every Closed Work Order
Closing a repair with only "replaced part" as the note gives the next technician nothing to work with. Requiring a short root-cause entry, even one sentence, builds the dataset that eventually predicts and prevents the next failure.
Step Three: Match Parts to Verified Specifications, Not Convenience
Comebacks caused by incorrect or substandard parts are among the easiest to eliminate. Verifying the correct part number against the machine's actual model and serial number before the job starts removes a major source of repeat failure.
Step Four: Track Comeback Rate as Its Own Shop Metric
What doesn't get measured doesn't improve. Reviewing comeback rate monthly, by technician, by component, and by machine, reveals exactly where the process is breaking down and where training or process changes will have the biggest impact.
FleetRabbit automatically surfaces complete repair history, flags recurring failure patterns, and verifies parts before dispatch, so the same fault doesn't keep coming back to your shop. Book a demo and walk through your own comeback data with our team.
What Good Looks Like: Benchmarks Worth Targeting
Shops that treat comeback repairs as a tracked, manageable metric tend to converge on a similar set of numbers. Use these as a starting point for your own targets, then adjust based on your fleet's age and job-site conditions.
Frequently Asked Questions
The Bottom Line
Comeback repairs aren't a technician problem, they're an information problem. Every repeat visit to the shop is a signal that the person doing the repair didn't have what they needed, full history, verified parts, or a clear root cause, before they started. Closing that gap is one of the highest-leverage changes a construction fleet can make, because it reduces cost, protects shop capacity, and keeps machines on the job site instead of cycling back through the bay.
FleetRabbit connects every machine's full repair history, verified parts data, and root-cause tracking into one view, so your technicians stop guessing and your comeback rate starts dropping. Get started free, no credit card required.







