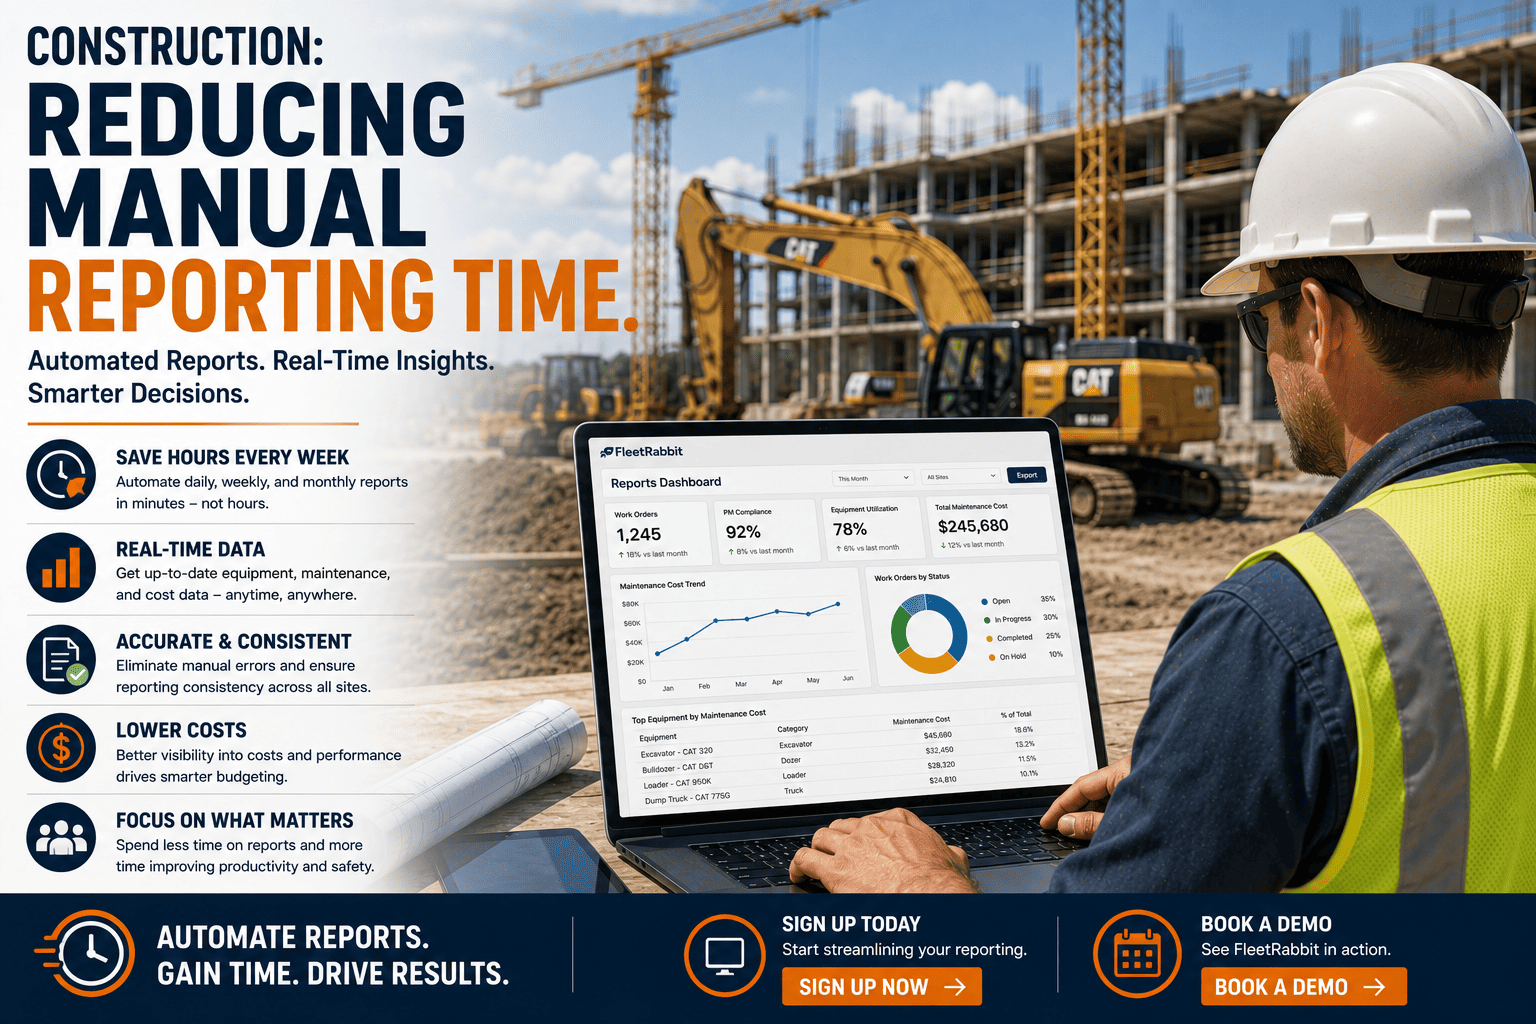
Every Friday afternoon, somewhere across the country, a construction fleet manager sits down with three browser tabs open, a telematics portal, an accounting export, and a half-finished spreadsheet, and starts building the same report they built last week. Copy the utilization numbers. Cross-reference maintenance costs. Double-check a formula that broke last month and never got fixed. By the time the report reaches management, it's already five days behind reality, and the fleet manager has lost an afternoon they'll never get back.
The average construction fleet manager spends 6 to 8 hours per week manually compiling reports from spreadsheets, telematics portals, and accounting software. Across a year, that's over 300 hours, nearly two months of full-time work, spent building reports instead of acting on what they show. Automated reporting typically cuts that weekly administrative load by 60 to 75 percent.
Where Your Reporting Week Actually Goes
Manual reporting rarely feels like one big task, it feels like a dozen small ones stacked on top of each other. Broken down across a typical week, the time spent building a single fleet report splits fairly predictably.
Notice that only one of these four categories, calculating metrics, is actually analysis. The rest, roughly 78 percent of the time, is pure administrative overhead: chasing numbers across disconnected systems, fixing spreadsheet errors, and formatting a document that will be outdated again within days.
The Data Lives in Too Many Places
Utilization hours sit in a telematics portal. Maintenance costs live in work order software. Fuel spend comes from a card provider's export. Inspection results might still be on paper. None of these systems talk to each other, so someone has to manually stitch them together every single reporting cycle, and that someone is usually the fleet manager.
Spreadsheet Errors Compound Silently
Research on spreadsheet reliability consistently finds that a very high share, often cited around 88 percent, of working spreadsheets contain at least one error. A single wrong formula or a mistyped number doesn't announce itself, it just quietly skews a utilization rate or a cost-per-hour figure until someone questions why the numbers don't match what the shop floor is seeing.
FleetRabbit automatically pulls utilization, maintenance, fuel, and safety data from every connected system into one live dashboard, so nothing needs to be manually compiled again. Sign up free and see your first automated report today.
What Automated Reporting Actually Replaces
It helps to see exactly which manual habits disappear once reporting runs on live, connected data instead of exports and copy-paste.
| Report Type | Manual Process | Automated Process |
|---|---|---|
| Utilization Report | Export telematics hours, calculate rate by hand in a spreadsheet | Calculated automatically from live operating hours, updated daily |
| Maintenance Cost Report | Pull work order totals, match against asset list manually | Aggregated per asset automatically from closed work orders |
| Safety and Inspection Report | Chase paper checklists, compile completion rate by hand | Completion and defect data compiled in real time from digital inspections |
| Total Cost of Ownership | Combine fuel, maintenance, and depreciation from three separate exports | Combined automatically per asset for replacement and budget decisions |
The Friday Afternoon Problem, Solved
The clearest way to see the difference automated reporting makes is to look at the same Friday afternoon, run two different ways.
What Executives Actually Gain
The time saved is only half the value. When a dashboard updates automatically from telematics and work orders instead of a manually built PDF, management stops questioning whether the numbers are current and starts trusting them enough to actually act on them, faster budget decisions, quicker replacement calls, and fewer meetings spent debating whose spreadsheet is right.
FleetRabbit replaces manually built weekly reports with a live dashboard covering utilization, maintenance cost, PM compliance, and safety, updated automatically as data comes in. Book a demo to see it running against your own fleet data.
Frequently Asked Questions
The Bottom Line
Manual reporting doesn't just cost hours, it costs trust, timeliness, and the attention that should be going toward actually managing the fleet instead of describing it after the fact. The moment reporting becomes automatic, that entire cycle changes, decisions get made on data that's current instead of five days stale, and the fleet manager gets their Friday afternoons back for work that actually moves the operation forward.
FleetRabbit automatically generates safety, maintenance, utilization, and cost reports from your live fleet data, giving managers and executives real-time insight without the manual compiling. Get started free, no credit card required.







