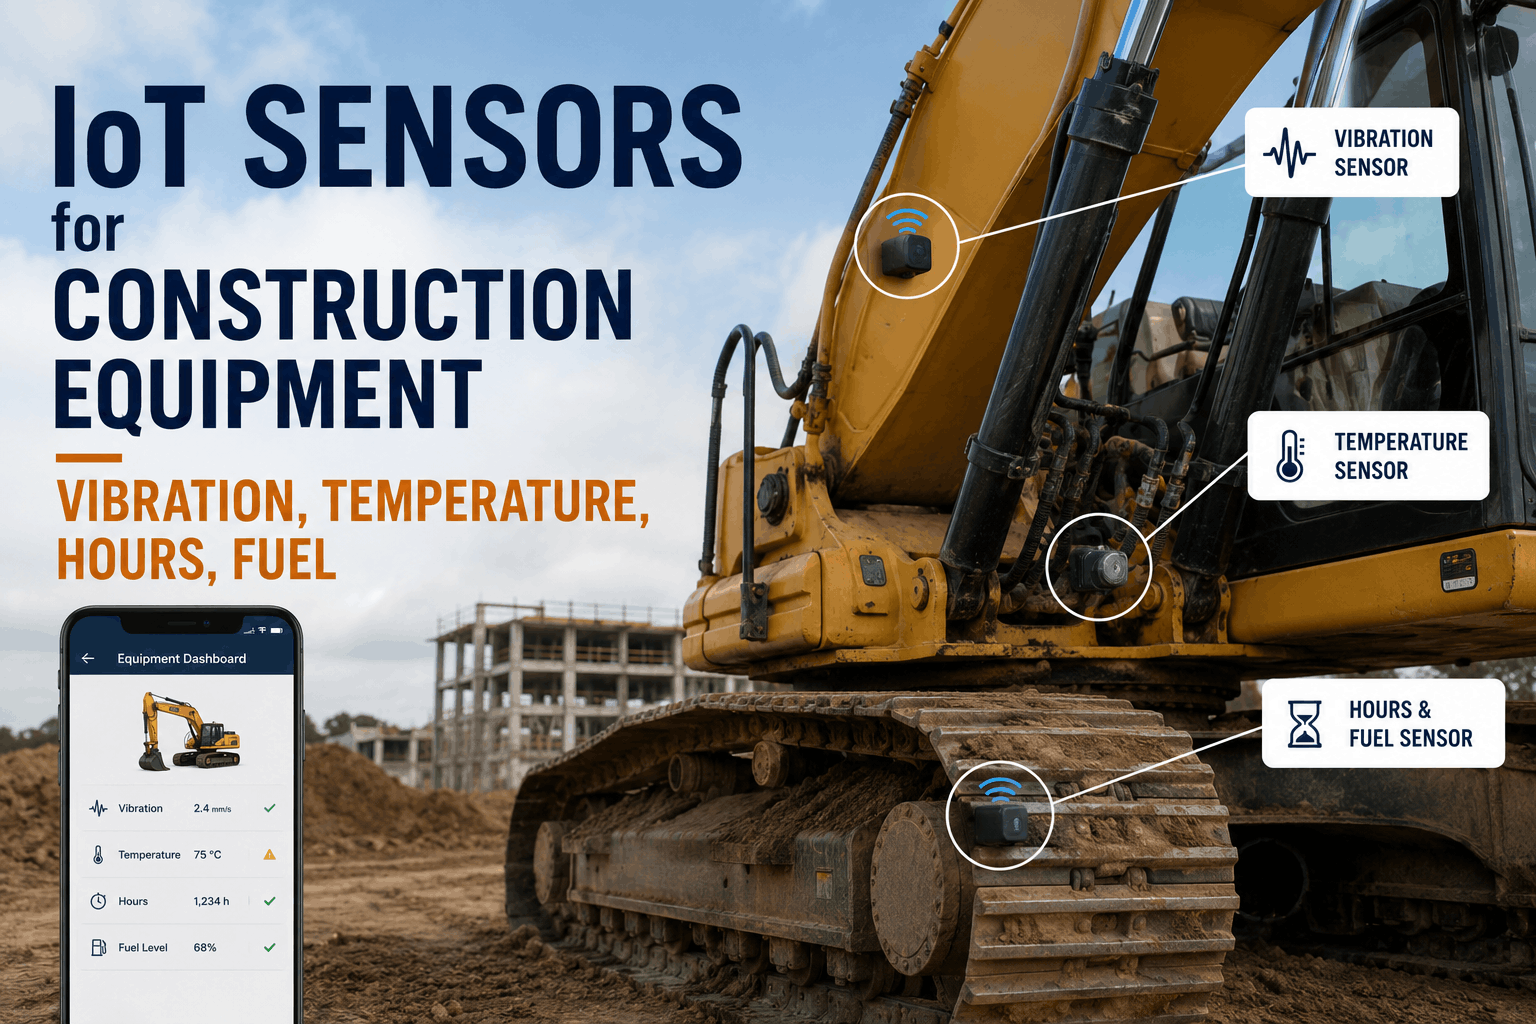
IoT sensors are the nervous system of modern construction equipment fleet management — without them, fleet managers are making maintenance decisions based on calendar assumptions, operators are reporting faults after failures have already occurred, and utilisation data is based on operator timesheets rather than actual engine activity. A vibration sensor detects bearing degradation weeks before audible noise begins. A temperature sensor flags a hydraulic system running hot before a hose fails mid-lift. An engine-hour counter triggers preventive maintenance at the exact correct interval regardless of how many calendar days have passed. A fuel-level sensor catches a slow tank leak — or a pilferage pattern — that would otherwise appear as unexplained fuel budget variance month after month. FleetRabbit integrates all four sensor categories into one unified fleet intelligence platform, turning raw sensor data into scheduled maintenance, automated alerts, and actionable utilisation reporting. Book an IoT sensor fleet demo with FleetRabbit.
FleetRabbit Equipment Intelligence
IoT Sensors for Construction Equipment — Vibration, Temperature, Hours, Fuel
IoT sensors for construction equipment — vibration, temperature, hours and fuel sensors explained. Install patterns, edge processing and data examples inside — how sensor-driven fleet intelligence eliminates reactive maintenance, reduces unplanned downtime, and gives construction fleets the equipment health visibility that paper-based inspection regimes cannot provide.
82%Of Equipment Failures Preceded by Detectable Sensor Signal
$4,800Average Cost of One Unplanned Downtime Event
3–5×ROI on Predictive vs Reactive Maintenance
72 HrsAverage Warning Window from Vibration Anomaly to Failure
The Four Core IoT Sensor Categories for Construction Equipment
Construction equipment operates in one of the harshest sensing environments imaginable — extreme dust, moisture, shock loading, wide temperature swings, high-vibration chassis, and constant electrical noise from diesel engines and hydraulic systems. Sensors that perform reliably in these conditions must be specifically rated for construction applications: IP67 or IP69K ingress protection, wide operating temperature ranges, shock-resistant housings, and CAN bus or J1939 integration to communicate with the equipment's existing onboard electronics. FleetRabbit's supported sensor ecosystem covers all four categories that drive construction fleet intelligence — vibration, temperature, engine hours, and fuel — each with dedicated data processing pipelines and alert logic built specifically for heavy equipment operating patterns.
Vibration Sensors
Bearing & Structural Health Monitoring
Triaxial accelerometers mounted at bearing housings, swing drives, final drives, and boom pivot points capture vibration signatures in three axes simultaneously. Healthy bearings produce consistent, low-amplitude frequency signatures. A developing fault — spalling, pitting, or cage damage — introduces characteristic frequency components that appear in the vibration spectrum weeks before audible noise or performance degradation becomes apparent. FleetRabbit's edge processing compares live vibration signatures against baseline profiles established during initial commissioning, flagging statistical deviations that indicate developing faults without generating alert fatigue from normal operational vibration.
Temperature Sensors
Thermal Monitoring Across Critical Systems
Thermocouple and RTD sensors monitor hydraulic oil temperature, engine coolant temperature, transmission fluid temperature, and hydraulic pump case drain temperature — the four thermal indicators most predictive of imminent construction equipment failure. Each system has a normal operating range and two alert thresholds: a caution band where the operator receives an advisory, and a critical band where automatic work order generation and supervisor notification occur. Hydraulic oil operating above 93°C accelerates seal degradation; coolant temperature excursions indicate cooling system capacity problems that compound across hot weather operating periods.
Engine Hour Counters
Precision PM Trigger & Utilisation Data
Engine hour counters integrated with the equipment's ECU via J1939 CAN bus provide the most accurate operating-hour data available — distinguishing between engine-running hours, PTO-engaged hours, and idle hours separately. This granularity matters because a machine logging 200 hours per month at 40% idle accumulates very different mechanical wear than the same hour count at 10% idle. FleetRabbit uses hour-counter data to trigger preventive maintenance at exact intervals, calculate true utilisation rates, and generate cost-per-productive-hour analytics that calendar-based tracking cannot produce.
Fuel Sensors: Beyond the Gauge
Standard equipment fuel gauges are notoriously imprecise — analogue float systems with ±10% accuracy, susceptible to sloshing on rough terrain, and completely blind to consumption rate, refuel events, or slow leak patterns. IoT fuel-level sensors replace or supplement the standard gauge with ultrasonic or capacitive measurement systems accurate to ±1–2%, continuously reporting absolute fuel level, consumption rate per hour, refuel volume and timestamp, and cumulative fuel burned against engine hours. This data serves three distinct purposes in FleetRabbit's platform: operational dispatch (is this machine fuelled for the next shift?), cost accounting (what is actual fuel cost per operating hour for each asset?), and exception detection (is fuel disappearing faster than operating hours justify?).
01
Ultrasonic Level Measurement
Ultrasonic fuel sensors mount through the tank top without contact with the fuel itself — eliminating corrosion, contamination, and float-arm failure modes. A sound pulse measures the distance to the fuel surface and calculates volume based on tank geometry profiles stored in the sensor firmware. Accuracy to ±1% across the full tank range, unaffected by equipment tilt, terrain slope, or fuel temperature variation. Suited to irregular tank geometries common in excavators, motor graders, and articulated dump trucks where standard float gauges are particularly inaccurate.
02
Consumption Rate Analytics
Rather than simply reporting instantaneous fuel level, FleetRabbit calculates rolling consumption rates — litres per engine hour over the last shift, the last week, and the trailing 30-day average. Consumption rate deviation alerts flag when a specific machine is burning fuel significantly faster than its own historical baseline, indicating a developing engine problem (injector wear, air filter restriction, turbocharger inefficiency) before the fault appears in fault code diagnostics. A 15% consumption rate increase sustained over three shifts is a high-confidence predictor of engine service need in the 50–150 hour window.
03
Refuel Event Logging
Every refuel event — defined as a fuel level increase exceeding a configurable threshold, typically 20 litres — is logged automatically with timestamp, GPS location, pre-refuel level, post-refuel level, and calculated volume added. This creates a complete fuel transaction record without requiring manual fuel log entries or fuel card reconciliation. Refuel events that occur outside designated refuel points, at unexpected times of day, or with volumes inconsistent with tank capacity trigger exception alerts for fleet manager review — providing the audit trail that fuel management audits require.
04
Theft & Pilferage Detection
Fuel pilferage in construction fleets typically appears as a slow, consistent discrepancy between fuel purchased and fuel consumed — difficult to detect without sensor-level data. FleetRabbit's fuel anomaly engine compares fuel consumption against engine hours for each asset and flags patterns where fuel level declines without corresponding engine-on events. A tank level drop of 30+ litres with no ignition event in the preceding window is a high-confidence pilferage signal that triggers immediate supervisor notification with GPS location and timestamp evidence attached.
FleetRabbit IoT Sensor Integration
Vibration. Temperature. Engine Hours. Fuel. Four Sensor Categories. One Fleet Intelligence Platform.
FleetRabbit integrates all four core IoT sensor categories into one construction fleet platform — real-time health alerts, hour-based PM triggers, fuel anomaly detection, and edge-processed vibration analysis. Stop reacting to failures and start predicting them.
Installation Patterns for Construction Equipment IoT Sensors
Sensor installation on construction equipment is not a plug-and-play exercise — mounting location, cable routing, connector selection, and power supply configuration all directly affect data quality and sensor longevity. A vibration sensor mounted 30cm from its ideal bearing-housing location produces attenuated signals that miss early-stage fault frequencies. A temperature sensor tapped into the wrong hydraulic circuit gives data that does not correlate with the failure mode it is supposed to predict. A fuel sensor installed without tank geometry calibration produces level readings that are accurate at mid-tank but drift significantly at the extremes. FleetRabbit's installation documentation and certified installer network address all four sensor categories with equipment-type-specific guidance.
Vibration
Stud-mount or adhesive triaxial accelerometers at bearing housings, with cable routing through existing cable conduit to the telematics gateway. Baseline capture run during commissioning at known-healthy equipment state. Mounting surface must be clean, flat metal in direct contact with the monitored component — not on covers or brackets with intervening air gaps
Temperature
Thermocouple probes installed in dedicated bung fittings on hydraulic reservoirs, engine coolant circuits, and transmission cases — not surface-mounted clip sensors which introduce ambient air interference. Cable routing away from exhaust components and hydraulic hoses carrying pressurised hot fluid. Sensor wiring shielded against engine electrical noise
Hours
J1939 CAN bus integration via the equipment's diagnostic port is preferred — provides ECU-authoritative hour data with no additional hardware beyond the telematics gateway. Where CAN bus access is restricted, current-sensing clamps on the starter motor circuit provide ignition-event detection accurate to ±2 minutes per shift. Avoid calendar-timer workarounds that fail to distinguish idle from productive hours
Fuel
Ultrasonic sensors installed through a dedicated tank bung fitting with custom depth calibration per tank geometry profile. Tank profile maps are generated during commissioning using a manual dip-stick reference at 10% fill increments. Capacitive sensors used where tank geometry or material prevents ultrasonic installation — both types require 12V or 24V switched power from the equipment's electrical system
Edge Processing: Why Sensor Data Must Be Processed On-Device
Raw IoT sensor data from construction equipment — particularly vibration data sampled at 1–10 kHz — generates data volumes that cannot be economically transmitted over cellular networks in their raw form. A single triaxial accelerometer sampling at 5 kHz produces roughly 3.6 GB of raw data per hour of operation. Transmitting this volume across a 20-machine fleet over LTE would consume hundreds of gigabytes of cellular data daily, at costs that dwarf the value of the insights produced. Edge processing — running signal analysis algorithms on the telematics gateway hardware installed on the equipment itself — solves this problem by transmitting only the derived metrics and alert triggers rather than the raw waveforms. FleetRabbit's edge processing architecture handles vibration FFT analysis, temperature trend calculation, fuel anomaly scoring, and utilisation metric aggregation on-device, sending compact structured data packets to the cloud platform at configurable intervals.
01
Vibration FFT Analysis On-Device
The telematics gateway runs Fast Fourier Transform calculations on raw accelerometer waveforms locally, converting time-domain vibration data into frequency-domain spectra without transmitting raw samples. Only the processed spectral summary — peak frequencies, amplitude at characteristic fault frequencies, and deviation from baseline — is transmitted to the FleetRabbit platform. This reduces vibration data transmission volume by over 99% while preserving all diagnostic information needed for bearing health assessment and fault frequency identification.
02
Local Threshold Alerting
Critical alert thresholds for temperature exceedances, vibration amplitude breaches, and fuel anomalies are evaluated on the edge device — not in the cloud. This means an alert is generated and can trigger a local output (cab warning light, buzzer, or operator display) within milliseconds of the threshold breach, without waiting for cloud round-trip latency. In a hydraulic overtemperature scenario where seconds matter for preventing seal damage, local alerting provides operator notification 4–8 seconds faster than cloud-dependent alert architectures.
03
Offline Data Buffering
Construction sites frequently operate in areas with intermittent cellular coverage — remote rural locations, underground works, and dense urban canyons all create connectivity gaps. FleetRabbit's edge devices buffer all sensor data locally during connectivity outages and synchronise automatically when signal is restored. Buffer capacity supports up to 72 hours of full sensor data without data loss, ensuring complete equipment health records even on sites where connectivity is unreliable throughout the working shift.
04
Adaptive Sampling Rates
Not all sensor data requires the same sampling frequency at all times. FleetRabbit's edge firmware implements adaptive sampling — vibration sensors sample at high frequency during operation and reduce to low-frequency monitoring during idle periods; fuel sensors sample more frequently during refuel events and at extended intervals during stationary overnight periods. Adaptive sampling reduces power consumption, extends device hardware life, and minimises data transmission costs while maintaining full diagnostic resolution during the operating periods that matter most.
From the Field
"We run a fleet of 18 excavators and 6 motor graders on a long-term civil infrastructure contract. Before IoT sensors, we were doing calendar-based oil changes and relying on operators to flag anything unusual — which meant we were either over-servicing machines that hadn't worked hard enough to need it, or missing developing faults that operators couldn't see or hear yet. After installing FleetRabbit sensors across the fleet, the first thing we caught was a swing drive bearing on one of our larger excavators showing vibration anomalies six weeks before any operational symptom appeared. We scheduled a planned bearing replacement during a weekend service window for $2,800 in parts and labour. The alternative — a field failure during production — would have been a minimum three-day crane-assisted recovery and transport, plus emergency parts freight, plus the downstream project delay costs. Our estimating team put the avoided cost at over $40,000 for that single event. The system paid for the first year of its fleet-wide subscription on that one catch."
Plant Manager
·
Civil Infrastructure Contractor — 24-Machine Fleet — Long-Term Site Contract
Sensor Data Examples: What the Numbers Actually Look Like
Understanding what IoT sensor data looks like in practice — and how FleetRabbit translates raw readings into actionable fleet intelligence — helps fleet managers evaluate what the platform will and will not tell them. The examples below are representative data patterns from construction equipment in normal operation, caution states, and developing-fault conditions. Real fleet data will vary by equipment make, model, age, duty cycle, and operating environment, but the structural patterns — baseline, deviation, threshold breach, alert — are consistent across equipment categories.
Vibration
Healthy swing bearing: 0.15–0.30 g RMS broadband, no peaks at fault frequencies. Early-stage spalling fault: 0.45–0.70 g RMS with emerging peak at bearing defect frequency (BPFO). Alert threshold: deviation exceeding 2 standard deviations from 30-day baseline at any characteristic fault frequency
Temperature
Normal hydraulic oil operating temperature: 60–82°C under load in ambient 25°C. Caution band: 83–92°C — operator advisory generated. Critical band: above 93°C — supervisor alert and automatic work order created. Engine coolant normal range: 82–95°C; exceedances above 100°C trigger immediate stop-work recommendation
Engine Hours
Productive hours vs idle hours split tracked separately. Target idle ratio for excavators: below 25%. Alert threshold: idle ratio above 35% sustained over a full shift triggers operator coaching notification. PM triggers generated at exact hour intervals — 250, 500, 1,000 hours — regardless of calendar days elapsed since last service
Fuel Level
Normal consumption: 12–18 L/hr for mid-size excavator under load, 4–6 L/hr at idle. Anomaly alert: consumption rate exceeding 125% of 30-day baseline for same operating conditions sustained over 4+ hours. Pilferage detection: fuel level drop exceeding 25 litres with no ignition event in preceding 60-minute window
Frequently Asked Questions
QDo IoT sensors work on older equipment without modern onboard electronics?
Yes. While J1939 CAN bus integration provides the richest data on equipment manufactured after approximately 2005, FleetRabbit's sensor ecosystem supports older equipment through standalone sensor installations that do not depend on existing onboard electronics. Vibration sensors, temperature sensors, and fuel sensors are all self-contained with independent power supplies and direct wireless or wired connections to the telematics gateway. Engine hours on older equipment without ECU access are captured via current-sensing clamps on the starter circuit or alternator output — providing ignition-event-based hour counting accurate to within minutes per shift without any modification to existing wiring.
QHow long does sensor baseline establishment take before meaningful alerts are generated?
FleetRabbit's vibration and consumption anomaly detection requires a baseline period to establish normal operating signatures for each specific machine — because healthy vibration levels and fuel consumption rates vary significantly between equipment makes, models, ages, and duty cycles. The baseline period is typically 2–4 weeks of normal operation, after which the system has sufficient data to distinguish genuine deviations from normal operating variation. Temperature threshold alerts are active from day one using manufacturer-specified operating ranges. Engine-hour PM triggers are active immediately upon entering current meter readings and PM interval configuration during onboarding.
QWhat happens to sensor data if the telematics gateway loses power or is damaged?
FleetRabbit telematics gateways include onboard flash storage with sufficient capacity to buffer 72 hours of full sensor data independently of the primary power supply, backed by an internal supercapacitor that maintains data integrity through brief power interruptions. If the gateway is damaged or requires replacement, the buffered data is recovered during the replacement process and synchronised to the platform before the replacement unit goes live — ensuring no gaps in the equipment health record. All sensor data is also stored redundantly in the FleetRabbit cloud platform with 7-year retention, so historical health records remain accessible regardless of hardware changes on the equipment itself.
FleetRabbit IoT Sensor Intelligence
Vibration. Temperature. Engine Hours. Fuel. Every Sensor. Every Asset. One Platform.
FleetRabbit integrates all four core IoT sensor categories into one construction fleet intelligence platform — edge-processed vibration analysis, multi-point thermal monitoring, precision hour-based PM triggers, and fuel anomaly detection. Replace reactive maintenance with sensor-driven prediction across your entire fleet.
Vibration Analysis
Thermal Monitoring
Hour-Based PM
Fuel Anomaly Detection
Edge Processing
May 22, 2026
By Lebron
All Posts