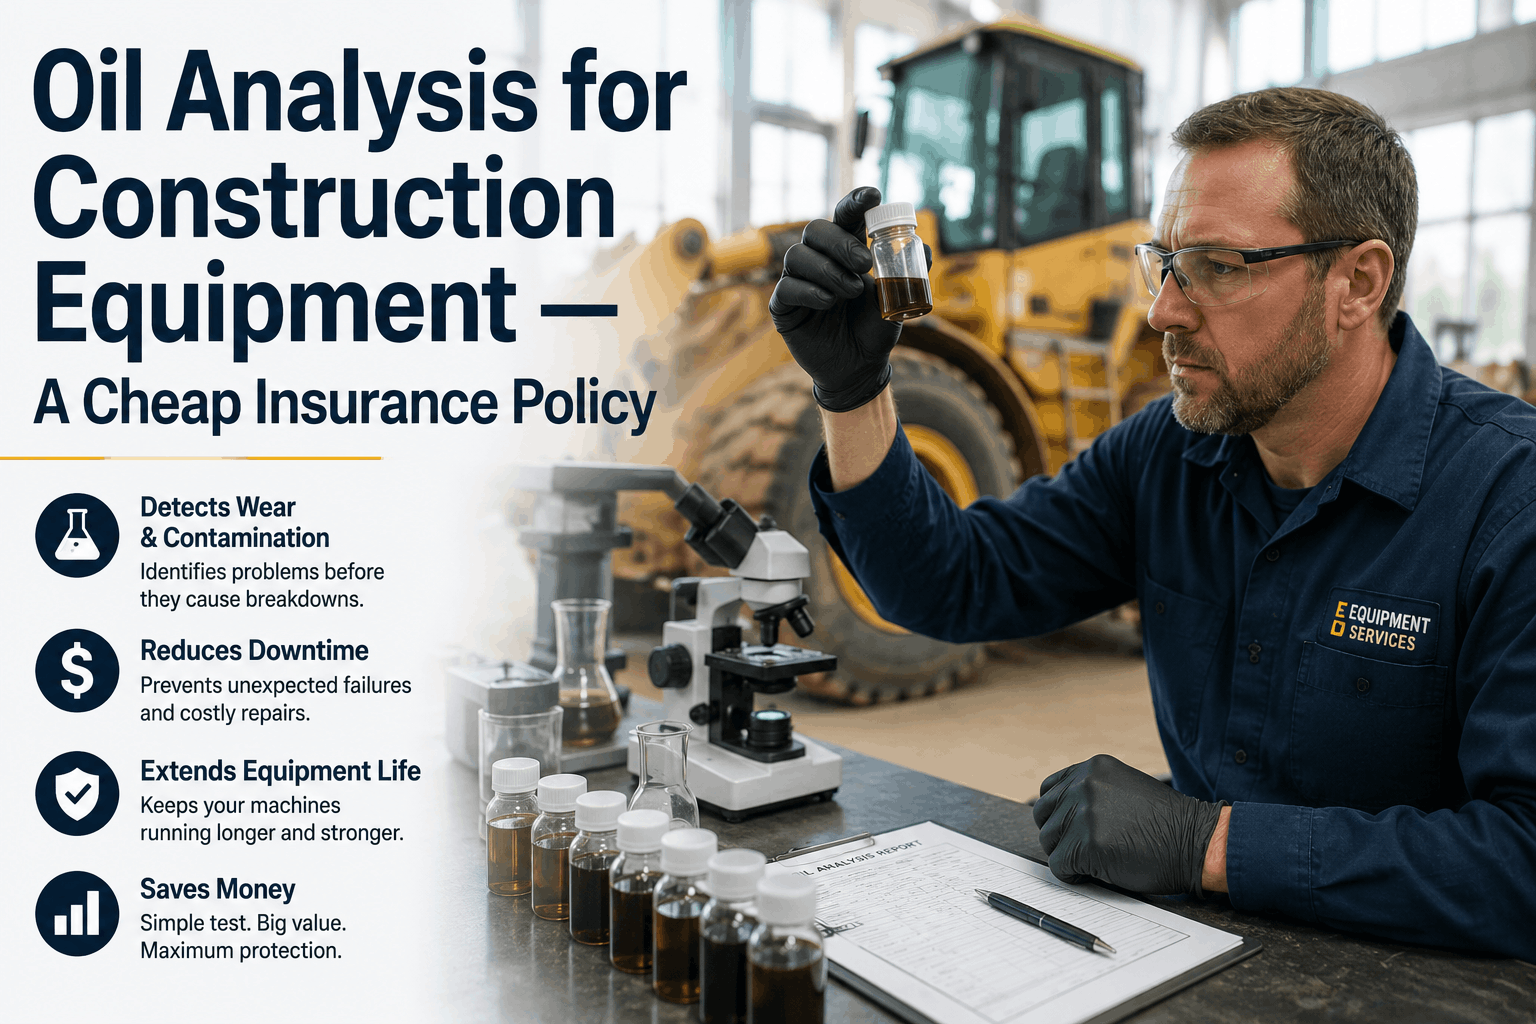
Oil analysis for construction equipment is one of the most cost-effective maintenance strategies available to Western US fleet operators — a $25–$40 lab test that can prevent a $20,000–$85,000 engine or hydraulic failure. For California grading contractors, Nevada mining fleets, and Arizona highway crews running excavators, loaders, and dozers through brutal seasonal cycles, fluid analysis turns invisible wear into actionable data. Book a demo to see how Fleet Rabbit integrates oil analysis alerts into your construction fleet telematics dashboard.
Quick Answer
Oil analysis costs $25–$40 per sample and detects wear metals, contamination, and fluid degradation weeks before catastrophic failure. A structured sample workflow covering engine oil, hydraulic fluid, and final drives gives Western US contractors complete machine health visibility for under $200 per unit per year. Fleet Rabbit automates sample scheduling, tracks results by machine ID, and fires alerts when wear thresholds are exceeded.
Why Oil Analysis Matters for Western US Construction Fleets
Equipment operating across California, Nevada, Arizona, and Oregon faces compounding wear: extreme heat cycling in Phoenix and Las Vegas summers, silica-laden dust from desert grading sites, and cold-start thermal shock on high-altitude Colorado and Oregon Cascades projects. Each condition accelerates wear that doesn't appear on inspection schedules — but does appear in fluid chemistry.
Engine Failure
$32K
avg excavator rebuild, undetected wear
Hydraulic Pump
$18K
avg loader pump, contamination-driven
Final Drive
$9K
avg dozer final drive, missed gear wear
Lab Test Cost
$35
cheapest insurance available
What Oil Analysis Measures — The Wear Metal Story
Wear Metals (ICP Spectroscopy)
Iron, copper, chromium, aluminum, and tin concentrations reveal which components are shedding material. Elevated iron in engine oil points to liner or ring wear. Copper spikes in hydraulic fluid indicate pump bushing deterioration. Each metal tells a specific failure story before damage compounds.
Contamination Markers
Sodium/potassium spikes flag coolant intrusion — critical early warning for head gasket failure on a Cat 336 running Phoenix summer grades. Silicon above 20 ppm indicates dust ingestion past air filtration, common on Nevada desert sites. Water above 0.2% triggers immediate hydraulic system inspection.
Fluid Condition (TAN/TBN)
Total Base Number depletion below 2.0 mg KOH/g means oil can no longer neutralize combustion acids. TBN depletes 30–40% faster than rated intervals on Arizona and Nevada summer operations — making compressed sampling schedules essential for any fleet running through Phoenix or Las Vegas heat.
The Sample Workflow — Intervals, Technique, and Action Thresholds
Oil Analysis ROI — Lab Cost vs. Failure Prevention Value
Western US construction fleet data 2024–2025. A single prevented engine failure pays for 900+ lab samples.
1
Establish Sampling Points and Intervals
Sample engine oil every 250–500 hours, hydraulic fluid every 500 hours, final drives and transmission fluid every 1,000 hours. For Phoenix and Las Vegas summer operations, compress engine intervals to 200 hours — heat cycling accelerates TBN depletion faster than calendar-based programs account for.
California highway contractor, 24 machines: Moved to 250-hour summer engine intervals after two liner failures. Detected a Cat C9 coolant intrusion at 180 hours — repaired for $3,200 vs. an estimated $38,000 head and liner job.
2
Correct Sampling Technique — Consistency Is Everything
Draw samples mid-drain from a live system — never cold or settled. Use vacuum pump extraction through the dipstick tube or a dedicated port. Label every bottle with machine ID, component, hours since last change, and total machine hours. Inconsistent sampling destroys trend data.
Live system onlyMachine ID requiredHours-based labeling
3
Reading Lab Reports and Setting Action Thresholds
Trend direction matters more than any single data point. Iron rising from 42 to 68 to 104 ppm across three intervals tells a clearer story than a one-time spike. Fleet Rabbit ingests lab data and plots wear trends by machine, component, and site — auto-creating work orders on Critical flags across your entire Western US fleet.
Nevada grading contractor: Fleet Rabbit flagged a Komatsu PC490 with 3-interval iron escalation. Inspection found a cracked oil ring. Repair cost: $4,800. Avoided rebuild estimate: $41,000.
Fleet Health Intelligence Platform
Automate Oil Analysis Tracking Across Your Western US Fleet — Free Trial, No Hardware Commitment
Fleet Rabbit ingests lab results, tracks wear trends by machine, and fires alerts before critical thresholds are crossed — OEM-agnostic, any brand, any lab partner.
Fluid-by-Fluid Guide — Engine, Hydraulic, Final Drives, Coolant
Engine Oil — Catch Liner, Ring, and Bearing Wear Early
Key wear metals: Iron (liners, rings), copper (bearings), aluminum (pistons).
Critical contamination: Sodium/potassium (coolant intrusion), silicon above 20 ppm (air filter failure), water above 0.1%.
Western US: Arizona and Nevada summer operations see TBN depletion 30–40% faster than rated intervals. Compressed 200-hour schedules are standard practice for Phoenix and Las Vegas fleets.
Hydraulic Fluid — Protect Pumps, Valves, and Cylinders
Primary metric: ISO cleanliness code — a system drifting from 18/16/13 to 21/19/16 generates catastrophic wear invisible to any inspection.
Key wear metals: Copper (pump bushings), iron (cylinder rods), aluminum (pump housings).
Western US: Desert dust makes hydraulic contamination the leading failure driver on California and Arizona grading fleets. Particle counting every 500 hours is non-negotiable.
Final Drive and Transmission — The Overlooked Interval
Key wear metals: Iron (gear faces), copper (thrust washers), lead (bronze bushings).
Final drives are sampled at 1,000-hour intervals — but failures are disproportionately expensive. A missed gear wear spike on a Deere 850L costs $9,000–$14,000. Oregon and Washington timber fleets should sample at 750 hours due to Pacific Northwest moisture accelerating water contamination.
Coolant Analysis — Head Gaskets, Liners, and Cavitation
What it finds: Wet-sleeve liner cavitation (molybdenum depletion), head gasket breach, inhibitor depletion, pH-driven aluminum corrosion.
Western US: Hard water in Nevada and Arizona accelerates inhibitor consumption. A $22 coolant test every 1,000 hours prevents the most common cause of mid-project engine failure on California infrastructure jobs — wet-sleeve cavitation invisible until a liner cracks on a live job site.
Without Fluid Trending
Failure detection: Visual inspection only
Detection lag: 500–1,000 hours
Hydraulic health: Unknown between changes
Coolant cavitation: Found at liner crack
Work order trigger: Manual interval only
Avg failure cost: $18,000–$41,000
With Fleet Rabbit + Oil Analysis
Failure detection: 3-interval trend algorithm
Detection lag: Under 250 hours
Hydraulic health: ISO code tracked per machine
Coolant cavitation: Flagged at molybdenum depletion
Work order trigger: Auto on Critical lab flag
Avg repair cost: $2,800–$5,200
900x
ROI on First Engine Save
200hr
Desert Fleet Interval
$41K
Largest Failure Avoided
Frequently Asked Questions: Oil Analysis for Construction Equipment
QHow often should I sample engine oil on excavators running in Phoenix or Las Vegas summers?
Every 200–250 hours during summer operations. Standard 500-hour intervals are calibrated for moderate climates — sustained temperatures above 105°F accelerate TBN depletion significantly faster than rated schedules. Arizona and Nevada operators running 500-hour intervals in summer are unprotected during the highest-stress months of their machine's year.
QCan Fleet Rabbit track oil analysis results alongside telematics data?
Yes. Fleet Rabbit ingests lab report data via API or CSV and ties results to each machine's telematics ID. Wear trends are plotted alongside engine hours, idle time, and fuel consumption. When a wear metal trend crosses a threshold, Fleet Rabbit automatically creates a work order and notifies the site supervisor.
QIs a single elevated wear metal result cause for immediate action?
Usually not — trend direction matters more than any single result. A one-time iron spike can result from a contaminated sample or normal variation. Three consecutive intervals showing escalating iron is a genuine wear pattern. Fleet Rabbit's trend algorithm flags directional deterioration rather than individual outliers, reducing false-positive work orders while catching real failure progressions.
QWhat does coolant analysis catch that visual inspection misses?
Wet-sleeve liner cavitation — the leading cause of unplanned engine failure on Western US construction fleets — is invisible until the liner cracks. Coolant analysis detects molybdenum depletion and early combustion gas intrusion 500–1,000 hours before any external symptom. On a prevailing wage California job, a mid-project engine failure costs $45,000–$80,000 in repairs and schedule penalties.
Related Fleet Rabbit Resources
AI-driven fault prediction and automated maintenance scheduling that prevents mid-project breakdowns across excavators, loaders, and cranes.
Real-time GPS, predictive health monitoring, dynamic route optimization, and delivery performance analytics — with ROI data for each capability.
Real-time utilization tracking, idle reduction analytics, and fleet right-sizing data for Western US contractors.
How GPS hardware, IoT sensors, and cloud analytics deliver real-time heavy equipment visibility and operational intelligence.
Turn Oil Analysis Into Fleet Intelligence — See Fleet Rabbit in Action
Fleet Rabbit's telematics platform ingests lab results, tracks wear trends by machine and component, auto-creates work orders on critical flags, and gives Western US construction fleets full fluid health visibility across every excavator, loader, dozer, and crane — any brand, any lab, any site.
OEM-AgnosticLab API IntegrationWear Trend AlertsAuto Work Orders45-Day ROI
May 30, 2026
By Harley Marley
All Posts