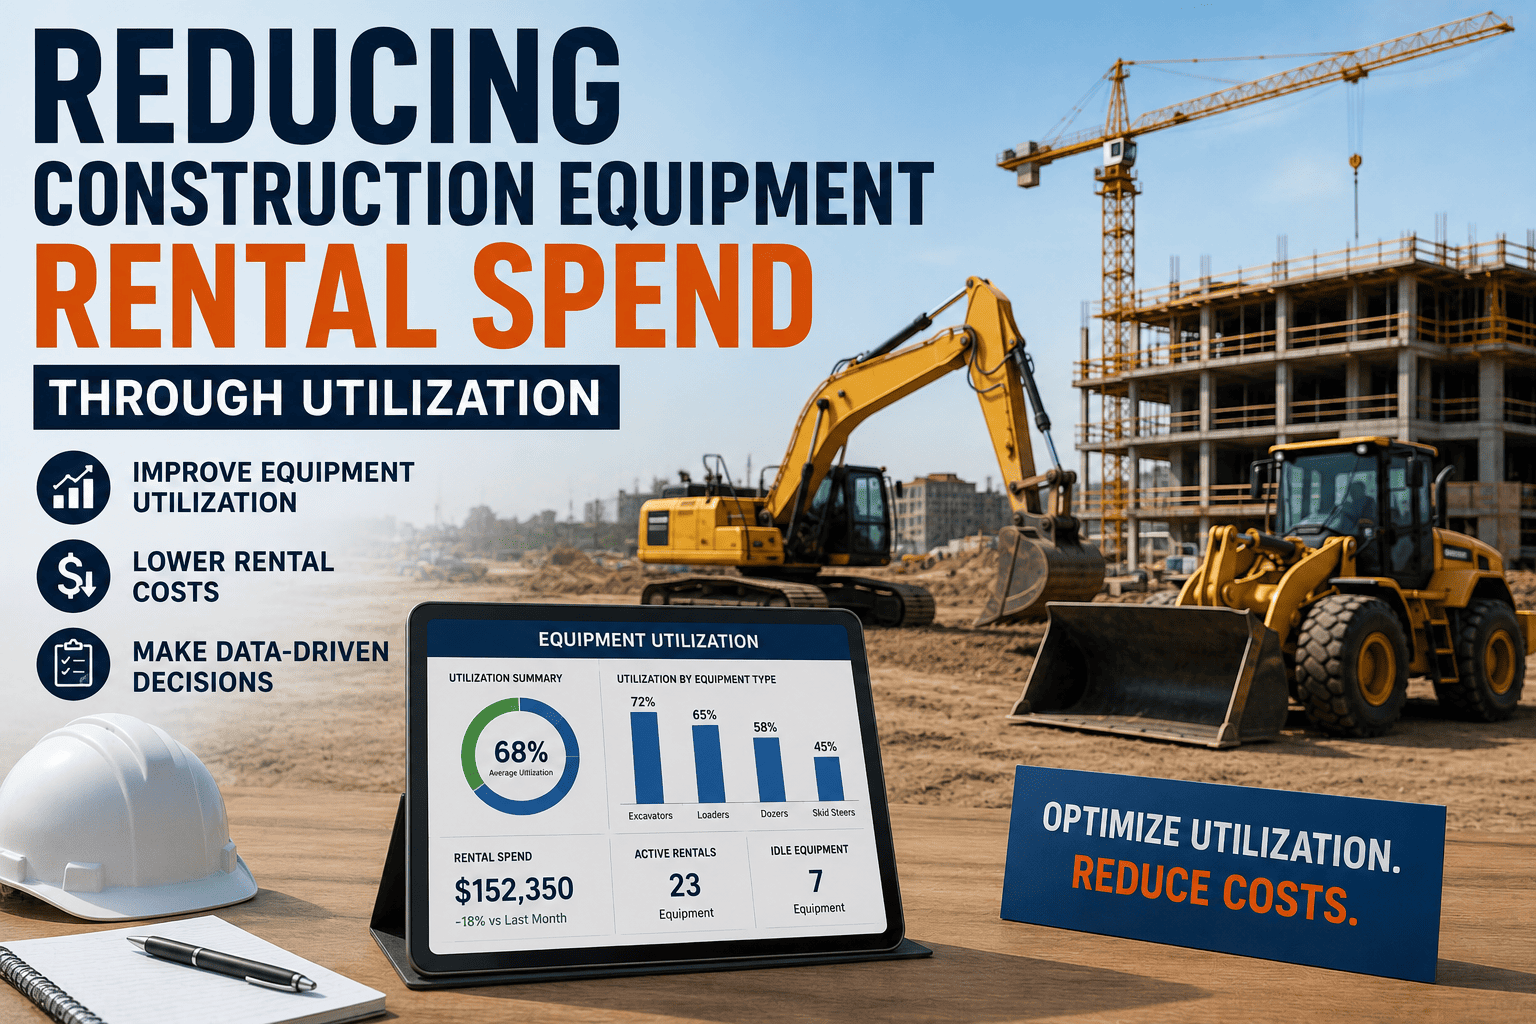
Somewhere on a job site right now, a piece of construction equipment identical to one your team just rented is sitting parked and idle. It happens on almost every multi-site operation, and it is the single most avoidable expense on a rental invoice. Reducing rental spend is not about renting more cautiously. It is about seeing your own fleet clearly enough that a rental request never gets approved by accident.
Reducing Construction Equipment Rental Spend With Utilization Data
Construction fleets average 55 to 70 percent utilization, well below the 70 to 85 percent healthy range. Up to 40 percent of owned equipment sits idle at any given moment, and each idle machine still costs 15000 to 40000 dollars a year in depreciation, insurance, and storage. Live utilization data catches those idle machines before a new rental gets approved, cutting avoidable rental spend within the first few months.
Understanding The True Cost Of Low Utilization
Rental spend rarely grows because a fleet genuinely needs more machines. It grows because nobody in the office can see what every piece of owned equipment is doing right now, across every site, at the same time. Manual usage logs make this worse: they depend on someone remembering to record hours accurately, and they typically undercount real usage by 15 to 30 percent compared with automated engine-hour and GPS tracking. That gap is exactly where unnecessary rental orders come from.
A mid-sized fleet running at 50 percent utilization instead of a 65 to 70 percent target can carry hundreds of thousands of dollars in avoidable annual costs across its idle assets alone. Add in the rentals ordered to cover work that idle equipment could have handled, and the total impact on the rental budget is significant and entirely preventable.
FleetRabbit connects engine hours and location data from every machine you own into one live utilization score, so a rental request gets checked against your own yard before it reaches a vendor. Sign up for FleetRabbit and connect your fleet in a day, or book a demo to see your own numbers first.
Where Rental Spend Actually Comes From
Breaking rental spend into its real components shows exactly where utilization data closes the gap.
| Cost Component | Typical Impact | Root Cause | How Utilization Data Helps |
|---|---|---|---|
| Duplicate Rentals | Full rental rate on equipment already owned | No shared visibility between site teams | Flags an idle, equivalent unit before a rental is approved |
| Idle Carrying Cost | 15000 to 40000 dollars per machine yearly | Equipment parked with no active project assignment | Live utilization score surfaces idle assets in days, not months |
| Over-Ordering As Buffer | Extra rentals kept on standby "just in case" | Uncertainty about what the fleet already has available | Fleet-wide inventory view replaces guesswork with real numbers |
| Manual Log Undercounting | 15 to 30 percent gap versus actual hours | Paper logs and spreadsheets depend on memory | Automated engine-hour and GPS tracking removes the guesswork |
| Reactive Scheduling | Rush rentals at premium short-notice rates | Equipment needs discovered late, without lead time | Demand patterns predict equipment needs before they become urgent |
Calculating Your Own Rental Waste
Finding the avoidable portion of your rental budget takes three steps.
Step One: List Every Owned Asset By Site
Pull a current list of owned equipment and the site it is assigned to. Most fleets discover assets they had forgotten were even active.
What to capture
Machine type, current site, and the date it last logged meaningful engine hours.
Step Two: Compare Utilization Against Recent Rentals
Cross-check every rental order from the past 90 days against your owned fleet list. Any rental for an asset class you already own, sitting idle elsewhere, counts as avoidable spend.
What to capture
Rental cost, duration, and whether an equivalent owned unit was idle at the time.
Step Three: Total The Gap
Add up the avoidable rental cost alongside the carrying cost of the idle units that could have covered it. That combined number is what live utilization tracking is built to eliminate going forward.
FleetRabbit flags an equivalent idle unit the moment a rental request is submitted, with the cost comparison built in. Decision-makers see rental cost against redeployment cost side by side, so approving a rental becomes a deliberate choice instead of a default. Start free with FleetRabbit or book a walkthrough of your fleet data.
How FleetRabbit Prevents Avoidable Rental Spend
FleetRabbit connects engine hours, GPS location, and status from every machine across every site into one live utilization score. Before a new rental request is approved, the platform checks for an equivalent unit sitting idle and surfaces it with a direct cost comparison. Connected fleets that track utilization this way typically run roughly 30 percent higher than fleets managed on memory and spreadsheets, closing the gap between the 55 to 70 percent industry average and the 70 to 85 percent healthy range.
Frequently Asked Questions
Every idle machine on your books is already costing you money in depreciation, insurance, and storage. Live utilization data turns that sunk cost back into usable capacity before the next rental order goes out. Start your free trial today, or book a demo and bring your fleet list.







