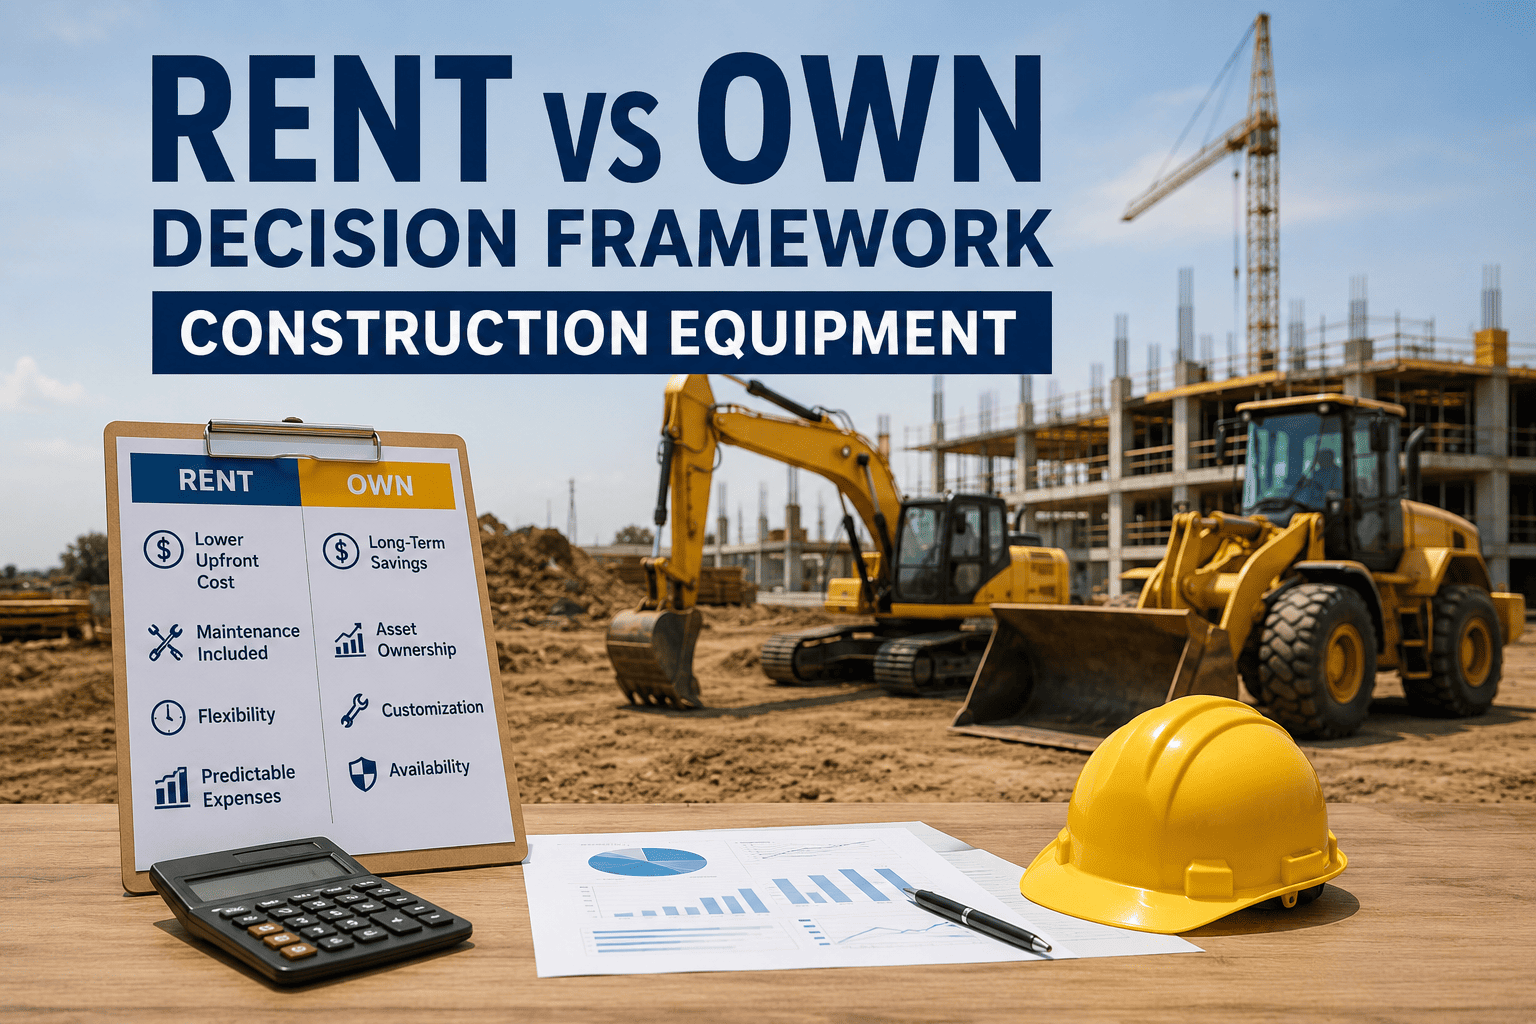
Every construction fleet manager has stood in a yard looking at a machine that hasn't moved in three weeks, wondering whether it was ever the right call to buy it. And every one of them has also paid a rental invoice for a machine they ended up needing for eight straight months, watching the math flip against them in real time. Rent or own isn't a philosophy. It's a number, and most fleets have simply never calculated it for each piece of equipment they run.
The widely recognized tipping point for equipment ownership is 60 to 65 percent utilization, roughly 150 working days a year. Below that threshold, renting is almost always the lower-cost path once depreciation, insurance, storage, and maintenance are factored in. Above it, ownership typically delivers the better return, and telematics-based usage data is what turns this from a guess into a per-machine decision.
The Utilization Threshold That Actually Decides This
The rent-or-own question comes down to one calculation most contractors have never actually run for their own equipment: time utilization, the percentage of available working days a machine is actually in use. It's a simple formula, hours or days used divided by hours or days available, but very few fleets track it consistently enough per machine to trust the answer.
How To Calculate Your Own Number
Take the hours a specific machine actually operated last year and divide that by the total hours it was available, typically around 2,000 hours for a full working year. A 20-ton excavator that ran 800 hours out of 2,000 available has a 40 percent utilization rate, well under the ownership threshold. A skid steer that ran 1,400 of those same 2,000 hours sits at 70 percent, solidly in owned-machine territory.
Why 65 Percent Is The Number Everyone Cites
The 65 percent mark represents the point where the total cost of ownership, depreciation, insurance, storage, and maintenance, is fully offset by the productivity that machine generates. Below it, those fixed costs accrue on a machine that isn't earning its keep. Above it, the per-hour cost of owning drops below what the same hours would cost to rent.
FleetRabbit tracks actual engine hours and usage days for every machine in your fleet, so the rent-or-own decision is based on real data instead of a gut feeling about which equipment "seems" busy.
Where Common Machine Types Typically Fall
Different equipment categories tend to cluster at different points on the utilization spectrum, which is why a blanket rent-or-own policy rarely works across an entire fleet.
| Equipment Type | Typical Utilization Pattern | Common Guidance |
|---|---|---|
| Skid Steers And Mini Excavators | Used weekly across most active projects | Own as core fleet once utilization clears 60 to 65 percent |
| Dump Trucks And Bucket Trucks | Run daily regardless of specific project mix | High-utilization assets, almost always better owned |
| Cranes And Specialty Lifts | Needed for specific phases, then idle for weeks | Rent for project-specific needs unless volume is consistently high |
| Boom Lifts And Light Towers | Used occasionally, often fewer than 30 days a year | Rent almost every time, ownership rarely pays off |
| Large Earthmoving Equipment | Tied to specific project pipelines and seasonal demand | Evaluate against your 12 to 18 month project backlog before buying |
Building Your Own Rent-Or-Own Framework
Turning the 65 percent rule into a real decision framework means applying it consistently across every asset type, not just running the calculation once and stopping there.
Separate Your Core Fleet From Your Flex Fleet
Core fleet equipment is the machinery your business runs on every single week, the assets that define what kind of work you can bid on. These should generally be owned once utilization clears the threshold, since they build equity your business can lean on. Flex fleet equipment covers the seasonal spikes, the specialized attachments, and the one-off contract requirements, and this is exactly where renting protects your capital instead of tying it up in a machine you'll use twice.
Weigh Your Project Pipeline, Not Just Last Year's Numbers
Utilization history tells you what happened. Your project pipeline tells you what's coming. A machine that ran at 45 percent utilization last year but has three confirmed projects lined up for the next 18 months might be worth owning now, ahead of the historical average catching up.
Factor In The Hidden Ownership Costs
Depreciation, insurance, storage, and maintenance typically add another 20 to 30 percent on top of a machine's purchase price every year. Those costs accrue whether the machine is working or sitting idle, which is exactly why utilization, not sticker price, is the number that actually decides this.
Signing up for FleetRabbit gives you utilization data for every machine automatically, so building this framework takes days instead of a spreadsheet project that never quite gets finished.
FleetRabbit calculates real utilization rates across your entire fleet, flags which machines have crossed the ownership threshold, and helps you decide where rental protects your capital instead.
Metrics Worth Tracking Before Your Next Purchase
A short list of numbers, tracked consistently per machine, is what separates a confident rent-or-own decision from an educated guess.
Time Utilization By Asset
Track actual hours or days used against total available hours for every individual machine, not just an average across the whole fleet. Averages hide the specific machines quietly underperforming or overperforming their category.
Cost Per Hour, Owned Versus Rented
Compare the fully loaded cost per operating hour of owning a specific machine, including depreciation and maintenance, against the rental rate for the same equipment class. This is the number that actually tells you which option is cheaper for the hours you're realistically going to use.
Project Pipeline Confidence
Rate your confidence in the next 12 to 18 months of project backlog for the type of work that machine supports. A high utilization number paired with an uncertain pipeline still deserves a second look before committing capital.
Booking a demo walks through exactly how these numbers look for your specific fleet, using your own usage history instead of industry averages.
Key Takeaways
Rent or own was never really a philosophy question. It's a utilization question, and the 60 to 65 percent threshold gives every fleet manager a concrete number to test each piece of equipment against instead of relying on instinct or tradition. Machines running above that line almost always make more financial sense owned. Machines sitting idle most of the year almost always cost less rented, once the hidden 20 to 30 percent in annual ownership costs is factored in honestly.
The fleets making confident decisions in 2026 aren't the ones with the biggest yards. They're the ones tracking real utilization data per machine and matching their fleet composition to their actual project pipeline, not the equipment list they've always had. That shift alone turns a recurring capital guessing game into a repeatable, data-backed framework.
FleetRabbit tracks real utilization across every machine in your fleet, so your next rent-or-own decision is backed by data instead of a guess. Start free and see your own fleet's numbers today.







