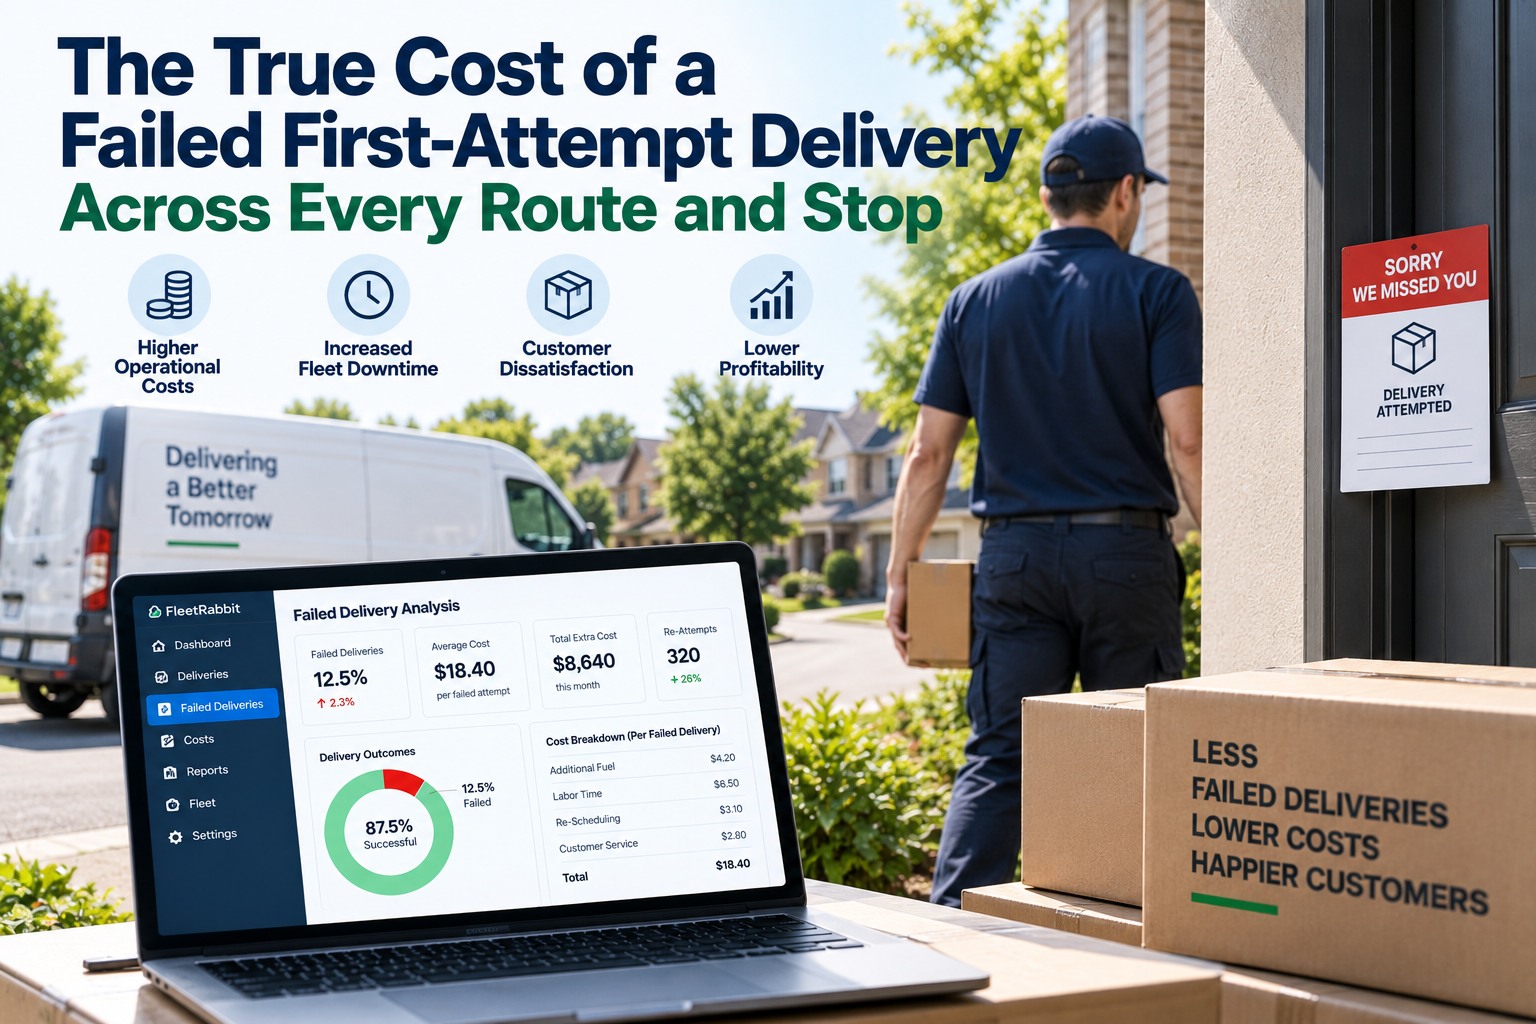
The true cost of a failed first-attempt delivery, across every route and stop
Cost per delivery calculations almost always stop at fuel and driver hours. The real number includes what happens next — the second attempt, the call to support, and the order that never gets placed again. Once you add those up, the cost of failed delivery is usually several times higher than the redelivery fee alone.
If you're still estimating this cost by hand, you can sign up and pull the real number from your own delivery data instead of guessing at it.
It's never just one redelivery
A failed first attempt sets off a short chain of costs, and most of them land on a different budget line than the one operators watch. Here's where each one actually shows up.
See your real cost per stop, not an estimate
FleetRabbit tracks failed-attempt cost against every route so you know exactly where it's coming from.
The cost most operators miss: what happens to the rest of the route
A failed stop doesn't just cost money on its own — it costs time on every stop that comes after it. A driver who waits five extra minutes at a locked gate pushes every remaining delivery window back by five minutes too.
This is why last-mile downtime cost is bigger than the failed stop itself. Every minute lost to one address gets borrowed from the delivery windows of the stops still ahead on the route, which is how one miss quietly turns into two or three.
A simple way to see your own number
You don't need a complex model to get a working estimate of your delivery fleet ROI on this. A rough version looks like this:
Run that against a route with a 6–8% first-attempt failure rate and the monthly number is usually large enough to justify fixing the underlying cause — better delivery-window accuracy, live driver-customer contact before arrival, or faster re-routing when a stop is at risk. Teams that book a demo usually plug their own volume into this exact formula in the first ten minutes.
Successful stop vs. failed stop, side by side
Successful first attempt
- One trip, one delivery window used
- No support contact required
- Route stays on schedule for later stops
- Customer receives the order as promised
Failed first attempt
- A second trip, a second delivery window
- A support contact to rebook or explain
- Every later stop on the route absorbs the delay
- Customer decides whether to reorder at all
The fix starts with visibility, not more redeliveries
Most failed-delivery costs come from the same handful of causes — a delivery window the customer never confirmed, no contact before arrival, or a route that had no room to absorb a delay. None of those need a bigger fleet to fix; they need dispatch software that flags a stop as at-risk before the driver ever reaches the door.
If you want to see where your own cost per delivery is actually going, sign up and connect a route, or book a demo and walk through your failed-attempt numbers with our team.
Turn failed-attempt cost into a number you control
Start free and see your own cost per stop, or talk it through with our team first.
Common questions
What actually counts toward the cost of failed delivery
The redelivery trip is the most visible part, but the full number includes driver downtime, any support contact needed to rebook, refunds or credits issued, and the value of orders a frustrated customer doesn't place again.
How is cost per stop different from cost per delivery
Cost per delivery usually looks at the whole route divided evenly. Cost per stop looks at what one specific address actually costs to serve, which is what shows the real gap between a stop that succeeds on the first try and one that doesn't.
Why does one failed stop affect stops later on the route
A driver who loses time at a failed attempt carries that delay into every stop still ahead of them. That's the last-mile downtime cost operators tend to underestimate — it isn't contained to the address where it happened.
What's a reasonable first-attempt failure rate to expect
It varies by delivery type and address density, but most operators find real savings once they start tracking it by route and cause instead of treating every miss as a one-off.
Can this be reduced without adding more vehicles
In most cases, yes. Confirming delivery windows earlier, contacting the customer before arrival, and re-routing a stop the moment it looks at risk usually removes more failed attempts than adding capacity does.
How do I calculate delivery fleet ROI on fixing this
Multiply your average cost per failed attempt by how many happen weekly, then compare that monthly total against what better dispatch visibility would cost to run — for most fleets, the failed-delivery number is the larger one.







