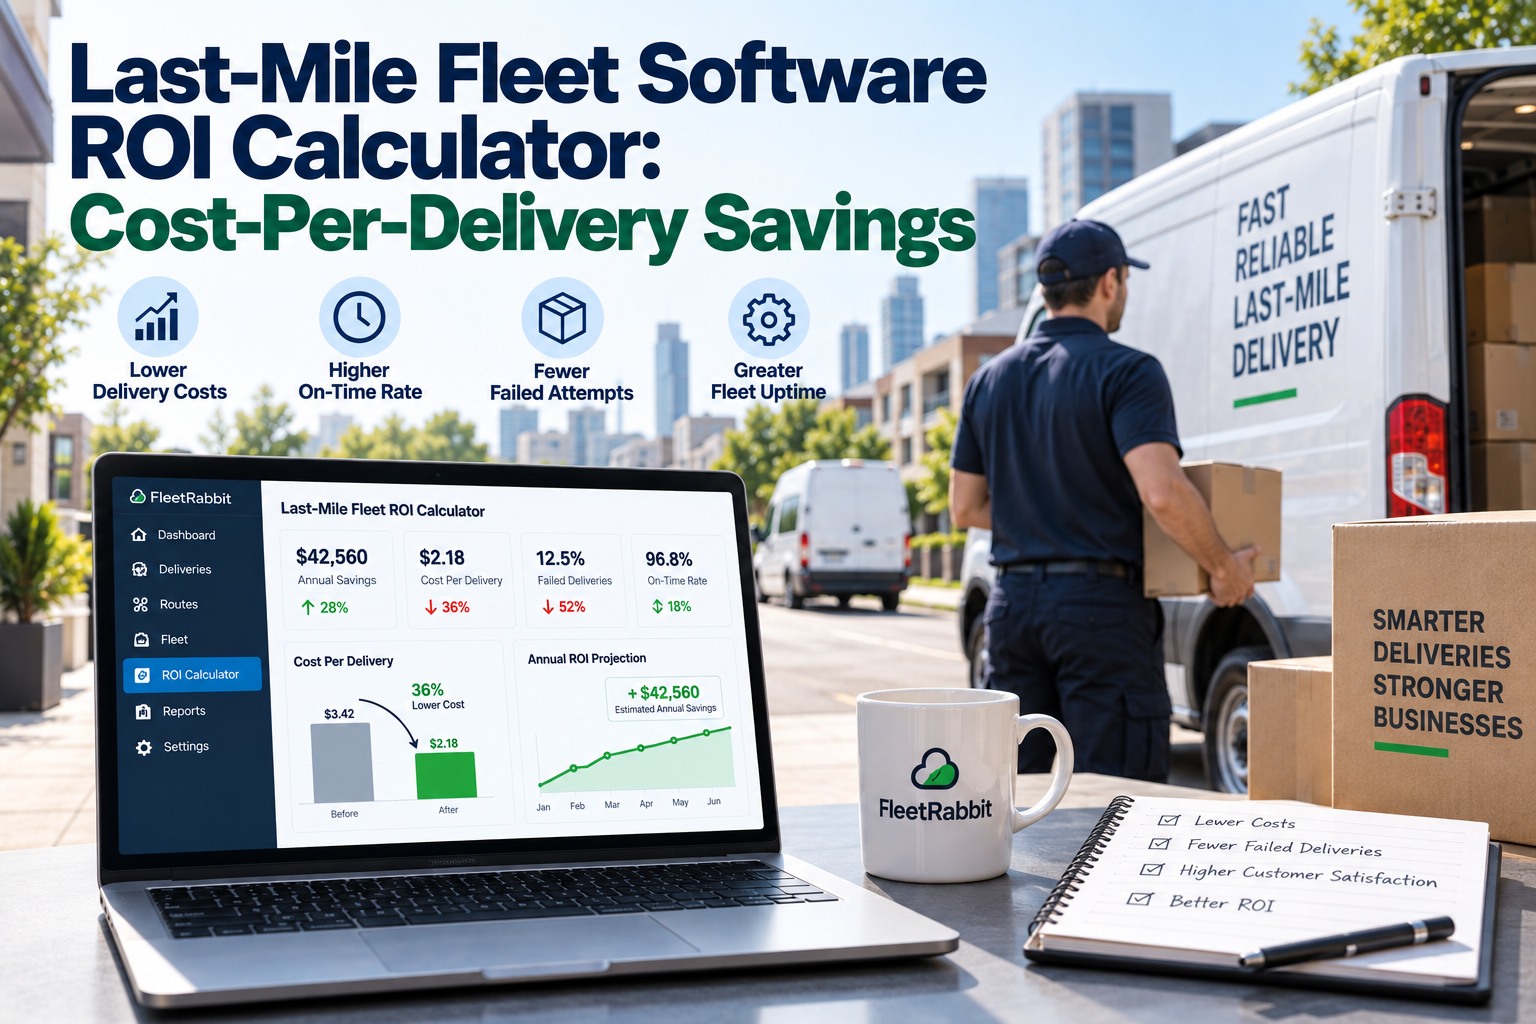
Last-mile fleet software ROI, calculated from your own numbers
Cost-per-delivery savings don't come from a single feature — they come from three things moving together: more first-attempt successes, less driver downtime, and fewer support contacts per route. Adjust the numbers below to see roughly what that's worth on your fleet.
This is a directional estimate to size the opportunity — sign up to run the real figure against your own route history.
What actually drives the ROI number
Fleet software ROI rarely comes from one dramatic change. It's usually four smaller gains landing on the same routes at the same time — the kind of gains that are easiest to see once you sign up and watch them show up on your own dispatch board.
Accurate delivery-window matching means fewer stops arrive outside the promised time, which is where most failed attempts start.
Every avoided redelivery removes a second trip, a support contact, and the risk of losing that customer's next order.
Less time lost to manual re-routing and driver idle time means more of the day is spent actually delivering.
Automated sequencing removes the daily manual reshuffling that eats into a planner's morning on every route.
Run this against your real route data
The calculator above is a starting estimate. Connect your fleet and FleetRabbit shows the actual number.
From cost per delivery to cost per successful delivery
Most fleets track cost per delivery as one blended average across the whole route. That number hides the real gap, because a stop that succeeds on the first try and a stop that fails twice don't cost anywhere near the same amount.
Tracking the second number is what makes last-mile fleet software ROI visible month over month, instead of guessed at once a year. Teams that book a demo usually start by looking at this exact split on their busiest routes.
How small gains compound over a year
A few points of improvement in on-time rate don't look dramatic in month one. Held over twelve months, across every route and stop, they add up faster than most operators expect — enough that it's worth a quick book a demo call to see the pace on your own volume.
Cumulative savings, illustrative — actual pace depends on delivery volume and current failure rate.
The number is worth building once
A last-mile fleet software ROI calculator is only useful if the inputs are yours. Delivery volume, failure rate, and cost per attempt vary enough between fleets that a generic industry average won't tell you much about your own routes.
Build the real version with your own data — sign up and connect a route, or book a demo and we'll walk through the math with you directly.
See your cost-per-delivery savings, not an estimate
Start free and connect your fleet, or talk through your numbers with our team first.
Common questions
What inputs matter most for a last-mile fleet software ROI estimate
Delivery volume, first-attempt failure rate, and the average cost of a failed attempt drive most of the number. On-time rate improvement is what moves those three inputs in the right direction.
How is cost-per-delivery savings different from just cutting fuel costs
Fuel is one line item. Cost-per-delivery savings usually come more from avoided redeliveries, reduced support contacts, and dispatcher time saved — costs that don't show up on a fuel report but hit the same budget.
Does this calculation apply to small fleets too
Yes. The formula scales down the same way it scales up — even a handful of vehicles running a meaningful failure rate adds up to a real monthly number.
How quickly does last-mile uptime typically improve
Most of the gain shows up in the first month or two as delivery-window accuracy and re-routing improve, then continues to compound as failed-attempt rates stay lower.
What counts toward last-mile downtime cost
Time lost to manual re-sequencing, driver idle time at failed stops, and delays that ripple into later deliveries on the same route all count toward it.
Is the calculator on this page an exact quote
No — it's a directional estimate meant to size the opportunity. The accurate figure comes from running your own route and order history through FleetRabbit.







