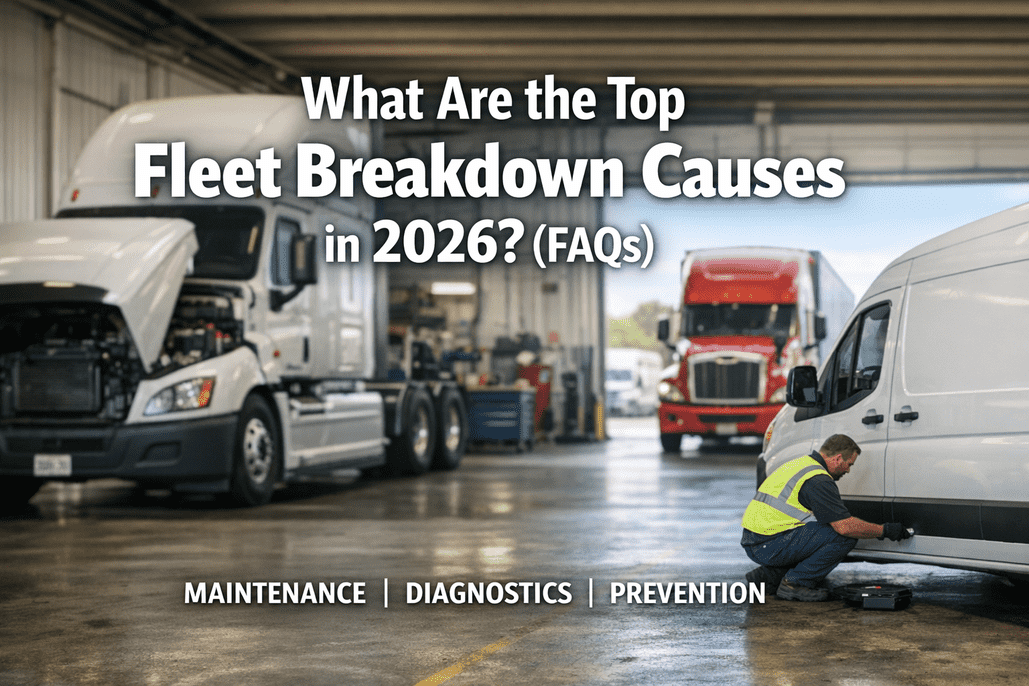
Fleet breakdowns in 2026 cost more than ever—with operating costs at $2.25 per mile and tight margins, a single roadside failure can drain thousands from your bottom line. The Technology & Maintenance Council reports that tires cause 53.5% of roadside breakdowns, brakes cause 29% of truck accidents, and electrical failures strand trucks without warning. These aren't random events—they're predictable patterns that AI and telematics now catch weeks before drivers notice anything wrong. Sign up for FleetRabbit to start preventing breakdowns before they happen.
Stop Paying the Breakdown Tax
Fleets using predictive diagnostics reduce breakdowns by 75% and cut unplanned downtime by 50%. Join thousands of fleets preventing failures before they strand trucks.
Frequently Asked Questions
What are the top causes of fleet breakdowns in 2026?
Fleet breakdowns follow predictable patterns that data-driven maintenance can prevent. Understanding these failure categories helps prioritize your maintenance investments. Sign up for FleetRabbit to track and prevent these failure types:
Top Fleet Breakdown Causes by Frequency
Tire Failures
53.5%Blowouts, underinflation, uneven wear, road hazards
Brake System Issues
29%Air leaks, worn pads, contaminated fluid, valve failures
Electrical System Failures
12%Dead batteries, alternator issues, wiring corrosion
Engine & Cooling Problems
8%Overheating, coolant leaks, thermostat failures
Fuel System Issues
5%Clogged filters, contaminated fuel, injector problems
Why are tire failures the leading cause of fleet breakdowns?
Tires are the only contact between 80,000 pounds of truck and the road surface. The FMCSA reports approximately 8,000 tire-related trucking accidents annually—but the larger impact is operational: thousands of roadside stops, delayed deliveries, and spoiled cargo:
Primary Tire Failure Causes:
- Underinflation generates excessive heat, weakens sidewalls, and accounts for most blowouts
- Overloading exceeding load ratings accelerates wear and increases blowout risk exponentially
- Uneven Wear misalignment, imbalanced loads, and skipped rotations create weak spots
- Age and UV Damage sidewall cracking and dry rot progress invisibly until failure
- Road Hazards debris, potholes, and curb strikes cause immediate or delayed damage
Prevention Strategy: Tire Pressure Monitoring Systems (TPMS)
TPMS provides 24/7 visibility into tire health, alerting drivers and fleet managers to deviations before they become blowouts. Fleets using automated tire monitoring report:
- 30-50% reduction in tire-related roadside events
- 15-25% longer tire life through proper inflation maintenance
- 3-5% fuel savings from optimized rolling resistance
- Real-time alerts when pressure drops below safe thresholds
How much does a fleet breakdown actually cost?
The true cost of a breakdown extends far beyond the repair bill. When you calculate lost revenue, emergency service premiums, and customer impact, the financial drain becomes significant. Book a demo to calculate your potential savings:
True Cost of a Single Breakdown
Annual Breakdown Tax by Frequency
| Breakdowns Per Year | Severity Mix | Annual Cost Per Truck | 10-Truck Fleet Cost |
|---|---|---|---|
| 1-2 (Low) | Minor issues | $1,700-3,400 | $17,000-34,000 |
| 3-4 (Average) | Mixed severity | $5,100-12,400 | $51,000-124,000 |
| 5-6 (High) | Including major failures | $8,500-18,600 | $85,000-186,000 |
| 7+ (Critical) | Severe maintenance gaps | $12,000-25,000+ | $120,000-250,000+ |
What makes 2026 different for fleet breakdowns?
Three forces are reshaping what fails and how quickly you can catch problems in 2026:
Aging Fleet Reality
Class 8 orders dropped 44% year-over-year in late 2025. With new truck prices elevated and freight rates depressed, fleets are running vehicles longer—meaning more components reaching end-of-life simultaneously.
Telematics Revolution
Over 90% of vehicles manufactured in 2026 ship with embedded telematics. AI-powered diagnostics now detect subtle patterns weeks before human senses notice anything wrong.
Margin Pressure
With operating costs at $2.25 per mile and for-hire margins at -2.3%, a single breakdown now hurts more than ever. Every preventable failure directly impacts profitability.
What are the warning signs of an impending breakdown?
Modern trucks communicate problems before they become failures—if you know what to look for. Early intervention on these warning signs prevents the majority of roadside emergencies. Sign up to automate warning sign detection:
Critical Warning Signs to Never Ignore:
- Unusual Noises squealing brakes, grinding when shifting, or new sounds from wheel wells signal developing problems
- Burning Smells oil, antifreeze, or brake odors indicate leaks or overheating components
- Dashboard Warning Lights any new light needs immediate attention—they exist for a reason
- Delayed Acceleration sluggish response or hesitation indicates engine or fuel system issues
- Poor Fuel Economy sudden MPG drops often signal developing maintenance problems
- Difficulty Starting struggling to start indicates battery, alternator, or fuel delivery issues
- Uneven Tire Wear visible tread patterns signal alignment or pressure problems
- Vibrations new vibrations in steering or drivetrain indicate wear or balance issues
How AI Detects Problems Human Senses Miss:
- Temperature drift patterns subtle 2-3°F increases over time that predict cooling system failures
- Vibration signatures micro-vibrations that indicate bearing wear weeks before audible noise
- Voltage anomalies battery degradation curves that predict cold-start failures
- Pressure trends gradual tire pressure loss patterns that signal slow leaks or valve issues
- Brake wear correlation usage patterns that predict pad replacement timing accurately
How does predictive maintenance prevent breakdowns?
The difference between 2020 and 2026 fleet maintenance isn't just better sensors—it's artificial intelligence that learns, predicts, and acts. Predictive maintenance reduces unplanned breakdowns by 65-75% and cuts maintenance costs by 25-40%. Schedule a demo to see predictive maintenance in action:
How Predictive Maintenance Works
Continuous Monitoring
Telematics and OEM sensors monitor hundreds of parameters: engine temperature, oil pressure, battery voltage, tire pressure, brake wear, and vibration patterns.
Pattern Analysis
AI algorithms compare real-time data against normal operating baselines, identifying subtle deviations that indicate developing problems.
Failure Prediction
Machine learning models predict which component will fail, when it will fail, and confidence level—often 2-4 weeks in advance.
Scheduled Intervention
Maintenance is scheduled during planned downtime, parts are ordered at standard pricing, and repairs happen before failures occur.
Predictive Maintenance ROI Statistics:
Reduce Breakdowns by 75% with Predictive Maintenance
FleetRabbit's AI-powered diagnostics catch tire, electrical, brake, and engine problems before they strand your trucks. See how predictive maintenance transforms your operation.
What brake issues cause the most breakdowns?
The FMCSA identifies brakes as the most impactful element in truck crashes, with an estimated 29-30% of truck accidents caused by brake failure. Brake system failures immediately render vehicles unsafe and can require extensive downtime:
Common Brake Failure Causes:
- Air Leaks compromised air lines or fittings reduce braking pressure and stopping power
- Worn Pads/Shoes metal-on-metal contact damages rotors and drums, escalating repair costs
- Water Contamination moisture in air lines can freeze in cold weather, causing complete brake failure
- Slack Adjuster Problems improper adjustment reduces braking effectiveness
- Overheated Components excessive heat from constant use causes warping and reduced performance
- Brake Chamber Rupture failed chambers eliminate braking on affected wheels
Regular brake inspections aren't just about uptime—they're about safety. CVSA roadside inspections consistently list brake systems as the top source of out-of-service violations.
Brake Maintenance Best Practices:
- Drain air tanks daily removes moisture that can freeze or cause corrosion
- Inspect pads and drums at every PM interval for wear patterns
- Check slack adjusters ensure proper stroke length on all brakes
- Test air compressors verify build-up times and governor cut-in/cut-out pressures
- Monitor brake temperatures identify overheating patterns that indicate problems
How do electrical system failures cause breakdowns?
Modern trucks are rolling networks of sensors, wires, and computers. An electrical fault can be maddening to trace and often strands trucks without warning:
Electrical System Failure Points:
- Dead Batteries most common electrical failure; batteries typically last 3-5 years but cold weather accelerates wear
- Alternator Failure inadequate charging leads to gradual battery drain and eventual no-start conditions
- Starter Motor Issues worn starters may work intermittently before complete failure
- Wiring Corrosion corroded terminals and connections cause intermittent power loss
- Frayed Wires can cause shorts that drain batteries or affect critical systems
Electrical System Prevention Checklist
What role do inspections play in preventing breakdowns?
Studies indicate that over 30% of logistics fleet breakdowns could have been prevented through proper inspection programs. Regular inspections catch small problems before they become roadside emergencies. Sign up to digitize your inspection program:
Inspection Approaches Compared
Reactive Inspections
- Inspect when problems appear
- Paper-based documentation
- No trend analysis
- Issues discovered too late
Scheduled Inspections
- Fixed interval inspections
- Standardized checklists
- Basic documentation
- Some issues caught early
Data-Driven Inspections
- AI-prioritized focus areas
- Digital documentation
- Trend analysis and alerts
- Proactive issue detection
How do I calculate my fleet's breakdown risk?
Understanding your current breakdown patterns helps quantify the value of prevention investments:
Breakdown Risk Assessment Framework
| Risk Factor | Low Risk | Medium Risk | High Risk |
|---|---|---|---|
| Average Fleet Age | Under 3 years | 3-7 years | Over 7 years |
| Annual Miles Per Truck | Under 80,000 | 80,000-120,000 | Over 120,000 |
| PM Compliance Rate | Over 95% | 80-95% | Under 80% |
| Inspection Documentation | Digital, complete | Paper, mostly complete | Inconsistent/missing |
| Telematics Coverage | 100% monitored | Partial coverage | None or basic GPS only |
Industry Breakdown Benchmarks:
- Industry average approximately 1 breakdown every 100,000 miles
- Well-maintained fleets report 1 major breakdown every 300,000-400,000 miles
- 44% of fleets anticipate downtimes of 6+ hours per breakdown event
- 16% of fleets face disruptions exceeding 24 hours from breakdown events
- Older fleets cost per mile increases 35% for vehicles over 10 years old
What's the fastest way to reduce fleet breakdowns?
Implementing a breakdown prevention program doesn't require transforming everything at once. Start with high-impact, low-cost interventions:
90-Day Breakdown Reduction Roadmap
Week 1-2: Foundation
- Audit current breakdown frequency and causes
- Activate OEM telematics on equipped vehicles
- Implement digital pre-trip inspections
- Establish tire pressure monitoring baseline
Week 3-6: Quick Wins
- Address top 5 recurring failure types
- Install TPMS on high-risk vehicles
- Improve brake inspection frequency
- Implement battery testing program
Week 7-12: Scale
- Deploy predictive analytics platform
- Automate maintenance scheduling
- Train technicians on diagnostic tools
- Measure and refine based on results
Start Preventing Breakdowns Today
Every breakdown your fleet experiences in 2026 is a breakdown that could have been prevented. The technology exists, the data is available, and the patterns are predictable. Start your prevention program now.