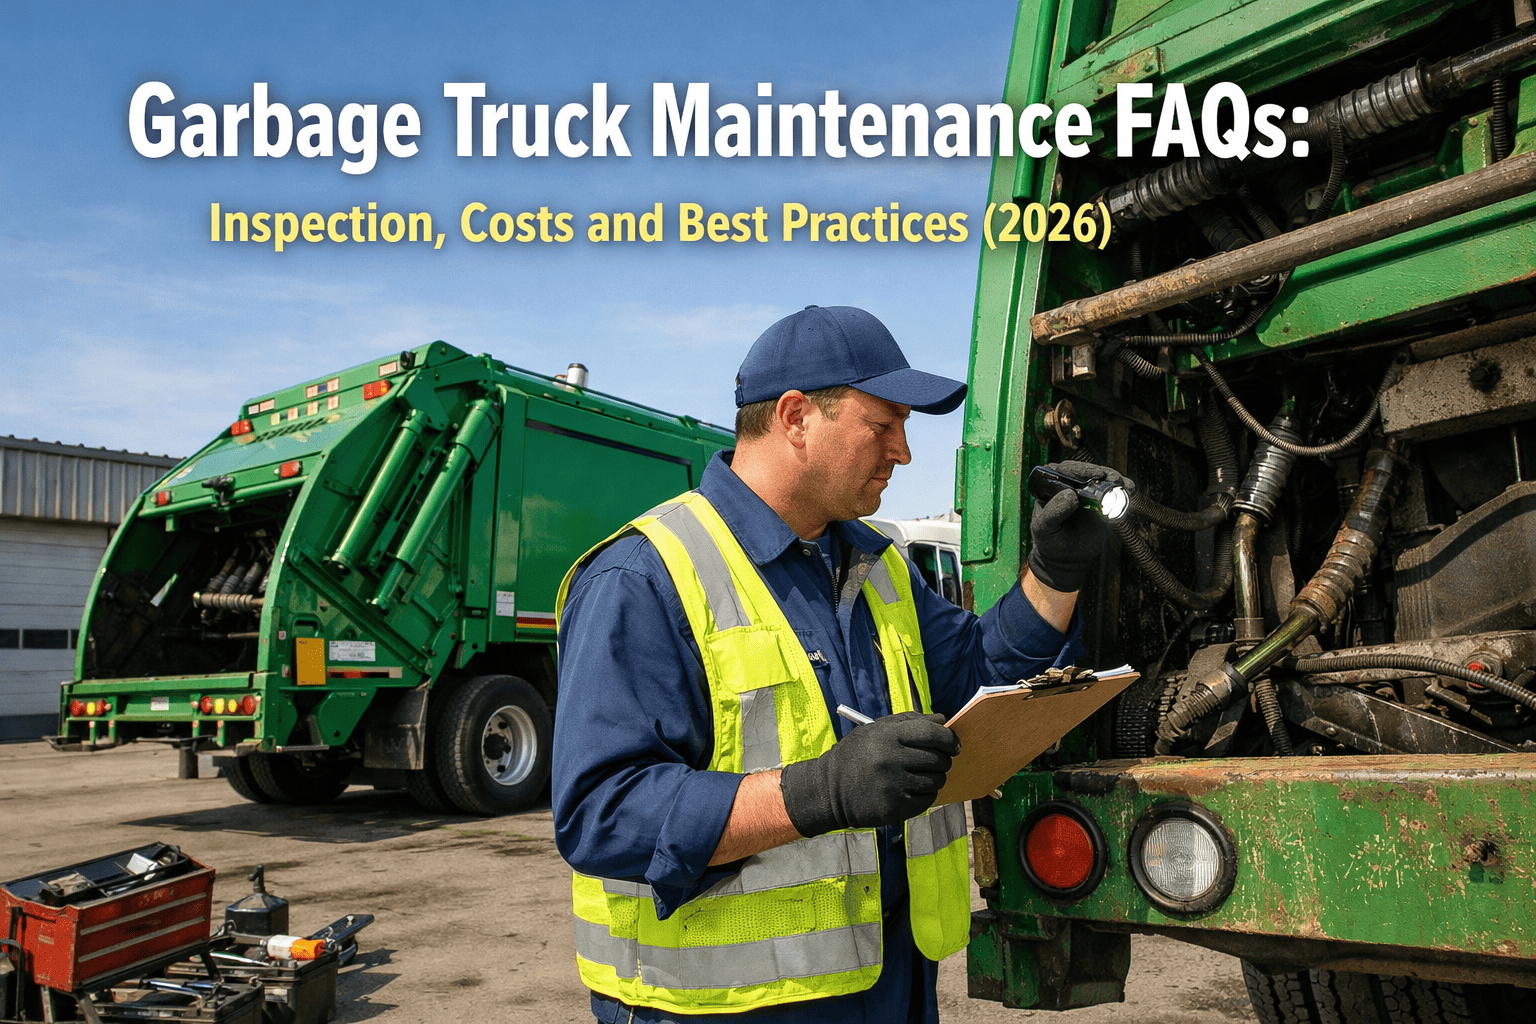
Garbage trucks are among the hardest-working vehicles on American roads — stopping every 30-60 seconds, cycling hydraulic compactors thousands of times per shift, and hauling payloads that stress every component from axles to engine mounts. A single refuse truck racks up wear equivalent to 3–5 times that of a standard commercial truck doing the same mileage. Yet most waste fleet operators still rely on paper checklists, calendar-based service intervals, and reactive repair habits that cost far more than they should. This guide answers the most pressing maintenance questions from US waste fleet managers — from inspection checklists to real repair costs to the software practices that keep trucks on the road instead of in the shop. Sign up for FleetRabbit to digitize your maintenance and inspection workflows today.
Purpose-Built for Refuse Fleet Maintenance
FleetRabbit includes specialized DVIR checklists for rear loaders, front loaders, side loaders, roll-off trucks, and street sweepers — covering hydraulics, compactors and lift mechanisms right out of the box.
Frequently Asked Questions
What should be on a garbage truck maintenance checklist?
A garbage truck maintenance checklist must go far beyond standard commercial vehicle items. The hydraulic system, compactor body, and lift mechanisms are the highest-failure components on any refuse truck — and they are the ones most often missing from generic fleet checklists. A complete refuse truck maintenance checklist covers pre-trip inspection items, weekly service checks, and scheduled PM intervals.
Three-Level Maintenance Checklist Structure
Daily Pre-Trip (DVIR)
Hydraulic fluid level and visible leaks, compactor blade and packer panel operation, lift arm cylinder integrity and tipper arm grip pads, body corrosion and tailgate latch, safety interlocks and backup alarm, brake function and tire pressure, lights and mirrors, cab cleanliness and seatbelt condition.
Weekly Service Checks
Hydraulic hose condition (look for abrasion, kinking, weeping fittings), grease all pivot points on lift arms and compactor linkages, inspect compactor blade edge wear, check hydraulic fluid for contamination or milky appearance (water intrusion), torque check on critical fasteners, engine oil and coolant level top-off.
Scheduled PM Intervals
Oil changes every 15,000–25,000 miles (or by engine hours — refuse trucks accumulate hours far faster than miles), hydraulic fluid flush every 1,000–1,500 operating hours, brake inspection every 25,000 miles, compactor cylinder rebuild every 2–3 years depending on cycles, DPF cleaning every 150,000–200,000 miles, full frame inspection annually.
Refuse-Specific Items Generic Checklists Miss:
- Packer panel alignment — misaligned panels create uneven wear that destroys cylinders prematurely
- Tipper arm grip pads — worn pads drop containers, creating liability and service failures
- Body-to-chassis mounting bolts — extreme load cycling loosens these faster than any other vehicle type
- Tailgate cam lock mechanisms — failure mid-route causes load spillage and road hazard incidents
- Compactor safety interlock — prevents activation when someone is near the hopper; critical life-safety item
- DEF level and dosing system — a derating engine due to empty DEF takes a truck off the road mid-route
FleetRabbit's digital DVIR platform provides vehicle-type-specific checklists — rear loaders, front loaders, side loaders, roll-off trucks, and street sweepers each have tailored item lists. Drivers complete them in under 5 minutes on their phones with photo documentation, creating timestamped records that satisfy DOT 49 CFR 396.11 requirements automatically. Start using digital checklists for your fleet →
How much does garbage truck maintenance cost per year?
Garbage truck annual maintenance costs vary widely by fleet age, duty cycle, and management quality — but the numbers are substantially higher than most operators budget for. Refuse trucks operate under conditions that accelerate wear across every system simultaneously. Understanding where costs concentrate helps fleet managers direct spending toward highest-impact preventive measures.
Annual Maintenance Cost Breakdown — Per Truck
Well-maintained fleets with predictive software average $28,000/truck/year. Reactive fleets without maintenance tracking average $48,000–$60,000.
Cost Drivers by System
Hydraulic System — Highest Cost Category
Hydraulic pumps, cylinders, hoses, and valves account for 30–40% of total refuse truck maintenance spend. A compactor cylinder rebuild runs $3,000–$6,000. A hydraulic pump replacement costs $2,500–$4,500. Hose failures that seem minor ($200 repair) become $8,000+ events when contaminated fluid destroys downstream components. Preventive fluid analysis every 500 hours catches contamination before it cascades.
30–40% of total maintenance budgetBrakes — Accelerated by Stop-and-Go Duty
Residential refuse trucks stop 800–1,200 times per shift under heavy load. Brake lining life on a refuse truck is 40–60% shorter than over-the-road trucks covering similar miles. Budget $1,500–$3,000 per axle for brake work annually. Drum brake adjustment is the single highest-return preventive task — improper adjustment multiplies wear rate by 3–5x and dramatically increases stopping distance risk.
Replace 2–3x more often than OTR trucksTires — Load and Maneuver Stress
Refuse trucks carry maximum legal payloads through tight residential streets with frequent curb contact and sharp turning. Commercial truck tires cost $400–$600 each. A well-maintained 6-tire refuse truck spends $4,000–$6,000 annually on tires. Proper inflation tracking (software-monitored TPMS data) recovers 3–8% fuel economy and extends tire life 15–20%.
$4,000–$6,000 annually per truckEngine & Emissions Systems
Modern diesel refuse trucks require careful emissions system maintenance — DPF (diesel particulate filter) cleaning every 150,000–200,000 miles at $500–$800, SCR system maintenance, and DEF management. Neglected emissions systems cause engine derating that reduces power by 25–40% and eventually forces shutdown. A mid-route engine derate costs $3,000–$8,000 in towing plus missed collection penalties.
Derating event: $3,000–$8,000What causes the most garbage truck breakdowns?
Understanding breakdown causes is the foundation of effective preventive maintenance. Refuse trucks fail in predictable patterns — the same systems fail repeatedly because they experience the most stress. Fleet managers who track breakdown root causes with software can eliminate 60–70% of unplanned downtime within 12 months. See how FleetRabbit tracks breakdown patterns →
Top Breakdown Causes — US Refuse Fleets
Hydraulic System Failures (35–45% of Breakdowns)
Hose ruptures, pump failures, and cylinder leaks are the leading cause of mid-route breakdowns. Most are preceded by warning signs visible during pre-trip inspection — weeping fittings, slow actuator response, abnormal fluid color. Operators skipping daily hydraulic checks miss these signals until catastrophic failure.
Most common breakdown causeBrake System Issues (20–25% of Breakdowns)
Brake fade, lining failure, and air system problems are disproportionately common in refuse fleets due to extreme stop-and-go cycles. A fully loaded rear-loader braking from 25 MPH 1,000 times per shift generates heat equivalent to a long-haul truck descending a mountain grade. Brake adjustment is the most impactful single preventive task.
Second most common causeElectrical and Body Systems (15–20%)
Compactor control system faults, backup camera failures, lighting issues, and body electrical gremlins. Corrosive waste leachate attacks wiring harnesses from underneath. Regular underbody wash-downs and harness inspection prevent most electrical failures. Control module replacement runs $1,500–$4,000 when diagnostics are delayed.
Often prevented by wash-down programsTire Failures (10–15%)
Blowouts from overloading, curb strikes, and debris punctures. Run-flat situations in residential areas are particularly hazardous and expensive — a single blowout requiring roadside service averages $800–$1,500 including towing if the vehicle can't limp to a tire dealer. Daily pre-trip tire inspection catches issues before they become mid-route emergencies.
$800–$1,500 per roadside eventEngine Derates from Emissions Systems
DPF regeneration failures, DEF system faults, and SCR catalyst issues trigger engine derating that progressively reduces power to 25% of rated output. The warning signs are visible in diagnostic data weeks before forced shutdown — software monitoring fault codes catches these patterns before they strand a truck.
Preventable with telematics monitoringSuspension and Chassis Fatigue
Leaf spring failures, worn bushings, and frame stress cracks develop from cyclic overloading — especially when operators routinely overload beyond GVWR to maximize collections per shift. Annual frame inspections and documented load monitoring prevent catastrophic failures that sideline trucks for weeks during welding and structural repair.
Structural repair: $5,000–$15,000How do you create a refuse truck maintenance schedule?
An effective refuse truck maintenance schedule combines mileage-based intervals with engine-hour-based triggers and cycle-count tracking — because refuse trucks accumulate mechanical wear through three separate mechanisms simultaneously. A calendar-only or mileage-only approach chronically under-maintains or over-maintains at the same time.
Multi-Trigger Maintenance Scheduling Framework
Why Mileage Alone Fails for Refuse Trucks
A residential rear-loader covering 80 miles per shift runs its engine at idle for 50% of that time while operating the compactor — accumulating engine hours at 3–4x the rate of an OTR truck per mile driven. A truck with 100,000 miles may have 8,000+ engine hours. Using only odometer readings misses half the wear picture. FleetRabbit tracks both simultaneously and triggers whichever threshold arrives first.
Compactor Cycle Counting
Hydraulic components wear by cycles, not miles or hours alone. A heavy commercial route cycling the compactor 400 times per shift wears hydraulic components twice as fast as a lighter residential route cycling 200 times. Telematics PTO monitoring counts every compactor activation, enabling precise component-life scheduling — cylinder rebuilds triggered at 50,000 cycles rather than arbitrary calendar intervals.
Recommended Maintenance Intervals — Refuse Trucks:
- Engine oil and filter — Every 15,000–25,000 miles OR 400–500 engine hours (whichever first)
- Hydraulic fluid analysis — Every 500 operating hours; fluid change every 1,000–1,500 hours
- Brake inspection and adjustment — Every 20,000–25,000 miles; lining replacement by wear measurement
- Compactor blade inspection — Every 30,000 cycles or 6 months; replacement when wear exceeds 25%
- DPF cleaning — Every 150,000–200,000 miles or at first sign of restricted regen
- Full chassis greasing — Every 25,000 miles or every 3 months; every 6 weeks in high-cycle operations
- Annual frame inspection — Structural inspection by qualified technician every 12 months
- Transmission service — Every 100,000 miles for Allison automatics common in refuse trucks
What are the best practices for reducing garbage truck maintenance costs?
The gap between well-managed and poorly managed refuse fleets is substantial — typically $15,000–$25,000 per truck per year in maintenance spend. Operators who systematically apply preventive practices and use data to guide decisions consistently outperform those running reactive maintenance programs. Start tracking your maintenance data with FleetRabbit →
Six Highest-Impact Cost Reduction Practices
Implement Digital DVIRs Immediately
The single highest-return maintenance investment. Digital pre-trip inspections catch hydraulic leaks, brake issues, and body defects before they become mid-route failures. A $200 hydraulic hose repair at the depot versus an $8,000 catastrophic pump failure mid-route — the math is unambiguous. FleetRabbit's mobile app completes refuse-specific DVIRs in under 5 minutes with photo documentation.
$200 depot fix vs $8,000 field failureTrack Engine Hours, Not Just Miles
Refuse trucks accumulate engine wear 3–4x faster per mile than OTR trucks due to idle time running hydraulics. Software that tracks engine hours enables accurate PM scheduling that neither over-maintains (wasting money) nor under-maintains (risking failure). Most fleet management platforms, including FleetRabbit, sync engine hours directly from telematics.
Prevents both over and under maintenanceHydraulic Fluid Analysis Program
Oil analysis at $25–$50 per sample reveals contamination, metal particle levels, and fluid degradation weeks before failure. A single hydraulic pump saved by early contamination detection ($3,500 pump + 1 day downtime = $4,500 cost avoidance) pays for 90+ oil analysis samples. Run analysis every 500 operating hours at minimum — more frequently on trucks showing elevated particle counts.
$25 sample prevents $4,500+ repairsDaily Underbody Wash Program
Waste leachate is corrosive — it attacks wiring harnesses, brake components, frame coatings, and hydraulic hose fittings from underneath. Operators who run daily or every-other-day underbody wash programs report 30–40% lower electrical repair rates and significantly extended frame life. The cost is $8–$15 per wash; the alternative is $3,000–$8,000 wiring harness replacements.
$15 wash prevents $8,000 harness replacementParts Inventory Optimization
The most common downtime extender isn't the repair itself — it's waiting for parts. Fleets that stock common wear items (brake linings, hydraulic hoses, compactor blade segments, filters, belts) reduce average repair turnaround by 40–60%. Software tracks parts usage rates and triggers reorder points automatically, ensuring the shop never runs out of high-turn items.
40–60% faster repair turnaroundDriver Defect Reporting Culture
Drivers are the first line of defense against breakdowns. Fleets where drivers actively report minor defects during daily DVIRs catch problems weeks earlier than fleets where drivers feel reporting issues creates extra work or scrutiny. Digital reporting systems make defect submission frictionless — drivers submit photos from the route, dispatchers see them instantly, and work orders generate automatically.
First line of breakdown preventionHow does predictive maintenance work for refuse fleets?
Predictive maintenance uses sensor data, telematics, and pattern recognition to identify developing failures before they cause breakdowns. Unlike time-based PM (change oil every X miles) or reactive maintenance (fix it when it breaks), predictive maintenance acts on early warning signals that indicate a specific component is approaching failure — enabling precise intervention at the lowest possible cost.
Predictive Maintenance Technology Stack
Telematics & Engine Diagnostics
Real-time monitoring of coolant temperature trends, oil pressure patterns, DPF soot loading, transmission shift quality, and battery voltage. Software algorithms identify abnormal trends — a coolant temperature that runs 8°F higher than baseline three days in a row signals a developing thermostat or cooling system issue weeks before overheating. FleetRabbit integrates with telematics providers to surface these alerts automatically.
Hydraulic Pressure Trend Analysis
Compactor systems operate within defined pressure ranges. Gradual pressure decline over weeks of normal use signals pump wear or internal leakage. Software tracking hydraulic pressure readings across thousands of cycles identifies the 8% decline that predicts pump failure 4–6 weeks out. Scheduled replacement during a planned maintenance window costs $2,800. Emergency roadside replacement with towing costs $7,500+.
Oil Analysis Integration
Fluid samples processed by lab services return particle counts, metal types, and contamination indicators. Software tracks sample history by vehicle — rising iron particle counts indicate cylinder wall wear; copper particles indicate bearing wear. When levels exceed threshold, the system creates a work order for deeper inspection before the bearing fails catastrophically.
Predictive vs Reactive Maintenance — 50-Truck Fleet
What are the DOT inspection requirements for garbage trucks?
Garbage trucks operating over 10,001 lbs GVWR (virtually all commercial refuse trucks) are subject to FMCSA regulations including daily driver vehicle inspection reports, annual vehicle inspections, and random roadside inspections. Non-compliance carries fines from $1,000 to $16,000 per violation and can result in out-of-service orders that take trucks off the road immediately.
DOT Compliance Requirements for Refuse Fleets
Daily DVIR — 49 CFR 396.11
Drivers must complete a written inspection report at the end of each day for vehicles over 10,001 lbs GVWR, covering: service brakes, parking brake, steering, lights, tires, horn, windshield wipers, mirrors, coupling devices, and emergency equipment. Any defects must be certified as repaired before the next trip. Digital DVIRs satisfy this requirement when they include driver signature, date, time, and vehicle identification. Records must be retained 3 months.
Annual Inspection — 49 CFR 396.17
All CMVs must receive a thorough annual inspection by a qualified inspector meeting FMCSA standards. The inspection covers 40+ system areas including brake adjustment measurements, steering lash, frame condition, and lighting. The inspection report must be retained for 14 months. Many refuse operators schedule these to coincide with major annual maintenance to reduce downtime. FMCSA-certified shops issue the required Form MCS-150.
Out-of-Service Criteria
Roadside inspectors use CVSA Out-of-Service Criteria to determine if a vehicle is too unsafe to operate. Brake adjustment beyond 20% of stroke limit, any hydraulic system leak that could impair braking, tire with less than 2/32" tread depth, any cracked or broken frame member, and inoperable required lighting all trigger immediate OOS orders. A single OOS event on a commercial refuse truck means the vehicle sits until repaired and re-inspected.
Compliance Tracking — What Software Automates:
- DVIR record retention — Digital records stored automatically, searchable by date, vehicle, or driver
- Annual inspection due dates — Automated alerts 30, 60, and 90 days before expiration
- Driver certification expiration — CDL, medical card, hazmat endorsements all tracked with advance notice
- Defect-to-work-order automation — DVIR defects automatically generate maintenance work orders
- Audit-ready export — DOT audit package generated in minutes instead of hours of filing cabinet search
How does fleet management software reduce garbage truck repair costs?
Fleet management software reduces repair costs through four mechanisms: catching problems early through inspections and monitoring, automating preventive maintenance to prevent deferred service, providing data to identify problem vehicles before they become money pits, and eliminating administrative waste that inflates labor costs without producing maintenance value. See how FleetRabbit reduces your repair costs →
Four Cost Reduction Mechanisms
Early Detection — The Biggest Lever
Digital DVIRs catch hydraulic weeps, brake adjustment issues, and compactor anomalies at depot before they become field failures. The math is consistent: depot repair costs 10–25% of what the same failure costs mid-route. A $200 hose replacement at 6 AM versus a $5,000+ emergency repair including towing, overtime labor, missed collections, and SLA penalties. FleetRabbit surfaces DVIR defects to maintenance supervisors in real time.
Preventive Maintenance Automation
Software tracks every PM interval by mileage, engine hours, and calendar simultaneously — sending alerts before due dates, not after. Deferred PM is the silent budget killer: an oil change 3,000 miles overdue doesn't break a truck, it just accelerates wear. But 15 trucks each deferring oil changes 3,000 miles adds up to premature engine overhauls across the fleet. Automation eliminates the human memory dependency.
Identifying High-Cost Vehicles
Software tracks total cost of ownership per vehicle — maintenance spend, downtime frequency, fuel consumption, and repair category analysis. Operators discover that 15% of trucks generate 40–60% of maintenance costs. Armed with this data, the decision to repair vs. retire a high-cost vehicle becomes objective rather than emotional. Most fleets identify 2–4 vehicles for early retirement within the first year of data collection.
Parts and Labor Efficiency
Work order management tracks time-to-repair, parts consumption by vehicle, and technician efficiency. Patterns emerge: certain trucks always need the same repair (indicating a design issue), certain technicians take 40% longer on hydraulic work (indicating a training opportunity), certain parts always require emergency ordering (indicating a stocking failure). Each pattern represents recoverable cost.
How do you train drivers to support garbage truck maintenance?
Driver behavior directly determines maintenance spend — not just through operating habits that accelerate wear, but through inspection quality and defect reporting that determines whether problems get caught early or discovered after failure. The best maintenance program in the world underperforms if drivers skip pre-trips, under-report defects, or operate abusively between services.
Driver Maintenance Training Framework
Inspection Training
Train drivers on what they're actually looking for — not just "check hydraulics" but what a weeping fitting looks like versus a catastrophic leak, what proper compactor blade engagement sounds like versus a grinding that signals wear, what acceptable tire condition is versus a bulge that means immediate replacement. Photo examples of good versus defective conditions in the DVIR app remove ambiguity.
Operating Technique
Refuse truck operating technique significantly affects wear rates: compactor activation at proper hydraulic temperature (cold-weather pre-warming reduces pump wear 20%), brake modulation instead of aggressive application, proper loading technique that avoids overloading beyond GVWR, and smooth acceleration and deceleration that extends brake and drivetrain life. A one-day operating technique workshop typically reduces brake and hydraulic costs 10–15% fleet-wide.
Defect Reporting Culture
Drivers who feel defect reports result in punishment or extra scrutiny under-report. Fleets that celebrate early defect catches — publicly recognizing drivers whose reports prevented breakdowns — see reporting rates increase 60–80%. Digital reporting makes the act frictionless: photo submission from the cab, no paperwork, instant acknowledgment from dispatch. FleetRabbit's mobile app is built for this workflow.
What ROI can waste fleets expect from maintenance software?
Maintenance management software consistently delivers the highest ROI of any technology investment a refuse fleet operator can make — with most fleets achieving full payback within 4–8 months. The savings are compounding: better data enables better decisions, which reduce costs, which free budget for further improvements. Sign up to start building your savings case today →
Maintenance Software ROI — 30-Truck Refuse Fleet
Typical software investment for 30 trucks: $18,000–$30,000/year → ROI ratio: 14:1 to 23:1. Payback typically within 90–120 days.
Additional ROI Factors Often Overlooked:
- Vehicle life extension — Well-maintained refuse trucks last 12–15 years vs 8–10 for poorly maintained ones; each year of extended life saves $80,000–$120,000 in replacement cost
- Insurance benefits — Digital DVIR documentation reduces liability claims and may lower premiums by 8–15%
- Municipal contract retention — Documented maintenance records and performance data strengthen contract renewal positions
- Resale value — Complete digital maintenance history increases truck resale value by $8,000–$15,000 per vehicle
Start Cutting Maintenance Costs This Week
Deploy FleetRabbit's digital DVIRs and automated maintenance scheduling across your refuse fleet — no credit card, no contracts. Most fleets are live within 48 hours.