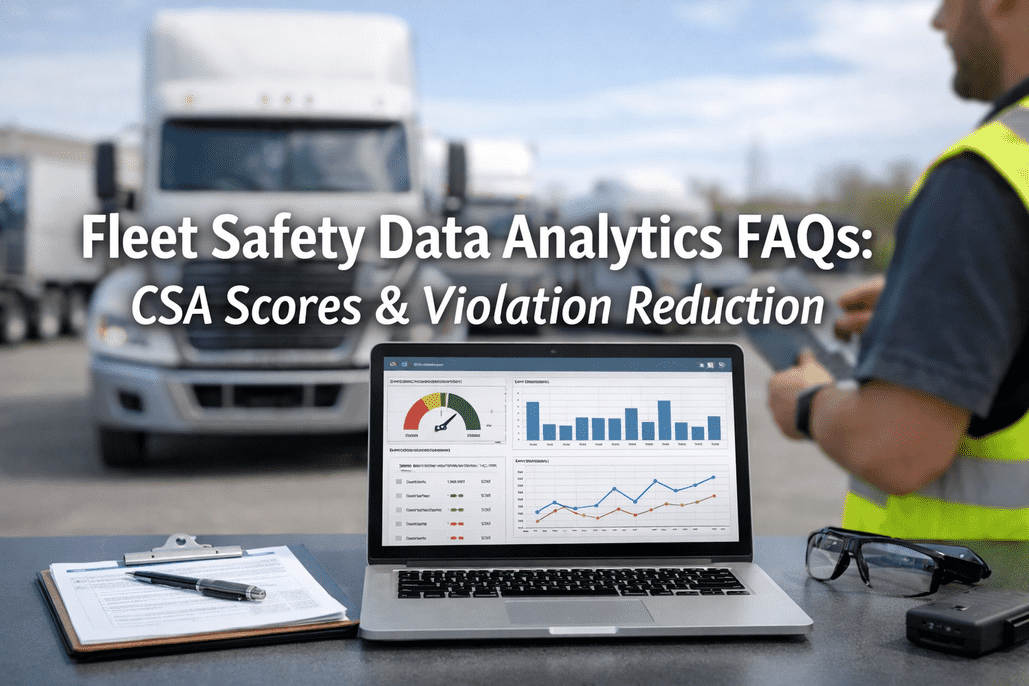
Fleet safety has become a data science problem. With FMCSA's Safety Measurement System processing 3.5 million roadside inspections and 130,000 reported crashes annually — updated monthly — carriers that can't read, interpret, and act on their safety data are flying blind in an enforcement environment that gets smarter every cycle. The average investigation now uncovers six violations with settlements averaging $7,155 per closed case, and CSA scoring has been a top-10 industry concern for eight of the last nine years. This FAQ guide answers the most common fleet safety data analytics questions so you can turn raw inspection data into actionable improvement strategies. Sign up for FleetRabbit to digitize inspections, track maintenance compliance, and build the data foundation that drives CSA score improvement.
Build Your Fleet's Safety Data Foundation
FleetRabbit digitizes inspections and maintenance records — creating the structured data that drives CSA score improvement and audit-ready compliance documentation.
Frequently Asked Questions
What are CSA scores and how does the Safety Measurement System work?
CSA (Compliance, Safety, Accountability) is FMCSA's safety enforcement program that scores every motor carrier on a 0-100 percentile scale — with lower scores indicating better performance. The system uses roadside inspection data, crash reports, and investigation findings processed through the Safety Measurement System (SMS), updated monthly. Your CSA scores are essentially the federal government's safety report card for your fleet, and they have profound implications for every aspect of your operation:
How CSA Scoring Works
The 7 BASIC Categories (Current → 2026 Transition)
Unsafe Driving
Speeding, reckless driving, lane changes, seatbelt, cell phone use. Under 2026 overhaul: now absorbs Controlled Substances/Alcohol violations and OOS order violations.
Crash Indicator
DOT-reportable crashes (injury, towaway, or fatality). Based on state-reported crash data. Not publicly visible — only accessible by the carrier. Carriers can dispute preventability via DataQs.
HOS Compliance
Falsified records, ELD violations, driving/on-duty/rest break violations. A leading factor in crashes — 13% of CMV drivers were fatigued at time of serious crash (FMCSA study).
Vehicle Maintenance
Largest BASIC by volume. Under 2026 overhaul: splits into standard "Vehicle Maintenance" and "Vehicle Maintenance: Driver Observed" for walk-around-detectable issues.
Driver Fitness
Invalid CDL, expired medical certificates, incomplete driver qualification files. Missing DQF documents account for nearly 12% of all FMCSA violations.
Controlled Substances/Alcohol
Drug/alcohol use or testing violations. Being absorbed into Unsafe Driving under 2026 overhaul due to low violation volume and strong correlation with unsafe driving behaviors.
Hazardous Materials
Placarding, packaging, documentation errors for HM carriers. Not publicly visible. Separate intervention thresholds for HM carriers (60%).
Your scores impact everything: insurance premiums, audit frequency, broker relationships, and driver recruitment. A score below 50% in all categories gives you negotiating power with insurers, while scores above 65% in critical BASICs trigger warning letters and increased enforcement attention. It generally takes 20 clean inspections to offset the impact of one bad inspection — making prevention far more valuable than remediation.
What safety KPIs and metrics should fleet managers track?
Effective fleet safety programs track metrics across four domains — driver behavior, vehicle condition, compliance status, and operational outcomes. The key is connecting these data streams so you can see how behaviors in one area affect outcomes in another:
Essential Fleet Safety KPIs
The biggest improvements come from unifying these data streams. When you can see that harsh braking events correlate with specific routes or time-of-day patterns, or that vehicle maintenance defects cluster in specific equipment types, you move from reactive compliance to predictive safety management. Schedule a FleetRabbit demo to see how digital inspection data integrates with your safety analytics.
How can data analytics reduce CSA violations and improve scores?
Data-driven violation reduction follows a systematic process: identify where violations concentrate, understand root causes, implement targeted interventions, and measure the impact. Carriers that apply this approach consistently see dramatic improvements — one fleet reduced its Vehicle Maintenance BASIC percentile from 68 to 49 by using analytics to optimize PM intervals and close repairs within 48 hours:
Data-Driven Violation Reduction Framework
Analyze: Where Are Violations Concentrating?
Pull your SMS data monthly and map violations by BASIC category, violation type, driver, vehicle, terminal, and time period. Under the 2026 overhaul, approximately 1,000 violation codes consolidate into ~100 violation groups — making trend analysis more actionable. Look for the 20% of causes driving 80% of violations.
Diagnose: What's Causing the Patterns?
Vehicle maintenance violations may cluster in specific equipment types or age brackets. Driver behavior violations may correlate with experience level, route assignment, or time of day. HOS violations may stem from dispatch practices rather than driver decisions. Connect telematics data with inspection results to find the underlying operational drivers.
Intervene: Target the Highest-Impact Areas
Focus resources where the data points. If brakes are your top Vehicle Maintenance violation, adjust PM intervals for brake inspections specifically. If a small group of drivers generates most unsafe driving events (10% of drivers cause 40% of crashes), implement intensive coaching programs for that cohort rather than fleet-wide generics.
Measure: Track Impact Over Time
SMS updates monthly — monitor your percentile movement after interventions. Remember: violations stay in the system for 24 months but are time-weighted (recent violations matter more). Consistent clean inspections compound over time. It takes approximately 20 clean inspections to offset one bad inspection, so sustained effort is essential.
FleetRabbit's digital inspection platform creates the structured, searchable data that makes this analysis possible — every DVIR, defect, repair, and inspection result feeds directly into your safety analytics pipeline.
What is driver scorecard analytics and how does it improve fleet safety?
Driver scorecards combine multiple data points — telematics events, violation history, MVR records, training scores, and manager observations — into a composite risk score for each driver. This transforms abstract data into actionable, individual performance profiles:
Driver Scorecard Components
The most effective scorecard programs don't just measure — they create feedback loops. Real-time dashboards give drivers visibility into their own performance. Managers receive alerts when scores decline. Gamification programs (points, competitions, recognition) sustain engagement far longer than one-time training sessions. Continuous monitoring with these scorecards has demonstrated a 22% reduction in monthly violations and 14% reduction in monthly crashes within the first year.
How does the DataQs dispute system work and when should carriers use it?
DataQs is FMCSA's system for challenging inaccurate inspection or crash data in your Safety Measurement System records. It's an essential but underutilized tool — less than 1% of 3.5 million annual inspections are challenged, yet many carriers have legitimate grounds to dispute incorrect violations that inflate their CSA scores:
DataQs Dispute Process
Identify Disputable Data
Review every inspection for accuracy. Common grounds include: violation assigned to wrong carrier, incorrect vehicle information, duplicate data entries, violations already corrected on scene but still recorded, and citations that were dismissed in court.
Gather Supporting Evidence
Strong DataQs challenges require clear documentation: ELD records, timestamped photos, repair receipts, court dismissal orders, witness accounts, or proof of correct licensure. Vague challenges without evidence are typically denied.
Submit Through DataQs Portal
File at dataqs.fmcsa.dot.gov with your DOT number. The challenge routes to the issuing state for review. Carriers have two years to contest a citation. Be specific — list exact issues (missing records, incorrect information, wrong carrier assignment).
Track Resolution
If the violation is dismissed, it is erased from your CSA score. You can also challenge the severity of an infraction to mitigate its overall score impact. States have been responsive to legitimate requests, but the process requires patience and documentation.
DataQs Best Practices
Turn Safety Data Into Score Improvement
FleetRabbit creates timestamped, searchable inspection and maintenance records — the exact documentation you need for DataQs disputes and ongoing CSA score management.
What's changing with CSA analytics under the 2026 SMS overhaul?
The Safety Measurement System is undergoing its most significant overhaul since the CSA program launched in 2010. These changes will fundamentally alter how safety data is categorized, weighted, and interpreted — requiring fleet safety analytics strategies to adapt:
2026 SMS Analytics Changes
Violation Groups Consolidated
Nearly 1,000 unique violations consolidating into approximately 100 violation groups. This simplifies trend analysis but means individual violations may shift between categories. Carriers need to remap their analytics dashboards to the new groupings.
Severity Weights Simplified
Complex 1-10 severity scale replaced with two-tier system: Out-of-Service violations = weight 2, all other violations = weight 1. Analytics should now focus heavily on tracking and preventing OOS events specifically.
BASICs Become Compliance Categories
Controlled Substances/Alcohol absorbed into Unsafe Driving. Vehicle Maintenance splits into standard and "Driver Observed." New segmentation means carriers need to track driver-detectable vs. mechanic-detectable vehicle issues separately.
Percentile Smoothing Added
New median benchmarks prevent sudden score jumps when carriers move between safety event groups. More stable scoring over time, but still rewards consistent safety improvement. Preview scores on FMCSA's CSA Prioritization Preview site.
The overarching theme: FMCSA is moving toward data-driven, continuous safety oversight. The accuracy of your fleet's safety data becomes more important than ever. Carriers invested in electronic fleet management systems — where inspections, maintenance, and compliance are documented digitally — will have a structural advantage in both compliance and analytics capability. Schedule a call with FleetRabbit to prepare your analytics strategy for the new scoring methodology.
Data-Driven Safety Starts Here
FleetRabbit turns every inspection, defect, and repair into structured, analyzable data — building the safety intelligence foundation that drives CSA score improvement, lowers insurance premiums, and protects your fleet from costly violations.