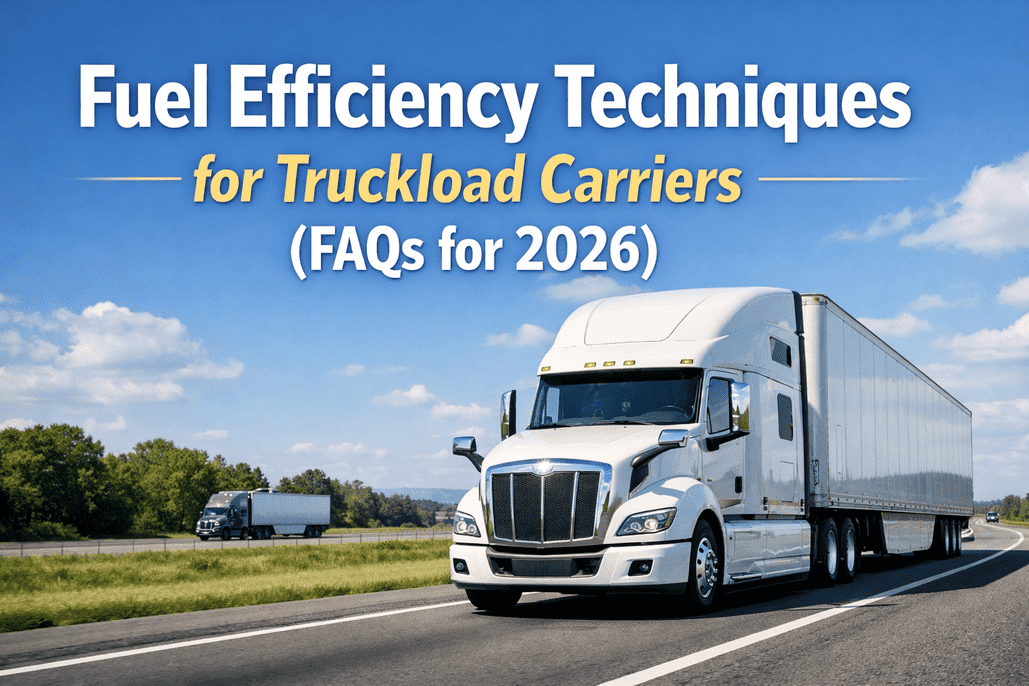
Fuel remains the single largest operating expense for truckload carriers, consuming up to 40% of annual fleet costs. Yet the gap between average and best-in-class performance is enormous: the national average combination truck achieves 6.9 MPG, while top-performing NACFE study fleets now average 7.77 MPG — and the latest model-year trucks are hitting 8.0 to 9.5 MPG in real-world operations. That 0.87 MPG difference between average and study-fleet performance translates to $4,956 in savings per truck per year at average fuel prices, or $512 million across 75,000 trucks. Diesel prices remain more than 30% above pre-pandemic levels, and the EIA projects further increases into 2026. This FAQ guide answers the most common fuel efficiency questions so truckload carriers can close the MPG gap using proven techniques available today. Sign up for FleetRabbit to digitize vehicle inspections and maintenance tracking — the operational foundation that keeps trucks running at peak fuel efficiency.
Fuel Efficiency Starts with Maintenance Discipline
FleetRabbit digitizes DVIRs and maintenance schedules — ensuring tire pressure, air filters, and engine health never silently drain your MPG.
Frequently Asked Questions
What are the biggest factors affecting truck fuel efficiency?
Fuel efficiency is never determined by a single factor — it's the interplay of six primary variables that collectively determine whether your fleet runs at 6.5 MPG or 8.5 MPG. Understanding how these factors interact is the first step to a systematic improvement strategy:
The Six Fuel Efficiency Factors
Driver Behavior
The single biggest controllable variable. Aggressive acceleration and braking alone can slash MPG by up to 20% on mixed routes. Speed is the most impactful factor — every 1 MPH increase above 65 MPH costs 0.14 MPG. A truck at 75 MPH burns 27% more fuel than at 65 MPH. The difference between the best and worst drivers in the same fleet can exceed $1,000 per week in fuel cost alone.
Aerodynamics
At highway speeds above 50 MPH, aerodynamic drag becomes the dominant force consuming fuel. A 2% reduction in drag yields a 1% improvement in fuel efficiency. Missing fairings, bent bumpers, loose cab extenders, large tractor-trailer gaps, and aftermarket grille guards all disrupt airflow and drain MPG. Even tractor paint color matters — lighter colors reduce HVAC load.
Idling
A long-haul truck idles approximately 1,800 hours per year for rest periods. At 0.6-1.5 gallons per hour, that's $4,000-$6,000 in wasted fuel annually per truck at $4/gallon diesel. Excessive idling (over 25% of engine time) also contaminates oil, triggers forced DPF regeneration cycles, and accelerates engine wear. Target: under 25% idle time.
Maintenance
Neglected maintenance silently drains fuel economy. Every PSI below recommended tire pressure costs 0.2% in fuel efficiency. Skipping oil changes and air filter replacements reduces economy by approximately 4%. Misaligned wheels, worn injectors, and dirty fuel filters compound the problem. Fleets that make fuel consumption visible to VIN level see 3-7% MPG improvement in the first quarter.
Load & Route
Overloading beyond the engine's ideal torque band causes a 15% efficiency drop if the turbo diesel constantly operates above 1500 RPM. Regional haul routes are inherently less fuel efficient than long-haul due to more stop-and-go driving. Traffic, terrain, and weather all affect actual fuel consumption beyond what any MPG spec predicts.
Equipment Spec
Newer trucks with factory-integrated efficiency features consistently outperform older equipment. Fleet technology adoption has grown from 17% to 42% (all-time high). The SuperTruck programs demonstrated that production-level trucks can achieve 10.7-16 MPG at 65,000 lbs GVW. Equipment decisions made at spec lock in efficiency for the vehicle's entire lifecycle.
How does speed management improve fuel economy?
Speed is the single most impactful operational lever for fuel efficiency — and it's free to implement. The physics are unforgiving: aerodynamic drag increases with the square of speed, meaning fuel consumption climbs exponentially, not linearly, as speed rises. The ATA estimates that capping truck speeds to 65 MPH would save the trucking industry $2.8 billion over 10 years:
Speed vs. Fuel Cost Impact
Beyond speed limits, maintaining consistent speed matters almost as much. Cruise control eliminates unnecessary acceleration/deceleration cycles — among the most wasteful fuel patterns. Progressive shifting (shifting at the lowest RPM that still delivers adequate torque) reduces engine strain and improves fuel consumption. Smart cruise control systems in newer trucks automatically adjust for hills, curves, and road conditions. Schedule a FleetRabbit demo to see how digital fleet management supports fuel-efficient operations.
What idle reduction strategies deliver the best ROI?
Idle reduction is arguably the highest-ROI fuel initiative because idle fuel is 100% waste — it moves zero freight. The average long-haul truck idles 1,800 hours per year, but the technology landscape for eliminating that waste has evolved significantly:
Idle Reduction Technologies Compared
What aerodynamic upgrades provide the best fuel savings?
Aerodynamic improvements offer some of the most cost-effective fuel savings because they work continuously at highway speeds without requiring ongoing driver behavior changes. At speeds above 50 MPH, aerodynamic drag is the dominant force consuming fuel:
Aerodynamic Upgrades: Cost vs. Savings
Side Fairings & Cab Extenders
Redirect airflow past the tractor-trailer gap. Standard on most new trucks. Retrofit available for older equipment. Check for damage during walk-arounds — bent or missing extenders cost measurable MPG.
Roof Fairings & Fuel Tank Skirts
Roof fairings smooth airflow over the trailer. Fuel tank fairings deflect air past side-mounted tanks. Both are low-maintenance passive devices that work at all highway speeds. Missing or damaged roof fairings create significant drag.
Trailer Side Skirts
Installed along the bottom of the trailer to close the open gap between axles. Among the most cost-effective aerodynamic upgrades. SmartWay-verified options available. Relatively inexpensive to install and maintain.
Rear Tail Fairings / Boat Tails
Reduce the low-pressure wake zone behind the trailer. Available as folding or inflatable designs that don't interfere with dock loading. Some designs automatically deploy at highway speeds.
Tractor-Trailer Gap Reducers
Devices like TruckWings that close the gap between tractor and trailer at highway speeds. If you have a sliding fifth wheel, slide the trailer forward (minimal inches) to reduce the gap — but respect steer capacity and swing clearance.
Low Rolling Resistance Tires & ATIS
Low rolling resistance tires reduce the energy needed to move the truck. Automatic tire inflation systems (ATIS) maintain optimal pressure continuously. Every 5 PSI below spec costs ~1% MPG. Wide-base single tires also reduce weight and drag.
Cumulative aerodynamic improvements can stack to 10-15% fuel reduction when combined. The key is ensuring existing aerodynamic equipment stays intact — broken fairings, missing skirts, and damaged bumpers negate the investment. Digital inspection platforms like FleetRabbit catch these defects during daily DVIRs before they silently drain fuel economy.
Catch Fuel-Draining Defects Before They Cost You
FleetRabbit's digital DVIR platform ensures tire pressure, damaged fairings, loose components, and engine issues get documented and repaired — protecting your fuel economy every day.
How does preventive maintenance affect fuel economy?
Maintenance is the silent fuel efficiency killer. Unlike speed or idling, maintenance-related fuel waste is invisible — a truck with low tire pressure or dirty filters doesn't trigger any warning light, but it burns extra fuel on every mile. Fleets that make fuel consumption visible down to the VIN level typically see 3-7% MPG improvement in the first quarter of deployment:
Maintenance Items That Drain Fuel Economy
The compounding effect is significant: a truck with low tire pressure, dirty filters, and a missing fairing may be losing 8-12% in fuel economy — completely invisible without systematic monitoring. At 100,000 miles and 6.5 MPG, that's 1,200-1,800 gallons of wasted fuel per year, or $4,400-$6,600 at current prices.
What role does technology play in fleet fuel management?
Technology adoption for fuel efficiency has reached an all-time high of 42% across major fleets, growing from just 17% a decade ago. The NACFE study found that 14 fleets operating 75,000 trucks saved $512 million in 2023 compared to the average truck on the road — driven primarily by technology-enabled efficiency gains. Here are the technology categories making the biggest impact:
Fuel Management Technology Stack
The Maintenance Layer of Your Fuel Strategy
FleetRabbit provides the digital inspection and maintenance foundation — ensuring tire pressure, air filters, fairings, and engine health are systematically tracked and maintained to protect every MPG improvement you've invested in.