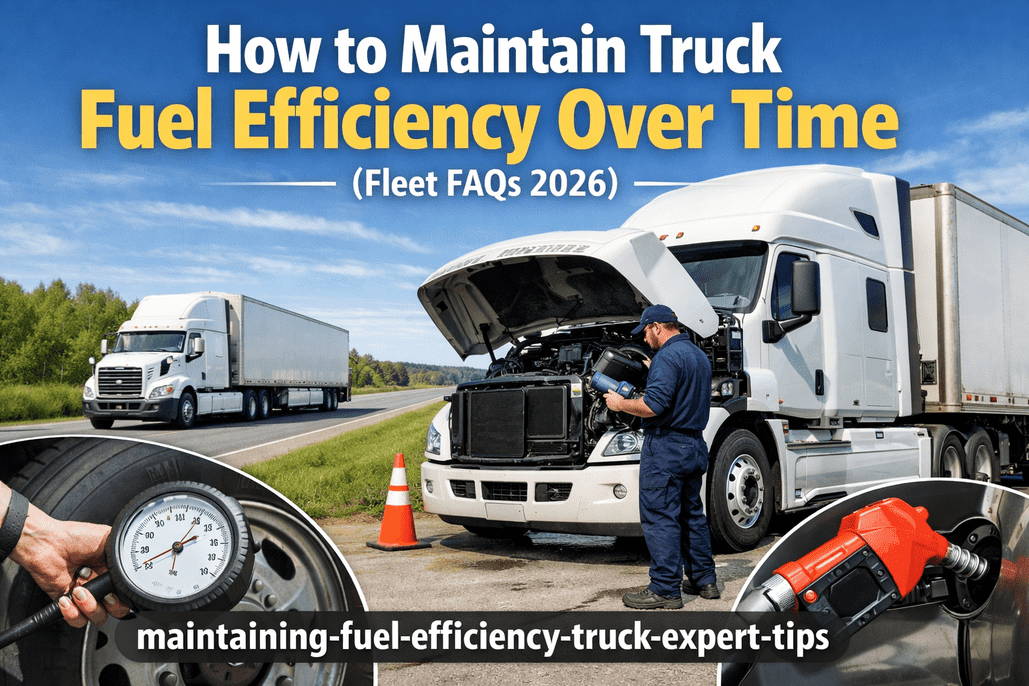
Fuel efficiency isn't something you achieve once — it's something you defend every day. A new Class 8 truck rolling off the line in 2025 can hit 10-11 MPG on highway routes, but without disciplined maintenance, those numbers degrade silently: a few PSI lost here, a skipped filter change there, and within 18 months your $180,000 investment is performing like a truck half its age. The NACFE found that top-performing fleets sustain 7.77 MPG versus the 6.9 MPG national average — and the difference isn't better trucks, it's better maintenance discipline. That 0.87 MPG gap costs the average fleet $4,956 per truck per year. This FAQ guide covers the proven maintenance practices, tire management strategies, engine care routines, and driving habits that protect your fuel economy over time. Sign up for FleetRabbit to digitize inspections and maintenance tracking — the operational backbone that keeps every MPG improvement locked in.
Lock In Every MPG Improvement
FleetRabbit digitizes DVIRs, schedules preventive maintenance, and tracks defect resolution — ensuring tire pressure, filters, and aero components never silently drain your fuel economy.
Frequently Asked Questions
What preventive maintenance items have the biggest impact on fuel economy?
Fuel economy degradation rarely happens in one dramatic failure — it's death by a thousand cuts. A truck with low tire pressure, dirty filters, stale oil, and a missing fairing can lose 8-12% of its fuel efficiency without triggering a single warning light. The key is understanding which maintenance items have the biggest individual impact and building a PM schedule that catches them systematically:
The Fuel Efficiency Impact Breakdown
A bent bumper, missing cab extender, broken side fairing, or absent trailer skirt disrupts airflow at highway speeds. These items are often damaged in yard maneuvers or dock strikes and go unreported. At 100,000 miles and 7 MPG, a 5% loss means 714 extra gallons — $2,620 per year wasted.
Dirty oil increases internal engine friction. Restricted air filters starve the engine of combustion air, forcing richer fuel mixtures. Both degrade gradually — you won't feel the difference on any single trip, but over months the cumulative loss is significant. Low-viscosity oils (10W-30 vs. 15W-40) can save an additional 0.5-2.2% by reducing viscous drag.
Misaligned wheels create lateral drag that compounds over thousands of miles. Worn or fouled injectors reduce combustion precision, spraying fuel in suboptimal patterns. Annual alignment checks and injector maintenance pay for themselves in fuel savings within months.
Every PSI below recommended pressure costs 0.2% in fuel efficiency. Most fleets check tires weekly at best — and 54% of commercial tires are inflated more than 5 PSI from target (FMCSA). A truck running 10 PSI low across multiple tires loses 2%+ MPG invisibly. Tire-related violations account for 18.5% of all roadside out-of-service orders.
High idle time causes soot buildup in the diesel particulate filter, triggering forced regeneration cycles that burn fuel for 45 minutes to 2 hours. This creates a vicious cycle: idle more, more soot, more forced regens, even more wasted fuel. Target under 25% idle time to break the cycle.
How does tire management protect fuel efficiency long-term?
Tires are the single point of contact between your truck and the road — and they're responsible for more fuel waste and more roadside violations than any other component. The FMCSA found that only 46% of commercial vehicle tires are inflated within 5 PSI of target pressure, and CVSA reports tire violations account for 18.5% of all out-of-service orders. A comprehensive tire management strategy protects fuel economy, extends tire life, and reduces costly roadside events:
Tire Management Impact Matrix
Inflation Management
Maintain manufacturer-recommended pressure for each axle position. Use calibrated gauges. Check cold inflation before trips. Even 5 PSI across 18 tires adds up: roughly $200/year in wasted fuel per truck — and that's before accelerated tire wear costs.
Alignment & Rotation
Wheel misalignment creates lateral resistance on every rotation. Even 1/8 inch of toe-out on a steer axle creates measurable drag over thousands of miles. Regular alignment checks — especially after hitting curbs, potholes, or replacing suspension components — protect both fuel economy and tire life.
Low Rolling Resistance Tires
SmartWay-verified low rolling resistance tires reduce energy consumed with each revolution. Wide-base single tires (replacing dual assemblies) cut weight by 400-800 lbs and further reduce rolling resistance. The spec decision at procurement locks in efficiency for the tire's entire lifecycle — typically 100,000+ miles.
Retread Strategy
A properly managed retread program extends casing life through 2-3 retreads, saving $200-$400 per tire versus new replacements. Choose retread compounds rated for rolling resistance — not all retreads are equal for fuel economy. Track casing history to maximize returns and cull damaged casings before they fail.
The most impactful investment for continuous tire management is a tire pressure monitoring system (TPMS) or automatic tire inflation system (ATIS). These systems eliminate the gap between weekly manual checks — catching slow leaks, temperature-related pressure changes, and valve failures in real-time. The TPMS market for commercial vehicles is growing at 11-13% CAGR because the ROI is undeniable. Schedule a FleetRabbit demo to see how digital DVIR platforms integrate with tire management to create a complete maintenance loop.
What engine care practices sustain peak fuel efficiency?
Your engine is a thermodynamic system — and every subsystem that operates below spec reduces the percentage of fuel energy converted to forward motion. Modern diesel engines are engineered to hit 10-11 MPG on highway duty cycles when properly maintained, but that performance degrades through accumulation of small inefficiencies:
Engine Care Fuel Efficiency Practices
Oil Viscosity Optimization
Switching from 15W-40 to 10W-30 CK-4 oil can save 0.5-1.5% in fuel economy. For trucks model year 2017 and newer, FA-4 10W-30 lubricants provide an additional 0.4-0.7% savings — totaling up to 2.2% improvement. At $45,000 in annual fuel spend, that's $919 per truck. Across a 100-truck fleet: $91,900 in annual savings from an oil change.
Air Filtration System
A clean air filter ensures optimal air-to-fuel ratio in combustion. Restricted filters force richer mixtures that waste fuel. Modern engines use air filter restriction indicators — don't ignore them. Consider upgrading to extended-life air filtration systems that maintain flow efficiency longer between replacements. Monitor filter condition through telematics where available.
Fuel System Maintenance
Fuel injectors, fuel filters, and water separators all affect combustion precision. Worn injectors create uneven spray patterns, reducing combustion efficiency and increasing emissions. Fuel filter changes per OEM schedule prevent debris from reaching injectors. Water separators must be drained regularly to prevent microbial growth and injector corrosion, especially in humid climates.
Cooling System Health
Engine operating temperature directly affects combustion efficiency. A thermostat stuck open causes the engine to run cool, reducing fuel economy and accelerating oil dilution. Clogged coolant passages restrict heat transfer. Coolant condition should be tested periodically — degraded coolant accelerates corrosion and reduces heat transfer efficiency across the entire system.
Exhaust Aftertreatment
The DPF, DOC, and SCR system affect backpressure and engine efficiency. A DPF overloaded with soot increases exhaust backpressure, forcing the engine to work harder. Excessive idle causes premature soot loading. DEF quality matters — contaminated DEF triggers derates that waste fuel during limped operations. Keep aftertreatment clean to minimize forced regeneration cycles.
Software & Calibration Updates
OEMs regularly release ECM calibration updates that improve fuel mapping, shift logic, and aftertreatment management. Predictive cruise control — standard on most new trucks — adjusts throttle based on terrain data. Keep engine software current through dealer updates. Telematics platforms like Paccar Solutions and Cummins Connected Diagnostics provide prognostic alerts that schedule maintenance before performance degrades.
Track Engine Health Before It Costs You MPG
FleetRabbit's digital maintenance platform schedules PM intervals, tracks DTC alerts, and ensures oil changes, filter replacements, and inspections happen on time — protecting engine efficiency at every service cycle.
How do driving habits affect fuel efficiency over time?
Driver behavior is the single biggest controllable variable in fuel economy — the difference between the best and worst drivers in the same fleet, driving the same truck on the same route, can exceed $1,000 per week in fuel costs. The challenge isn't achieving good habits once; it's sustaining them over months and years as attention fades and complacency sets in:
Sustained Driving Habits That Protect MPG
Consistent Speed Discipline
Every 1 MPH above 65 MPH costs 0.14 MPG. A driver running consistently at 70 vs. 65 burns 15% more fuel — $14,600 per year over 100,000 miles. Optimal range: 56-62 MPH yields 9-10 MPG on long haul. Use cruise control to eliminate unnecessary acceleration/deceleration cycles. Progressive shifting at the lowest RPM with adequate torque reduces engine strain. Smart cruise on newer trucks automatically adjusts for hills and curves.
Idle Time Management
Average long-haul truck idles 1,800 hours/year, burning $4,000-$6,000 in fuel at $4/gallon diesel. Target: under 25% idle time. Idle management isn't just about fuel — excessive idling contaminates oil, triggers DPF regens, and accelerates engine wear. One hour less idle daily saves $800+ per year. High idle hours also reduce resale value — buyers interpret it as poor fleet management.
Smooth Acceleration & Braking
Aggressive acceleration and hard braking can reduce fuel economy by up to 20% on mixed routes. The energy wasted in hard braking is energy you already paid for in fuel. Anticipate traffic conditions, maintain following distance, and use progressive braking. In-cab coaching systems provide real-time feedback that sustains awareness — without them, most drivers revert to old habits within 90 days.
Pre-Trip Inspection Quality
A thorough pre-trip walk-around catches fuel-draining defects before they compound: low tires, damaged fairings, loose cab extenders, air leaks. Drivers who rush through pre-trips miss items that cost $500-$2,000 per year in invisible fuel waste. Digital DVIR platforms ensure every item is checked systematically — no skipping, no forgetting, and every defect triggers a maintenance workflow.
What technology systems help maintain fuel efficiency consistently?
Technology adoption for fleet fuel management has reached an all-time high of 42%, up from 17% a decade ago. The NACFE found that 14 study fleets operating 75,000 trucks saved $512 million in 2023 compared to national average performance — driven overwhelmingly by technology-enabled discipline. The key insight: technology doesn't just improve fuel economy at deployment; it prevents the slow degradation that erodes gains over time:
Fuel Maintenance Technology Stack
Build the Digital Foundation for Sustained MPG
FleetRabbit connects digital inspections, maintenance scheduling, and defect tracking into a single platform — ensuring the maintenance discipline that protects fuel efficiency never slips through the cracks.
What does a comprehensive fuel maintenance checklist look like?
The most effective fuel efficiency programs aren't built on heroic one-time initiatives — they're built on consistent execution of a structured maintenance cadence. Here's the maintenance checklist organized by frequency that top-performing fleets use to sustain their MPG advantage year after year: