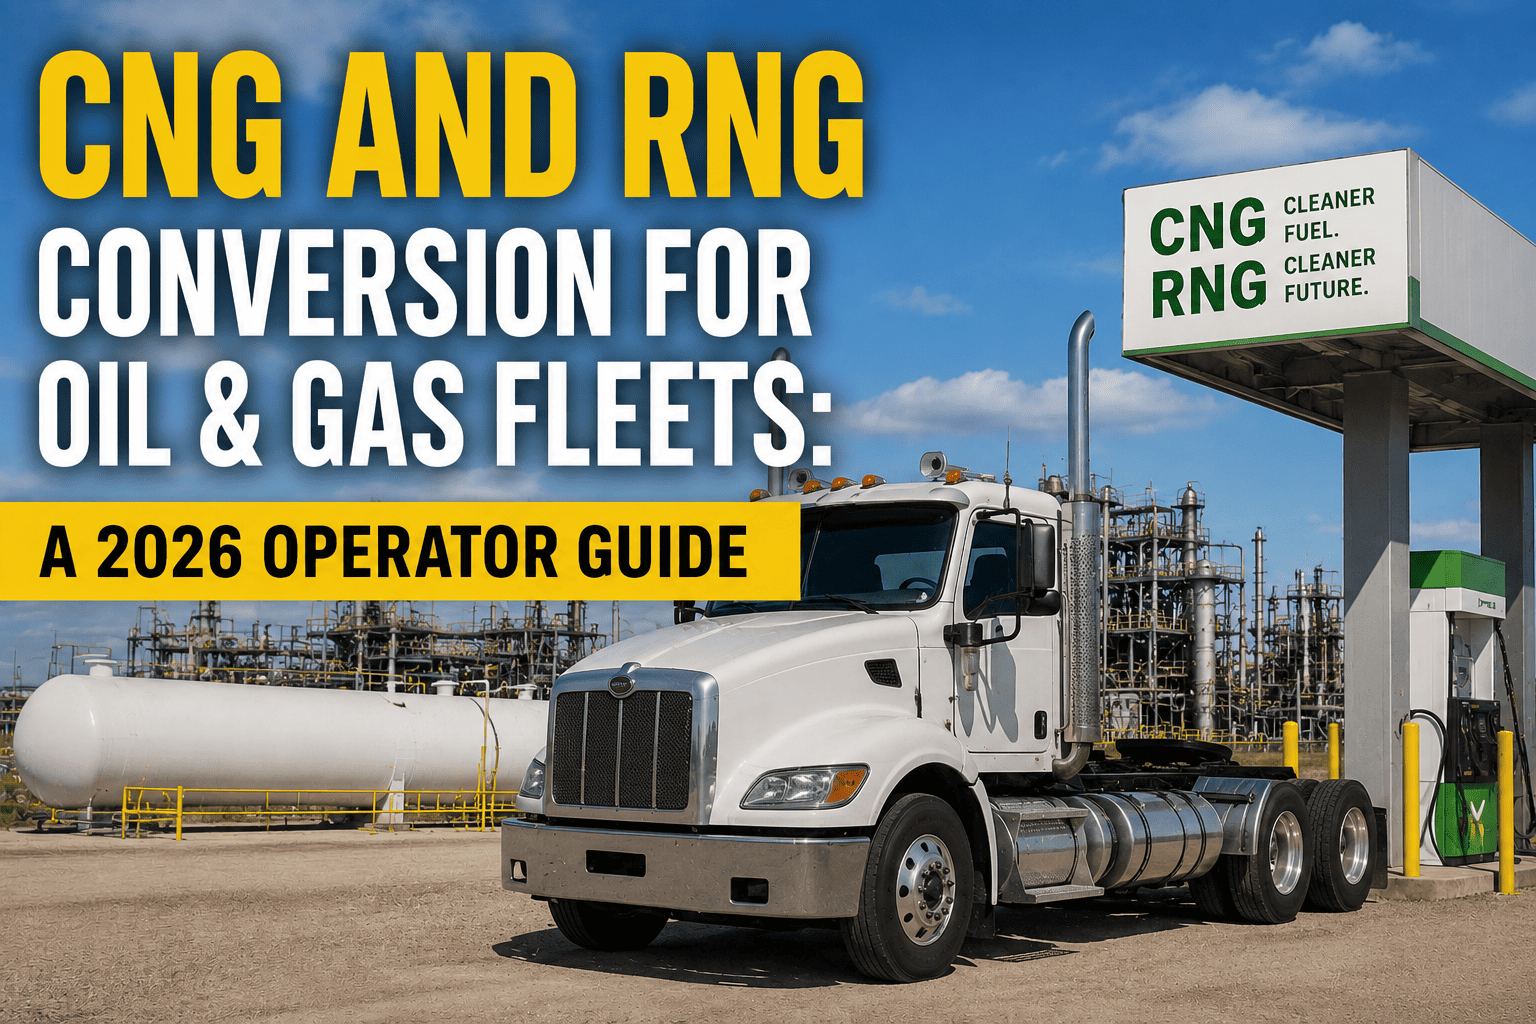
More oilfield operators are running the numbers on natural gas power in 2026, and the math is getting harder to ignore. Diesel prices swing with global crude markets, DEF and DPF systems add ongoing maintenance cost, and emissions reporting requirements keep tightening across basins. Compressed natural gas and renewable natural gas offer a different path: fuel that's historically priced 15 to 50 percent below diesel and gasoline per equivalent gallon, engines that skip DEF and diesel particulate filter maintenance entirely, and for RNG specifically, a documented emissions reduction that can support both compliance goals and public commitments. This guide breaks down what CNG and RNG actually mean for a field fleet's economics and operations in 2026, and where the transition makes sense. Sign up for FleetRabbit to start tracking fuel cost and emissions data across your fleet, or book a demo to model your own conversion economics.
CNG and RNG are chemically the same fuel, delivered through the same tanks and engines, but RNG is captured from organic waste sources rather than extracted from the ground, giving it a substantially lower carbon footprint. CNG typically costs 15 to 50 percent less than diesel or gasoline per equivalent gallon, and heavy-duty natural gas trucks commonly see an 18 to 24 month payback period on the higher upfront vehicle cost through fuel savings alone. Conversion kits for existing vehicles run roughly 6,000 to 12,000 dollars installed, while dedicated OEM natural gas trucks carry a purchase premium that's recovered through fuel and maintenance savings over the vehicle's working life.
CNG and RNG Are the Same Fuel, Different Origin
The distinction between CNG and RNG trips up a lot of fleet managers evaluating the switch for the first time, but it's simpler than it sounds. Both fuels are chemically identical natural gas, compressed and delivered through the same fueling infrastructure and burned in the same engines. The difference is where the gas comes from. Conventional CNG is extracted from underground natural gas reserves, the same source that heats homes and powers grid electricity. RNG is captured from decomposing organic waste, landfills, wastewater treatment plants, and agricultural operations, then processed to pipeline quality. A fleet can often switch between the two, or blend them, without any change to the trucks themselves.
Why RNG Matters for Emissions Reporting
Because RNG is captured from organic waste that would otherwise release methane into the atmosphere as it decomposes, it can carry a documented emissions reduction well beyond simply burning cleaner than diesel at the tailpipe. Fleets participating in renewable fuel standard programs or reporting on decarbonization commitments often find RNG credits provide value beyond the fuel cost savings alone, making it worth understanding separately from conventional CNG even though the vehicles themselves don't change.
FleetRabbit tracks fuel cost per vehicle across your fleet, giving you real usage data to compare against CNG and RNG pricing before you commit to a conversion. Sign up free and start tracking your fuel spend today.
The Real Cost Math Behind a Fleet Conversion
Every conversion decision comes down to comparing upfront cost against ongoing savings. The table below lays out the typical cost components fleet managers weigh, based on current market figures for both aftermarket conversions and dedicated natural gas vehicle purchases.
| Cost Component | Typical Range | Notes |
|---|---|---|
| Aftermarket Conversion Kit | 6,000 to 12,000 dollars installed | EPA-certified systems for converting existing vehicles rather than buying new |
| OEM Natural Gas Premium | 5,000 to 12,000+ dollars over comparable diesel or gasoline models | Higher for heavy-duty trucks, offset by fuel and maintenance savings over vehicle life |
| Annual Fuel Cost Savings | 25,000 to 35,000 dollars per truck (heavy-duty, high mileage) | Scales directly with annual miles driven and fuel burned |
| Eliminated DEF and DPF Costs | Varies by duty cycle and maintenance history | Natural gas engines don't require DEF or diesel particulate filter systems |
| On-Site Fueling Infrastructure | Varies significantly by station size and fleet volume | Return-to-base fleets with on-site fueling can often beat public station pricing through volume agreements |
Fueling Infrastructure Is the Real Decision Point
The fuel cost savings above are only realized if a fleet has practical access to fueling. Return-to-base oilfield operations with consistent routes between a yard and nearby wellsites are strong candidates for on-site fueling infrastructure, where volume purchasing agreements with natural gas utilities can push the per-gallon-equivalent cost below even public CNG station pricing. Fleets running longer, less predictable routes across multiple basins need to map public fueling station coverage carefully before committing, since natural gas infrastructure remains less ubiquitous than diesel in more remote areas.
Matching Duty Cycle to Fuel Type
High-mileage, repeatable routes are where natural gas economics shine brightest, since the fuel savings scale directly with gallons burned. Vehicles with unpredictable, long-haul routes across basins with limited natural gas infrastructure may see a longer payback period or need a hybrid approach, keeping some diesel units in the fleet while converting the highest-mileage, most predictable routes first.
FleetRabbit logs fuel type, consumption, and route data per vehicle, giving you the records needed to support incentive applications and emissions reporting as your fleet transitions. Book a 30-minute demo to see it applied to a mixed diesel and natural gas fleet.
Incentives and Emissions Reporting Fleets Should Know About
Nearly every state offers some combination of grants, tax credits, fuel tax reductions, or reduced registration fees for natural gas vehicles, which meaningfully changes the payback math depending on where a fleet operates. Beyond direct incentives, RNG use can support participation in renewable fuel standard programs, generating additional value on top of the fuel cost savings for fleets that source RNG rather than conventional CNG. Getting the documentation right, tracking which vehicles run which fuel, how much is consumed, and over what routes, is what turns these programs from a theoretical benefit into money the fleet actually captures.
Building a Transition Plan Instead of an All-or-Nothing Switch
Few oilfield fleets convert every vehicle at once, and that's usually the right call. A phased approach starting with the highest-mileage, most route-predictable vehicles captures the strongest economics first while a fleet builds out fueling infrastructure and gains operational experience with natural gas maintenance and driver training. Mixed fleets running both diesel and natural gas vehicles are common for years during a transition, which makes per-vehicle fuel tracking especially important for understanding whether the conversion is delivering the savings the initial analysis projected.
What FleetRabbit Adds During a Fuel Transition
FleetRabbit tracks fuel type, consumption, and cost per vehicle across a mixed fleet, so fleet managers can compare actual natural gas savings against diesel baselines truck by truck rather than relying on industry averages. That same data supports incentive program applications and emissions reporting, turning what's often a manual, spreadsheet-heavy compliance task into something generated automatically from operational data the fleet is already collecting.
Deciding If 2026 Is the Right Year to Convert
The economics behind CNG and RNG conversion have matured well past the early-adopter phase. Fuel cost savings, faster payback periods on high-mileage routes, eliminated DEF and DPF maintenance, and a growing patchwork of state incentives all point toward a stronger business case than oilfield operators saw even a few years ago. The fleets getting the most value aren't converting everything overnight, they're identifying their highest-mileage, most predictable routes, building fueling access to match, and tracking the real numbers against their original projections as they go.
If you're ready to see what the math looks like for your own fleet, sign up for FleetRabbit and start tracking fuel and emissions data today, or book a demo to walk through your specific routes and vehicle mix with our team.
FleetRabbit tracks fuel type, cost, and emissions data per vehicle, giving you the real numbers to plan a CNG or RNG conversion and prove out the savings as you go.







