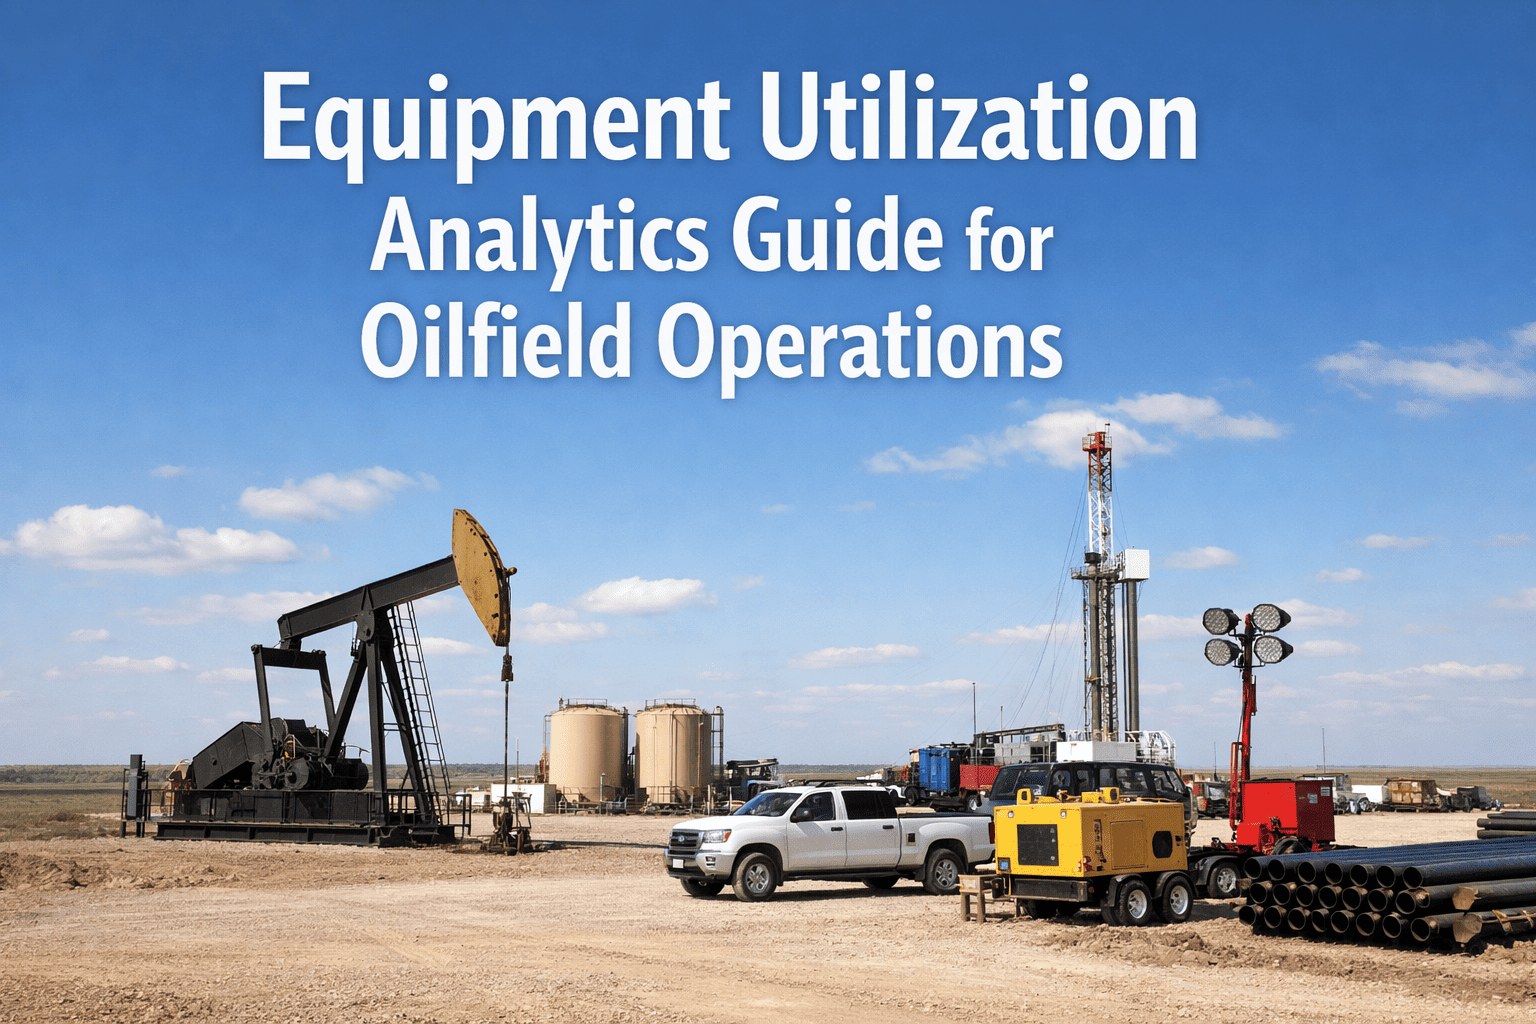
Equipment utilization is the single most critical performance metric for oil and gas fleets, acting as the primary lever for profitability in a capital-intensive industry. A service truck or drilling rig operating at 85–95% safe utilization can generate 2–3 times the ROI of the industry average 50–60% fleet — yet this high-utilization pressure creates rapid degradation cascades when scheduling, maintenance, and condition monitoring fall behind operational demands. Remote sites, extreme weather variability, shifting wellsite priorities, and sudden regulatory changes cause utilization drops faster than traditional dashboards can detect them, often leaving operators reacting to revenue loss rather than preventing it. FleetRabbit’s advanced equipment utilization analytics platform monitors 47 operational, condition, and environmental variables in real time — detecting inefficiency signatures 4–7 days before major downtime events occur. By enabling proactive schedule adjustments, predictive maintenance interventions, and dynamic capacity planning, FleetRabbit protects revenue streams, maximizes asset ROI, and transforms fleet management from a reactive cost center into a strategic profit driver. Book a demo to see how FleetRabbit turns utilization data into daily revenue gains.
Strategic Analytics Guide
Maximizing Equipment Utilization in Oil & Gas: From Reactive Tracking to Predictive Profitability
16 min read
UTILIZATION INTELLIGENCE PLATFORM
Turn Idle Assets into Revenue Generators
FleetRabbit delivers end-to-end utilization intelligence for oilfield operations: real-time efficiency tracking, AI-powered drop prediction, dynamic schedule optimization, and executive-level ROI visibility — all integrated seamlessly with your existing telematics and dispatch infrastructure.
Predictive Drop Detection
Identify utilization declines 4–7 days before they impact revenue using multivariate analysis of idle trends, maintenance risks, and schedule conflicts. Automated alerts enable pre-emptive corrective action.
Dynamic Schedule Optimization
AI-driven recommendations adjust routes, job allocations, and maintenance windows in real-time to restore optimal utilization safely, balancing asset health with operational demand.
ROI Maximization
Calculate safe utilization headroom per asset to accept highest-value contracts without risking equipment health. Quantify revenue impact of every utilization improvement initiative.
Root Cause Analysis
Pinpoint exact causes of utilization loss: driver behavior, mechanical issues, routing inefficiencies, or external factors. Eliminate guesswork with data-backed insights for targeted interventions.
91%
Utilization-Loss Events Prevented
Through early detection and proactive intervention workflows
24%
Average Utilization Increase
Achieved within first 6 months of deployment across diverse fleets
€420K
Annual Value Per Mid-Size Fleet
From recovered productivity, reduced downtime, and optimized asset allocation
4.8 Days
Avg Early Warning Lead Time
From anomaly detection to actionable alert with root cause diagnosis
Executive Insight: The Utilization Imperative
In oil and gas operations, equipment utilization is not just an operational metric — it is the fundamental driver of financial performance. High-value assets like drilling rigs, service trucks, and pipeline vehicles represent massive capital investments that must generate consistent returns to justify their existence. Traditional utilization tracking methods rely on retrospective reporting, revealing problems only after revenue has been lost and assets have been damaged. FleetRabbit transforms this paradigm by providing predictive, real-time intelligence that enables proactive management. By identifying inefficiency patterns days before they manifest as downtime, optimizing schedules dynamically based on actual asset conditions, and calculating safe utilization headroom for strategic contract acceptance, FleetRabbit empowers operators to maximize ROI while protecting asset longevity. This shift from reactive tracking to predictive optimization is essential for maintaining competitiveness in an increasingly cost-conscious and volatile energy market.
Why Equipment Utilization Drops Are Costly in Oilfield Operations
Rapid Demand Fluctuations
New well awards, pipeline projects, or emergency response requirements can spike daily utilization demand by 40–70% within hours. Without real-time visibility into asset availability and condition, operators struggle to reallocate resources efficiently, leading to missed opportunities and overtime costs.
Extreme Remote-Site Variability
Terrain challenges, weather extremes, and regulatory changes dramatically affect fuel consumption, wear rates, and safe operating windows across dispersed assets. Standard utilization metrics fail to account for these contextual factors, leading to inaccurate performance assessments and unsafe pushing of assets beyond limits.
Accelerated Equipment Degradation
High utilization in dusty, high-vibration, and high-load environments causes rapid component wear. By the time output drops noticeably or fault codes trigger, major repairs are already required, resulting in extended downtime and costly emergency interventions that disrupt schedules and erode margins.
Surge Loading from Seasonal Campaigns
Winter drilling peaks, summer pipeline projects, and turnaround seasons create 50–80% demand surges that overwhelm fixed scheduling systems. Without predictive forecasting and flexible capacity planning, operators face widespread utilization shortfalls, contractor reliance, and missed revenue targets during critical periods.
How FleetRabbit Maximises Equipment Utilization — The 6-Stage Intelligence System
01
Asset Characterisation & Capacity Profiling
Every vehicle, rig, and piece of mobile equipment is profiled for real-time utilization potential, current condition index, fuel efficiency baseline, and site-specific capability using integrated telematics, historical performance data, and maintenance records. This creates a dynamic digital twin for each asset, establishing accurate benchmarks for "normal" operation under varying conditions.
Example: Unit ST-472 (Service Truck) | Current Utilization Potential: 92% | Condition Score: 87/100 | Recommended Daily Hours: 11.2 | Safe Headroom: 2.8 hrs | Terrain Factor: 0.95x
↓
02
Early Inefficiency Detection — Multivariate Analytics
AI continuously monitors 47 variables including utilization decline velocity, idle-time accumulation patterns, maintenance-risk trajectory, schedule efficiency ratios, remote-site condition variance, and weather-impact factors. Machine learning models identify multivariate patterns that precede major utilization crashes 4–7 days early, flagging developing problems while they are still minor and easily correctable.
Utilization Health: 74/100
Idle Trend: +2.4 hrs/day — ACCELERATING
Maintenance Risk: HIGH (Transmission Temp)
↓
03
Automated Schedule & Dispatch Optimisation
Real-time recommendations for route adjustments, job reallocation, crew swapping, and maintenance window insertion are generated to restore optimal utilization safely. The system balances asset health constraints with operational urgency, ensuring that efficiency improvements do not compromise safety or accelerate wear. Integration with dispatch platforms allows for seamless implementation of optimized schedules.
↓
04
Predictive Maintenance Integration
Utilization stress data is correlated with component wear models to schedule preventive maintenance before failures occur. By aligning maintenance activities with natural lulls in utilization or low-priority assignments, the system minimizes disruptive downtime and extends asset life. Alerts include specific part recommendations and labor estimates for efficient workshop planning.
↓
05
Surge Demand Forecasting & Preparation
Predictive algorithms analyze historical trends, seasonal patterns, and upcoming project awards to forecast utilization surges 7–14 days ahead. The system recommends pre-positioning assets, adjusting maintenance schedules, and securing temporary resources to absorb increased demand safely. This proactive preparation prevents bottlenecks and ensures capacity is available when high-value opportunities arise.
↓
06
Maximum Safe Utilization & ROI Optimisation
Continuous calculation of safe utilization headroom enables acceptance of the highest-value contracts without risking asset health or safety compliance. Executive dashboards display real-time ROI metrics, projected revenue gains from utilization improvements, and risk-adjusted performance rankings across the fleet. This data-driven approach transforms utilization management from an operational task into a strategic competitive advantage.
Fleet Summary: 91.4% Average Utilization | Projected Monthly Revenue Gain: €184,000 | Risk Level: Low | Asset Health Index: 88/100
Utilization Drop Cascade — What FleetRabbit Detects Early
Day 1-2
Subtle Efficiency Drift
Minor increases in idle time (+5-10%), slight route deviations, or marginal speed reductions. Often dismissed as normal variance. FleetRabbit flags these as early warning signs when combined with other micro-trends.
→
Day 3-4
Pattern Confirmation
Idle trends accelerate, maintenance indicators show elevated stress (temps, vibrations), and schedule adherence slips. AI confirms a developing issue with 85%+ confidence, triggering initial alerts for investigation.
→
Day 5-6
Operational Impact
Noticeable drop in completed jobs, increased fuel consumption per mile, and driver reports of minor issues. Without intervention, major downtime becomes imminent. FleetRabbit provides specific root cause hypotheses.
→
Day 7+
Revenue Loss & Downtime
Asset fails or requires emergency repair. Utilization drops to 0%. Significant revenue loss, expedited shipping costs for parts, and schedule disruption for dependent operations. FleetRabbit aims to prevent reaching this stage entirely.
Measured Results from Oilfield Deployments
91%
Utilization-Loss Events Prevented
Through proactive intervention based on early warnings
24%
Average Utilization Increase
Within 6 months via optimized scheduling and reduced idle time
€420K
Annual Value Per Mid-Size Fleet
Recovered productivity, reduced downtime, and better asset allocation
4.8 Days
Avg Early Warning Lead Time
From anomaly detection to actionable alert with diagnosis
18%
Fuel Efficiency Gain
Through route optimization and reduced unnecessary idling
95%
Operator Satisfaction
Due to clearer schedules, reduced fire-fighting, and data-backed decisions
FleetRabbit Solutions for Leadership Roles
Fleet Managers
Gain real-time visibility into asset utilization and health, receive automated alerts for developing inefficiencies, and access prescriptive recommendations for schedule adjustments. Reduce manual coordination effort and improve response times to operational changes.
Operations Directors
Leverage portfolio-level utilization analytics to identify systemic bottlenecks, optimize resource allocation across sites, and forecast capacity needs for upcoming projects. Make data-driven decisions on fleet right-sizing and capital investments.
Maintenance Supervisors
Integrate utilization stress data with maintenance schedules to perform preventive care during natural lulls. Reduce emergency repairs, extend component life, and improve workshop planning accuracy with predicted part needs.
Finance Leaders & CFOs
Quantify the financial impact of utilization improvements with precise ROI calculations. Track revenue recovery from prevented downtime and optimized asset deployment. Integrate utilization data into financial forecasting and budgeting processes.
FAQ: Equipment Utilization Analytics
QHow does FleetRabbit calculate safe utilization headroom?
The system combines real-time telematics data (speed, idle, location), historical performance baselines, current maintenance status, component health scores, and environmental factors (terrain, weather) to dynamically calculate the maximum safe operating hours for each asset per day.
QCan it integrate with our existing dispatching and CMMS platforms?
Yes. FleetRabbit offers native integrations with major telematics providers (Geotab, Samsara), dispatch software, and Computerized Maintenance Management Systems (CMMS) commonly used in oil and gas, ensuring seamless data flow and workflow continuity.
QIs it suitable for remote sites with limited or no connectivity?
Absolutely. The mobile app and onboard devices feature full offline capability, storing data locally when connectivity is lost. All records sync automatically once connection is restored, ensuring no data gaps and continuous monitoring even in the most remote locations.
QHow long does it take to see results after deployment?
Most fleets begin seeing early warnings and initial efficiency improvements within the first 2-4 weeks. Significant utilization increases and ROI realization typically occur within 3-6 months as processes are refined and predictive models adapt to specific operational patterns.
Maximise Asset Performance and ROI
FleetRabbit’s equipment utilization analytics platform helps oil and gas operators turn data into higher productivity, lower costs, and stronger returns on every asset. Stop reacting to downtime and start predicting profitability.
Real-Time Analytics
Predictive Alerts
Dynamic Scheduling
24% Higher Utilization
€420K Annual Value
Offline-Capable
Seamless Integration
April 9, 2026
By David
All Posts