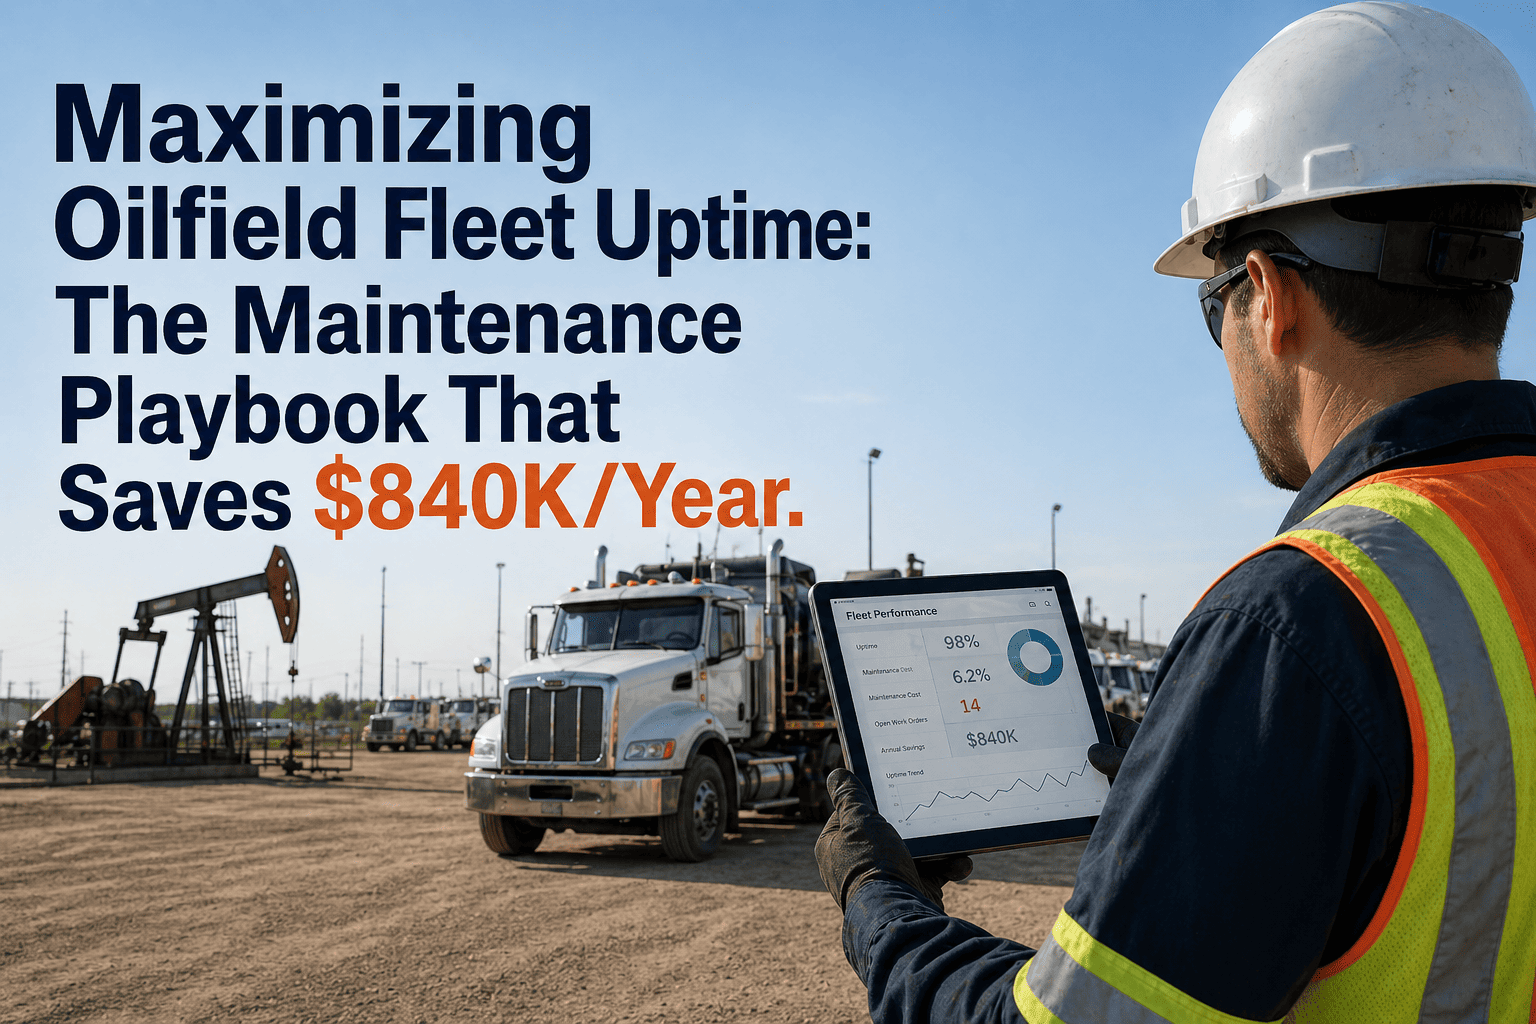
Fleet uptime in oil and gas operations is where operational capacity meets financial performance — and where most oilfield fleet managers discover that vehicle availability is not a function of how many assets you own, but how systematically you prevent, detect, and resolve mechanical failures before they cascade into multi-day downtime events. In 2026, the gap between leading and lagging oilfield fleet operators is not measured in vehicle count or driver headcount — it is measured in uptime percentage, mean time between failures (MTBF), and unplanned downtime cost per vehicle per month. A North American operator managing 180 heavy-duty oilfield vehicles reduced annual downtime-related losses by $840,000 through structured predictive maintenance workflows, automated PM scheduling, real-time fault code monitoring, and data-driven spare parts planning — all deployed through FleetRabbit's maintenance intelligence platform. This uptime maximization playbook delivers the complete framework: fault prediction before failure, PM execution without scheduling drift, parts availability without excess inventory, and maintenance intelligence that transforms reactive repair operations into proactive reliability management. Book a demo to see how FleetRabbit transforms oilfield fleet uptime.
How One Fleet Saved $840K Annually by Systematizing Maintenance Intelligence
Understanding Oilfield Fleet Uptime Economics
Fleet uptime is not a maintenance metric — it is an operational capacity metric with direct revenue impact. Every percentage point of uptime improvement translates to additional billable vehicle-hours, reduced overtime costs for rush repairs, lower emergency parts procurement markups, and decreased client penalty exposure from missed service commitments. Understanding the true cost of downtime requires calculating not just repair expenses, but the cascading operational losses that occur when critical oilfield vehicles are unavailable during peak demand periods.
Direct Downtime Costs
Indirect Revenue Impact
FleetRabbit Uptime Intelligence
FleetRabbit tracks uptime percentage, MTBF, and downtime cost per vehicle across your entire fleet with real-time dashboards that connect maintenance actions to operational availability. Platform calculates downtime economic impact automatically — showing fleet managers and executives the true ROI of preventive maintenance investments versus reactive repair cycles. Uptime intelligence transforms maintenance from a cost center to a performance optimization function.
The $840K annual savings in our case study came from eliminating just 42% of unplanned downtime events. FleetRabbit's predictive maintenance workflows identify failure patterns before they cascade into multi-day breakdowns. Start free trial — deploy uptime intelligence in 5–7 days →
Predictive Maintenance: From Reactive Repair to Failure Prevention
Predictive maintenance in oilfield fleet operations moves beyond calendar-based PM schedules to condition-based intervention — using real-time sensor data, fault code patterns, oil analysis trends, and historical failure signatures to predict component degradation before catastrophic failure occurs. The transition from "fix it when it breaks" to "replace it before it fails" requires structured data collection, pattern recognition algorithms, and maintenance workflow automation that most oilfield operators cannot achieve with spreadsheet-based tracking systems.
Continuous Data Collection from Multiple Sources
FleetRabbit ingests telematics data streams (engine hours, idle time, hard braking events), onboard diagnostic fault codes, driver-reported DVIR defects, oil analysis lab results, and maintenance work order histories into a unified fleet health database. This multi-source data aggregation creates the foundation for predictive analytics that single-point monitoring systems cannot achieve.
Pattern Recognition and Failure Signature Detection
FleetRabbit's maintenance intelligence engine analyzes historical failure data to identify leading indicators — recurring fault code sequences that precede major component failures, oil analysis patterns that predict turbocharger degradation, or brake adjustment frequency that signals imminent caliper replacement. Pattern recognition transforms scattered data points into actionable maintenance intelligence.
Automated Intervention Scheduling Before Failure
When predictive algorithms detect degradation patterns approaching failure thresholds, FleetRabbit automatically generates maintenance work orders with priority classification, recommended repair actions, and parts procurement triggers — scheduling intervention during planned downtime windows rather than reacting to catastrophic failures during peak operational demand.
Verified Impact from Case Study Fleet
The 180-vehicle oilfield operator implemented predictive maintenance workflows for transmission, turbocharger, and brake system failures — the three highest-cost downtime categories. By replacing components based on degradation indicators rather than catastrophic failure, they reduced transmission-related downtime by 67%, turbocharger failures by 54%, and brake system emergencies by 71%. Combined savings: $840K annually with 18% uptime improvement across the fleet.
PM Scheduling Optimization: Eliminating Calendar Drift and Missed Intervals
Preventive maintenance effectiveness in oilfield fleets depends on execution precision — not just having a PM schedule, but ensuring every PM task occurs at the correct mileage/hours interval without delay, deferral, or scheduling drift that creates compliance gaps and accelerated wear. Manual PM tracking systems consistently fail because they rely on field supervisors remembering intervals, dispatchers manually checking due dates, and technicians self-reporting completion — all prone to human error under operational pressure.
Traditional PM Scheduling Failures
FleetRabbit PM Automation
PM Compliance Enforcement
FleetRabbit's PM scheduling engine eliminates the operational pressure that causes PM deferrals. When a vehicle approaches its service interval, the system automatically notifies dispatchers, reserves maintenance bay time, orders required parts, and blocks dispatch assignments once the threshold is exceeded. Fleet managers see real-time PM compliance dashboards showing on-time completion percentage, overdue vehicle counts, and upcoming maintenance capacity requirements — transforming PM execution from reactive scrambling to proactive workflow management.
How FleetRabbit Delivers Measurable Uptime Improvement
From 82.4% to 97.2% average monthly uptime across 180-vehicle oilfield fleet through predictive maintenance and PM automation
Unplanned breakdown frequency decreased from 3.8 events per vehicle per year to 2.2 events through early intervention
Combined savings from reduced emergency repairs, eliminated rush parts procurement, and increased billable vehicle-hours
Real-Time Fault Code Monitoring and Diagnostic Intelligence
Modern oilfield vehicles generate hundreds of diagnostic trouble codes (DTCs) across engine, transmission, brake, and emissions systems — but most fleet operations only discover these codes during catastrophic failure or annual inspections, not in real-time when early intervention could prevent cascading damage. Fault code monitoring transforms onboard diagnostics from post-failure forensics to predictive maintenance intelligence, providing fleet managers with continuous visibility into developing mechanical issues before they cause downtime.
FleetRabbit Fault Code Intelligence Architecture
From vehicle sensor to maintenance action in under 5 minutes
Continuous OBD-II / J1939 Monitoring
Telematics units poll vehicle ECUs every 30 seconds, capturing active and pending fault codes across all vehicle systems without requiring manual scan tool diagnostics
Severity Classification and Alert Routing
FleetRabbit categorizes fault codes as critical (immediate safety risk), monitor (degrading performance), or routine (scheduled attention) and routes alerts to appropriate personnel with urgency-matched notification channels
Diagnostic Guidance and Work Order Creation
System provides fault code interpretation, probable causes, recommended diagnostic procedures, and auto-generates maintenance work orders with parts suggestions — eliminating technician guesswork
Repair Verification and Pattern Tracking
After repair completion, FleetRabbit monitors for fault code reoccurrence, tracks root cause effectiveness, and flags recurring issues requiring engineering investigation or supplier warranty claims
Critical Fault Code Scenarios Prevented Through Real-Time Monitoring
Fuel Rail Pressure Too Low
Left unaddressed → fuel pump failure → $3,500 repair + 4 days downtime
Early detection → fuel filter replacement during planned PM → $180 repair + zero downtime
DEF Quality Below Threshold
Left unaddressed → SCR catalyst damage → $12,000 repair + warranty void
Early detection → DEF tank drain and refill → $220 service + zero component damage
ABS Left Front Wheel Speed Sensor
Left unaddressed → brake system malfunction → safety incident + regulatory violation
Early detection → sensor replacement during scheduled service → $145 repair + compliance maintained
Data-Driven Spare Parts Planning: Availability Without Excess Inventory
Oilfield fleet parts inventory management faces competing pressures — maintain sufficient stock to avoid downtime from parts unavailability, while minimizing capital tied up in slow-moving inventory that deteriorates on shelves. Traditional approaches rely on technician experience and supplier lead times to set reorder points, resulting in either chronic stockouts of critical components or warehouses filled with obsolete parts for vehicles no longer in the fleet. Data-driven parts planning uses actual failure rates, predictive maintenance forecasts, and supplier performance history to optimize inventory investment.
Historical Failure Rate Analysis
FleetRabbit analyzes work order histories to calculate failure frequency for every component across your fleet — revealing which parts require on-hand inventory versus which can be ordered on-demand based on actual consumption patterns rather than guesswork.
Predictive Demand Forecasting
Using predictive maintenance algorithms, FleetRabbit forecasts upcoming parts requirements 30/60/90 days in advance — enabling bulk purchasing during supplier promotions and avoiding emergency procurement at premium pricing when components reach end-of-life simultaneously across multiple vehicles.
Supplier Performance Integration
FleetRabbit tracks supplier lead times, backorder frequency, and delivered-versus-promised performance — automatically adjusting reorder points and safety stock levels based on actual vendor reliability rather than catalog claims, preventing downtime from supplier fulfillment failures.
Parts Availability Optimization Results
The case study fleet reduced parts-related downtime delays by 63% while simultaneously decreasing inventory carrying costs by 28%. FleetRabbit's parts planning module identified that 82% of downtime delays originated from just 14 critical component categories — enabling targeted safety stock increases for high-impact parts while eliminating slow-moving inventory in 37 low-failure categories. This dual optimization delivered faster repairs with lower capital investment.
Every strategy in this uptime playbook deploys as an automated workflow in FleetRabbit — predictive analytics, PM scheduling, fault monitoring, and parts planning working together to maximize fleet availability. Stop managing maintenance reactively. Start managing it intelligently. Start free trial — deploy in 5–7 days →
FleetRabbit Uptime Intelligence Implementation Roadmap
Deploying maintenance intelligence across an operating oilfield fleet requires structured implementation that balances immediate quick-win results with long-term predictive capability development. This phased approach delivers measurable uptime improvements within the first 30 days while building the data foundation for advanced predictive analytics over the following 90–180 days.
Phase 01: Foundation Deployment
Phase 02: Operational Integration
Phase 03: Predictive Analytics Activation
Phase 04: Continuous Optimization
Verified Uptime Intelligence Results
Frequently Asked Questions
How does FleetRabbit calculate the true cost of downtime for my specific fleet?
FleetRabbit tracks downtime duration, emergency repair costs, parts procurement premiums, and lost billable hours per vehicle — then calculates total economic impact including client penalty exposure and contract renewal risk. Dashboard shows downtime cost per vehicle, per incident category, and per time period with year-over-year trending to measure improvement.
Can FleetRabbit predict failures for older vehicles with limited sensor data?
Yes. For vehicles without advanced telematics, FleetRabbit uses digital DVIR defect patterns, oil analysis trends, work order histories, and mileage-based component lifecycle tracking to predict degradation. Predictive capability improves with connected diagnostics, but works across mixed-age fleets including legacy assets.
How does FleetRabbit handle PM scheduling for vehicles with highly variable utilization?
FleetRabbit uses real-time odometer and engine hours data from telematics to trigger PM based on actual utilization rather than calendar dates. High-use vehicles receive service at correct intervals; low-use vehicles avoid unnecessary maintenance. System adjusts scheduling dynamically as utilization patterns change seasonally.
What happens when a critical fault code is detected on a vehicle in remote operation?
FleetRabbit immediately escalates critical fault codes to fleet managers and maintenance supervisors via SMS, email, or mobile app push notification. System provides fault code interpretation, recommended actions, and can automatically route the vehicle to the nearest service facility while notifying dispatchers to reassign workload.
How long does it take to see measurable uptime improvement after FleetRabbit deployment?
Fleet managers typically observe 8–15% reduction in emergency repair frequency within the first 30 days from automated PM alerts and fault code monitoring. Full predictive maintenance capability delivering 18%+ uptime improvement becomes operational at 90–180 days as the platform accumulates sufficient failure pattern data for advanced analytics.
Does FleetRabbit integrate with existing CMMS or ERP maintenance systems?
Yes. FleetRabbit offers bi-directional API integration with major CMMS platforms (Fleetio, Fiix, UpKeep) and ERP systems (SAP, Oracle, Microsoft Dynamics) — synchronizing work orders, parts consumption, and maintenance histories while preserving data continuity across systems without manual duplicate entry.
Transform Reactive Maintenance Into Predictive Performance Optimization
FleetRabbit delivers the complete uptime intelligence platform — predictive maintenance analytics, automated PM scheduling, real-time fault monitoring, and data-driven parts planning — configured to your fleet, deployed in 5–7 days, delivering measurable uptime improvement within 30 days.







