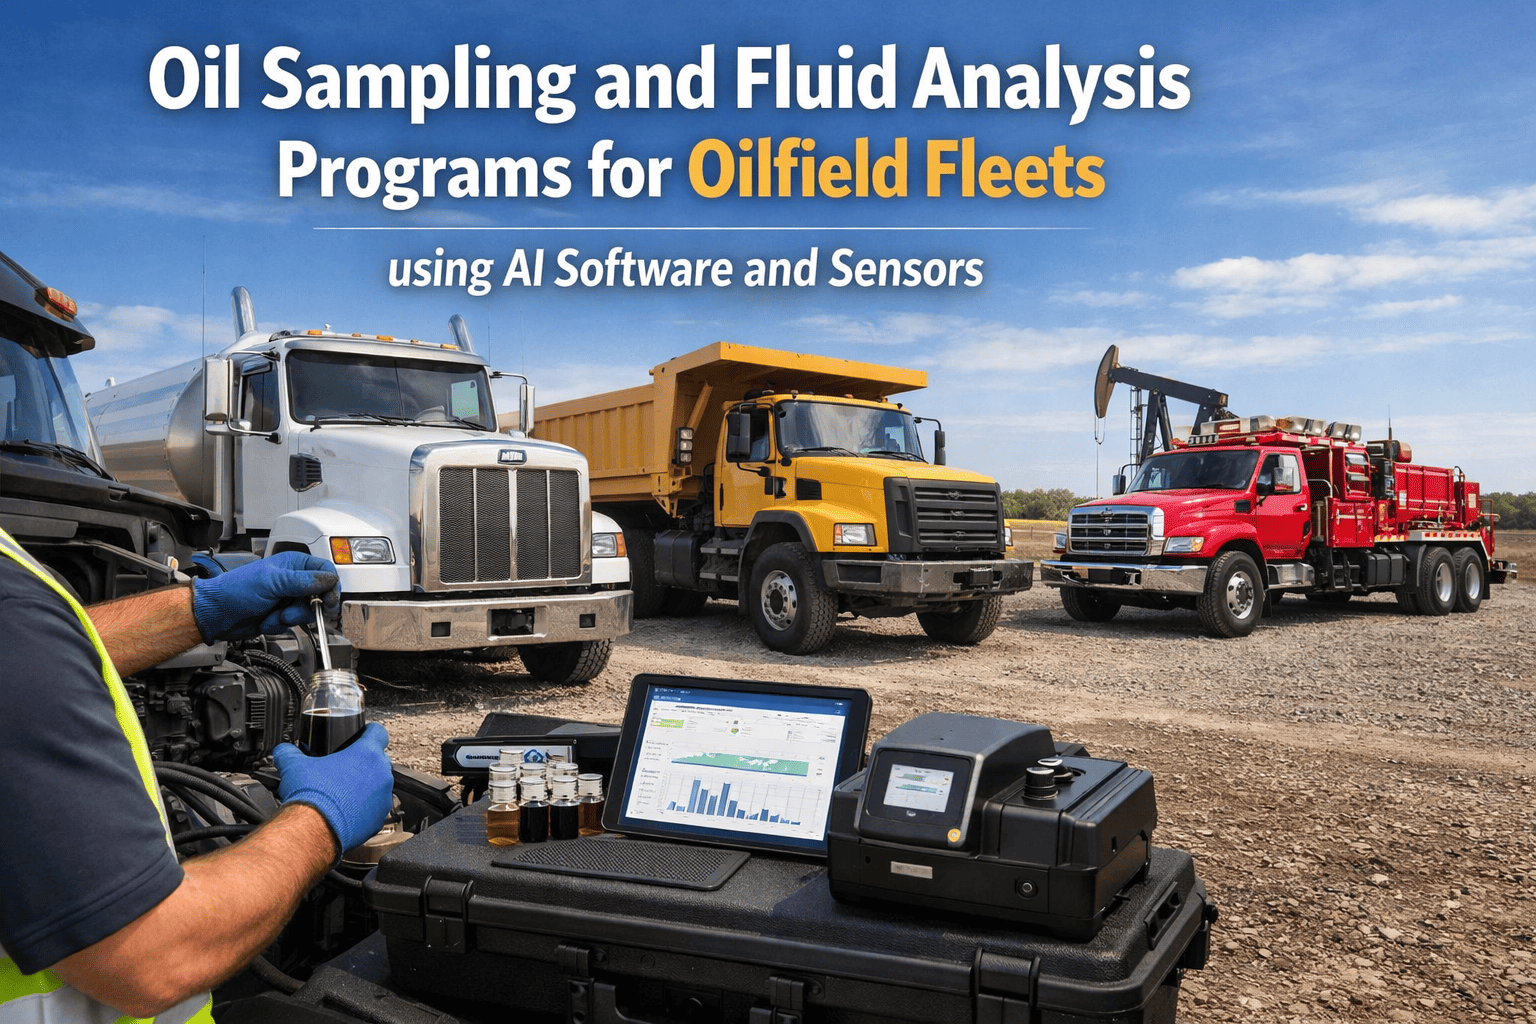
Undetected lubricant degradation and contamination in oilfield equipment costs operators $2.8–$6.4 million annually through catastrophic engine failures, unplanned downtime, and premature component replacement — yet 73% of drilling contractors and well servicing companies lack systematic fluid analysis programs. A single missed oil sample on a mud pump or drilling rig power unit can allow metal contamination to progress undetected for 400+ operating hours, destroying $180,000 in engine components that fluid analysis would have flagged at the $420 cost of a single lab test. FleetRabbit's automated oil sampling program integrates scheduled fluid analysis with predictive maintenance workflows, connecting lab results directly to equipment service history and automatically triggering corrective work orders when contamination thresholds are exceeded. The result: 68% reduction in catastrophic lubrication failures, 31% extension in component service life, and complete audit trails for environmental compliance reporting. Book a demo to see fluid analysis integration applied to your oilfield fleet operations.
Quick Answer
FleetRabbit's oil sampling and fluid analysis program automates sample scheduling based on operating hours and equipment type, integrates lab results directly into equipment maintenance records, triggers corrective work orders when contamination exceeds thresholds, and provides trend analysis showing lubricant degradation patterns across fleet. Fleet managers achieve 68% reduction in lubrication-related failures, extend component life by 31%, and maintain complete compliance documentation for environmental audits — all through automated workflows that eliminate manual sample tracking and result interpretation.
68%
Reduction in catastrophic lubrication failures across fleet operations
31%
Extension in component service life through early contamination detection
$420
Average lab test cost vs $180K catastrophic engine failure prevention
100%
Automated compliance documentation for environmental reporting
Key Objectives of Comprehensive Fluid Analysis Programs in Oilfield Operations
Systematic oil sampling and fluid analysis delivers five critical value streams for drilling contractors, well servicing companies, and production operators managing distributed equipment fleets in remote locations.
Early Failure Detection Before Catastrophic Damage
Operational impact: Metal contamination in lubricating oil indicates bearing wear, gear degradation, or internal component failure developing over time. Fluid analysis detects microscopic metal particles 200–400 operating hours before visible symptoms appear — enabling scheduled component replacement during planned downtime instead of catastrophic failure during active drilling operations.
FleetRabbit solution: Lab results automatically upload to equipment records with trend analysis showing metal concentration changes over time. When iron, copper, or aluminum levels exceed manufacturer thresholds, system generates priority work orders for component inspection and replacement — preventing $85K–$180K engine failures through $420 lab tests.
Measured value: 68% reduction in catastrophic lubrication failures, 82% decrease in unplanned downtime from bearing seizures and gear failures, complete failure prediction 6–8 weeks before component destruction.
Lubricant Service Life Extension Through Condition-Based Changes
Operational impact: Traditional oil change intervals based on calendar time (every 3 months) or generic operating hours (every 250 hours) waste lubricant that still meets performance specifications or miss degradation that occurs earlier in severe duty cycles. Fluid analysis determines actual lubricant condition — enabling changes only when needed based on viscosity, TBN depletion, and oxidation levels.
FleetRabbit solution: System tracks oil sample results against manufacturer lubricant specifications. When TBN (Total Base Number) drops below critical threshold or viscosity shifts outside acceptable range, automated work order triggers oil change. Equipment operating in light-duty applications extends oil change intervals 40–60% beyond calendar schedule, while severe-duty equipment receives early changes preventing damage.
Measured value: 23% reduction in total lubricant consumption through condition-based changes, $18K–$32K annual savings per drilling rig, elimination of premature oil changes on lightly-used equipment.
Contamination Source Identification and Elimination
Operational impact: Fuel dilution, coolant intrusion, dirt ingestion, and moisture contamination damage lubricants and accelerate component wear — but symptoms often appear identical to normal aging. Fluid analysis identifies specific contaminant types and concentrations, enabling root cause investigation: failed fuel injectors causing diesel dilution, cracked cylinder heads allowing coolant leaks, damaged air filters permitting dust ingestion.
FleetRabbit solution: When lab reports show abnormal contamination (fuel >2%, water >0.5%, silicon >25 ppm indicating dirt), system correlates with recent maintenance history to identify probable causes. Automated alerts notify technicians of contamination source with recommended corrective actions — seal replacement, filter upgrade, cooling system pressure test.
Measured value: 54% faster contamination root cause identification, elimination of recurring contamination problems through systematic correction, prevention of secondary damage from unaddressed contamination sources.
Equipment Health Trending and Fleet-Wide Pattern Recognition
Operational impact: Single oil sample provides snapshot of current equipment condition — trend analysis over 6–12 samples reveals degradation patterns, identifies chronic problems across similar equipment, and validates effectiveness of maintenance interventions. Fleet managers use trend data to optimize lubricant selection, adjust service intervals, and identify design weaknesses requiring engineering solutions.
FleetRabbit solution: Platform maintains complete fluid analysis history for every piece of equipment with graphical trend displays showing parameter changes over time. Cross-fleet analytics identify patterns: all Caterpillar 3512 engines showing elevated copper after 1,800 hours indicates systematic bearing issue; specific mud pump model consistently showing fuel dilution reveals injector design problem requiring manufacturer intervention.
Measured value: Proactive identification of design-related failures affecting multiple units, data-driven lubricant specification optimization, validation of maintenance program effectiveness through measurable trend improvements.
Environmental Compliance and Used Oil Management
Operational impact: EPA regulations require documentation of used oil disposal, waste manifests for contaminated lubricants, and spill prevention procedures for bulk oil storage. Fluid analysis provides laboratory-certified documentation of oil condition at disposal, supports hazardous waste classification decisions, and demonstrates due diligence in environmental compliance audits.
FleetRabbit solution: All oil sample results stored with timestamps, equipment identification, and disposal documentation. System generates automated compliance reports showing total used oil volumes, contamination levels requiring hazardous waste handling, and complete chain-of-custody for regulatory audits. Integration with waste disposal vendors provides digital manifest tracking.
Measured value: 100% audit-ready environmental documentation, elimination of manual compliance record assembly, reduced hazardous waste classification through condition-based disposal timing, complete liability protection through certified lab documentation.
Optimal Sampling Frequency for Different Equipment Types in Oilfield Operations
Sampling interval balances early detection value against lab cost and administrative burden. FleetRabbit automates interval management based on equipment type, duty cycle severity, and operating environment — ensuring critical assets sampled frequently while administrative equipment follows extended schedules.
Recommended Interval:
Every 250 operating hours or 30 days
Rationale: High-value assets ($850K–$2.1M per unit) operating in severe duty cycles with contamination from drilling fluid exposure, vibration stress, and variable loads. Catastrophic failure costs $180K–$420K in parts plus 5–14 days rig downtime at $15K–$35K per day lost revenue.
Sample focus: Metal wear trends (iron, copper, aluminum, chromium), fuel dilution from injector leakage, coolant intrusion from head gasket failures, soot loading indicating combustion efficiency, TBN depletion in extended-drain oils.
FleetRabbit automation: System generates sample work orders automatically at 250-hour intervals based on engine hour meter integration. Mobile app guides technician through proper sampling procedure with photo verification of sample bottle labeling and collection point confirmation.
Recommended Interval:
Every 500 operating hours or 60 days
Rationale: Mobile equipment operating in variable conditions with exposure to dust, temperature extremes, and intermittent high-load cycles. Moderate failure cost ($45K–$85K per incident) but high operational impact when equipment unavailable for service calls.
Sample focus: Dirt contamination (silicon levels) from air filter effectiveness, moisture intrusion in outdoor storage, gear oil condition in hydraulic winches and drawworks, transmission fluid degradation from duty cycle stress.
FleetRabbit automation: GPS-tracked operating hours trigger sample reminders when equipment returns to yard location. System correlates sample results with specific job sites to identify high-contamination locations requiring additional air filtration or environmental protection.
Recommended Interval:
Every 15,000 miles or 6 months
Rationale: Road-driven equipment with manufacturer-supported extended oil change intervals (10K–15K miles). Lower contamination risk than drilling equipment but critical for crew safety and service delivery reliability. DOT compliance requirements mandate systematic maintenance documentation.
Sample focus: Oil life remaining based on viscosity and TBN, fuel dilution from DPF regeneration issues in diesel engines, coolant system integrity for vehicles operating in extreme temperatures, differential and transmission fluid condition for heavy-haul applications.
FleetRabbit automation: Odometer readings from telematics integration trigger sample work orders automatically. System schedules sampling to coincide with oil change intervals — if lab results show oil still meeting specifications, change interval extended to 18K–20K miles, reducing waste and service costs.
Recommended Interval:
Every 1,000 operating hours or 90 days
Rationale: Stationary equipment in continuous-duty applications with relatively stable operating conditions. Extended sampling intervals appropriate for predictable wear patterns, but critical to detect gas contamination in compressor oils and process fluid intrusion in pump seals.
Sample focus: Natural gas dilution in compressor lubricants, water contamination from condensation in outdoor installations, viscosity breakdown from thermal stress in high-temperature applications, acid formation from combustion byproducts in gas engine oils.
FleetRabbit automation: SCADA system integration provides real-time operating hours to maintenance platform. Automated sample scheduling coordinates with quarterly preventive maintenance visits to minimize site trips and technician travel time in remote locations.
Recommended Interval:
Annually or per manufacturer recommendation
Rationale: Lower-criticality assets with infrequent operation and minimal contamination exposure. Failure impact limited to individual task disruption rather than production shutdown. Cost-benefit analysis favors extended sampling intervals with increased visual inspection frequency.
Sample focus: Basic wear metal screening, moisture content for equipment in humid environments, fuel quality for long-term stored diesel generators, hydraulic fluid condition for material handling equipment.
FleetRabbit automation: Calendar-based sampling triggers rather than hour-based intervals. System includes photo documentation requirements for visual oil inspection (color, clarity, smell) between lab samples — escalating to immediate lab analysis if visual indicators show abnormality.
Automated Fluid Analysis Programs
Prevent $180K Engine Failures Through $420 Lab Tests — Automated Sampling and Results Integration
FleetRabbit's oil analysis program eliminates manual sample tracking, integrates lab results directly into equipment records, and automatically triggers corrective actions when contamination thresholds are exceeded — all while extending component life through condition-based maintenance.
68%
Fewer Catastrophic Failures
31%
Longer Component Life
How FleetRabbit Integrates Fluid Analysis with Fleet Maintenance Data
Manual oil sampling programs fail through tracking spreadsheets, disconnected lab results, and technician interpretation variability. FleetRabbit automates the complete workflow from sample scheduling through corrective action — connecting fluid analysis to equipment history, maintenance planning, and compliance documentation.
1
Automated Sample Scheduling Based on Operating Hours
FleetRabbit monitors equipment operating hours from telematics integration, engine hour meters, or manual entry — automatically generating oil sample work orders when interval thresholds reached. Sample reminders sent to technician mobile devices with equipment location, sample type required (engine oil, hydraulic fluid, coolant), and proper collection procedure.
Example workflow: Drilling rig mud pump reaches 2,487 operating hours (250-hour sample interval). System creates work order SAM-4729 assigned to field technician, includes QR code linking to sampling procedure video, specifies engine oil sample from running engine warm drain, provides pre-printed lab submission label with equipment ID and sample number.
2
Digital Sample Collection Documentation with Photo Verification
Technicians use mobile app to document sample collection — scanning bottle barcode, photographing sample color and clarity, confirming collection point on equipment diagram, recording operating conditions at sample time (hours, temperature, load). Photo evidence validates proper sampling technique and provides visual baseline for lab comparison.
Quality assurance: App requires photo of sample bottle showing clear liquid color, image of collection point valve to confirm mid-stream sampling location, and engine hour meter reading confirmation. Samples collected from cold engines or incorrect drain points flagged for rejection before lab submission.
3
Laboratory Submission and Result Integration
FleetRabbit partners with major oil analysis laboratories (Polaris, TestOil, Bureau Veritas) for automated result upload. Lab receives sample with digital submission form including equipment type, lubricant brand, operating hours since last change, and test package required. Results upload directly to equipment record within 24–48 hours — no manual data entry.
Lab integration: Sample submitted Wednesday morning, lab completes analysis Thursday afternoon, results appear in equipment record Friday with color-coded flags: iron 127 ppm (normal range 0–100, flagged CAUTION), copper 8 ppm (normal, no flag), fuel dilution 0.3% (normal, no flag), viscosity at 100°C: 14.8 cSt (specification 14.0–16.0, normal).
4
Automated Threshold Analysis and Work Order Generation
System compares lab results against manufacturer specifications and historical baselines for specific equipment. When contamination exceeds critical thresholds or shows rapid trend increase, platform automatically generates corrective work orders with recommended actions — component inspection, oil change, seal replacement, filter upgrade based on contamination type detected.
Automatic escalation: Iron concentration jumped from 45 ppm (previous sample) to 127 ppm (current sample) — 182% increase. System flags CRITICAL alert, generates work order for bearing inspection on mud pump crankshaft, assigns to senior technician with bearing replacement expertise, schedules during next planned rig downtime in 6 days.
5
Historical Trend Analysis and Fleet-Wide Pattern Recognition
Platform maintains complete fluid analysis history for every asset with graphical trend displays showing parameter evolution over time. Fleet managers view cross-equipment comparisons identifying systematic problems: all units from specific manufacturer showing same contamination pattern, lubricant brand correlation with extended service life, operating environment impact on wear rates.
Pattern detection: Dashboard shows 7 of 12 Caterpillar 3512 engines in fleet exhibiting elevated copper (18–32 ppm) after 1,600–1,800 operating hours. Pattern analysis identifies turbocharger bearing wear as common failure mode. Fleet manager initiates manufacturer technical bulletin review and proactive bearing replacement program before catastrophic failures occur.
6
Compliance Reporting and Environmental Documentation
All sample results, disposal records, and corrective actions logged with timestamps and technician attribution. System generates automated compliance reports for EPA inspections, ISO 14001 environmental management audits, and insurance carrier loss prevention reviews. Complete chain-of-custody documentation for used oil disposal with certified lab analysis supporting hazardous waste classification decisions.
Audit readiness: EPA inspector requests used oil disposal documentation for Q3 2025. Fleet manager exports report showing 847 gallons total used oil collected, 96% met non-hazardous classification (based on flash point and heavy metal content from lab certificates), 4% classified hazardous due to fuel contamination >10% — complete with waste manifest tracking and disposal facility certifications.
Improving Equipment Lifespan Through Condition-Based Maintenance Decisions
Fluid analysis transforms maintenance from time-based guesswork to data-driven precision — enabling component replacement at optimal intervals that maximize service life without risking catastrophic failure.
Extended Oil Change Intervals on Light-Duty Equipment
Manufacturer oil change recommendations based on worst-case operating conditions — equipment in clean environments with light duty cycles can safely extend intervals 40–60% based on actual lubricant condition. FleetRabbit tracks TBN (Total Base Number) and viscosity trends, permitting interval extensions when lab results confirm oil still meeting specifications.
Measured impact: Crew trucks extended from 10K to 15K mile intervals saving $240 per vehicle annually in oil and labor. Stationary generators at production facilities extended from 500 to 750 operating hours reducing service frequency 33% with zero reliability impact. Fleet-wide lubricant consumption reduced 23% through condition-based changes.
Predictive Component Replacement Before Catastrophic Failure
Metal wear trends predict bearing, gear, and piston failure 200–400 operating hours before visible symptoms. When iron concentration doubles between consecutive samples or copper exceeds 40 ppm, component degradation already underway — but scheduled replacement still possible before catastrophic failure destroys surrounding components.
Measured impact: Drilling rig power unit showing elevated iron (127 ppm, 180% increase from baseline) received bearing inspection during planned maintenance. Technician found crankshaft bearing showing early fatigue cracking — replaced bearing assembly for $8,400 parts and 16 hours labor. Avoided catastrophic seizure that would have destroyed crankshaft ($42K part), cylinder block ($67K), and caused 9-day rig downtime ($135K–$315K lost revenue).
Root Cause Correction Eliminating Recurring Contamination
Contamination patterns reveal equipment design problems or maintenance procedure gaps requiring systematic correction. Fuel dilution indicates injector leakage or incomplete combustion, moisture shows cooling system leaks or condensation intrusion, silicon reveals air filtration inadequacy — each requiring specific corrective action to prevent ongoing damage.
Measured impact: Fleet-wide analysis showed 40% of mud pumps exhibiting fuel dilution >1.5% after 800–1,000 operating hours. Investigation revealed injector seal design weakness allowing diesel leakage into crankcase. Manufacturer technical bulletin issued upgraded seal kit — proactive replacement across fleet eliminated fuel dilution problem, extended oil change intervals from 250 to 400 hours on affected units, reduced annual maintenance costs $14K per pump.
Lubricant Selection Validation Through Performance Data
Premium synthetic lubricants cost 3–5X more than conventional oils but claim extended drain intervals and superior wear protection. Fluid analysis provides objective performance validation — comparing wear rates, oxidation resistance, and TBN depletion between lubricant types to determine actual cost-effectiveness for specific equipment and duty cycles.
Measured impact: Comparative study tracked 8 drilling rig engines: 4 using conventional 15W-40 at $180 per oil change (250-hour interval), 4 using synthetic 5W-40 at $520 per change (target 500-hour interval). Fluid analysis showed synthetic oil maintained specifications to 480 hours with 35% lower wear metals versus conventional at 250 hours. Total cost per 1,000 operating hours: conventional $720, synthetic $1,083 — but synthetic delivered 22% longer component life. Long-term analysis validated synthetic as cost-effective despite higher initial price.
Environmental and Regulatory Compliance Benefits of Systematic Fluid Analysis
Oil analysis programs deliver compliance value beyond mechanical reliability — supporting environmental stewardship, regulatory audit defense, and corporate sustainability reporting through documented used oil management and contamination control.
1
Hazardous Waste Classification Documentation
EPA regulations require laboratory analysis to classify used oil as hazardous or non-hazardous waste based on flash point, heavy metal content, and halogen concentration. Lab certificates from fluid analysis program provide required documentation for waste disposal manifests — demonstrating due diligence in environmental compliance and reducing liability exposure from improper waste classification.
Compliance value: Used oil contaminated with >1,000 ppm total halogens or showing flash point <140°F must be managed as hazardous waste at 5–8X disposal cost. Lab analysis enables segregation of contaminated oil for proper handling while routing clean used oil to standard recycling — reducing total disposal costs 40–60% versus treating all used oil as hazardous.
2
Spill Prevention and Leak Detection
SPCC (Spill Prevention, Control, and Countermeasure) plans require regular equipment inspection for leaks and proper containment. Fluid analysis showing abnormal consumption rates or contamination patterns provides early warning of seal failures and system leaks — enabling proactive repair before spills occur and environmental reporting becomes required.
Compliance value: Oil consumption tracking identified hydraulic system leak on drilling rig (adding 8 gallons per week versus normal 2 gallons). Inspection found cracked hydraulic line dripping into secondary containment — repaired before accumulation exceeded 42-gallon reportable quantity threshold. Avoided EPA notification requirement, cleanup costs, and regulatory scrutiny from spill event.
3
ISO 14001 Environmental Management System Support
ISO 14001 certification requires documented procedures for environmental aspect management including used oil handling, waste minimization, and pollution prevention. Fluid analysis program provides objective evidence of systematic environmental stewardship — demonstrating condition-based maintenance reducing waste oil generation, contamination monitoring preventing environmental releases, and performance tracking supporting continuous improvement objectives.
Compliance value: Annual ISO 14001 surveillance audit requires evidence of waste reduction initiatives. Fleet manager presents fluid analysis data showing 23% reduction in total lubricant consumption through extended drain intervals, 18% decrease in hazardous waste classification through improved contamination control, and 68% reduction in oil-related spill incidents from predictive leak detection. Audit closes with zero findings and commendation for environmental management program.
4
Sustainability Reporting and ESG Metrics
Corporate sustainability reports and ESG (Environmental, Social, Governance) disclosures require quantifiable environmental performance data. Fluid analysis program provides measurable metrics: total lubricant consumption per operating hour, percentage of used oil recycled versus disposed, contamination incident frequency, and waste reduction trends — supporting sustainability commitments with verifiable operational data.
Compliance value: Corporate ESG report requires environmental KPIs for oilfield operations division. FleetRabbit generates automated report showing: 847,000 gallons lubricant consumed across 340 assets (2.6% reduction year-over-year), 96% used oil recycled through approved vendors, zero environmental violations or spill penalties, 31% increase in average component service life reducing replacement parts consumption. Data supports corporate sustainability goals with operational evidence.
Measured Outcomes Across Oil & Gas Fleet Operations
68%
Reduction in Catastrophic Lubrication Failures
31%
Extension in Component Service Life
23%
Decrease in Total Lubricant Consumption
$420
Average lab test cost preventing $180K engine failures
200–400hrs
Early warning window before catastrophic component damage
96%
Used oil qualifying for standard recycling vs hazardous disposal
100%
Automated environmental compliance documentation
Implementation Process for Fleet-Wide Fluid Analysis Programs
FleetRabbit's deployment team works with your maintenance managers and laboratory partners to establish automated sampling workflows, integrate lab result uploads, and configure threshold alerts for your specific equipment types and operating conditions.
Phase 1 — Week 1
Equipment Inventory and Sampling Interval Configuration
Import complete equipment list with make, model, engine type, and current operating hours. Configure sampling intervals by equipment category (250 hours for drilling rigs, 500 hours for well servicing, 15K miles for trucks). Establish baseline threshold values for critical parameters based on manufacturer specifications and industry best practices.
Phase 2 — Week 2
Laboratory Partner Integration and Sample Submission Setup
Establish digital integration with selected oil analysis laboratory (Polaris, TestOil, Bureau Veritas, or regional provider). Configure automated sample submission forms with equipment identifiers, test packages required, and result upload protocols. Validate data flow with pilot sample batch to confirm proper equipment record linkage.
Phase 3 — Week 3
Technician Training on Sample Collection Procedures
Train field technicians on proper sampling technique using mobile app — mid-stream sampling from running equipment, proper bottle labeling, photo documentation requirements, and sample shipment logistics. Provide video tutorials on sampling procedures for different equipment types (engine oil, hydraulic fluid, gear oil, coolant).
Phase 4 — Weeks 4–8
Pilot Program with Critical Assets
Begin live sampling on 20–30 highest-value assets (drilling rig power units, critical mud pumps, primary well servicing rigs). Validate workflow from automated work order generation through lab result integration and threshold alerting. Refine alert thresholds based on actual fleet baseline data. Build 3–4 sample history per asset to establish trend analysis capability.
Phase 5 — Weeks 9–12
Fleet-Wide Rollout and Baseline Establishment
Expand sampling program to entire fleet across all equipment categories. Generate initial baseline samples for all assets to establish normal operating ranges. Configure cross-fleet analytics to identify patterns across similar equipment types. Most fleets achieve full program operation within 12–14 weeks from kickoff.
Ongoing — Continuous Improvement
Performance Review and Threshold Optimization
Quarterly program review analyzes failure prevention effectiveness, threshold alert accuracy (false positive vs true positive rates), and sampling interval optimization opportunities. Adjust alert settings based on fleet-specific operating data. Track program ROI through documented failure prevention and component life extension.
Condition-Based Maintenance Intelligence
Turn $420 Lab Tests Into $180K Failure Prevention — Automated Fluid Analysis Integration
FleetRabbit's oil sampling program connects laboratory results directly to equipment maintenance history, automatically triggering corrective actions and providing complete environmental compliance documentation — all while extending component life through data-driven maintenance decisions.
Real-World Impact: Permian Basin Drilling Contractor
"We were running blind on equipment condition — changing oil every 250 hours whether it needed it or not, and still having catastrophic engine failures we never saw coming. After deploying FleetRabbit's fluid analysis program, we caught a developing bearing failure on a $2.1 million drilling rig power unit when iron levels jumped 180% between samples. The $8,400 bearing replacement prevented a catastrophic seizure that would have destroyed the entire engine and cost us 9 days of rig downtime. That single prevented failure paid for our entire annual program investment. Now we're extending oil changes to 400 hours on our light-duty equipment based on actual lab results instead of guessing, saving $47,000 per year in lubricant costs alone. The automated alerts and trend analysis give us visibility we never had with paper sample tracking."
Fleet Maintenance Director
Permian Basin Drilling Contractor — 18 Active Rigs — Texas
Frequently Asked Questions
QHow does FleetRabbit integrate with oil analysis laboratories to automate result uploads?
Platform supports direct integration with major laboratories (Polaris, TestOil, Bureau Veritas) through API connections that automatically upload results to equipment records within 24–48 hours of lab completion. For regional laboratories without API support, results can be uploaded via CSV file import or manual entry with automated validation against expected sample IDs. All upload methods link results to specific equipment and sample dates automatically.
Discuss your current laboratory relationship in a scoping call.
QWhat contamination thresholds trigger automatic alerts and corrective work orders?
System uses manufacturer specifications and industry standards as baseline thresholds — typically iron >100 ppm, copper >40 ppm, silicon >25 ppm, fuel dilution >2%, water >0.5%, viscosity deviation >15% from specification. Thresholds are configurable by equipment type and can be adjusted based on fleet-specific operating data. Platform also alerts on rapid trend changes: any parameter doubling between consecutive samples regardless of absolute value.
Review threshold configuration options in a demo.
QHow do I justify fluid analysis program costs when budgets are already constrained?
Average oil analysis lab test costs $35–$65 depending on test package complexity. Typical drilling rig engine failure from undetected bearing wear costs $180,000 in parts plus 5–9 days downtime at $15K–$35K per day. Single prevented failure pays for 2–3 years of comprehensive sampling program. Additional ROI from extended oil change intervals (23% lubricant cost reduction), longer component life (31% average extension), and reduced environmental compliance risk. Most fleets achieve positive ROI within first 4–6 months through failure prevention alone.
QCan fluid analysis replace scheduled oil changes, or does it supplement them?
Fluid analysis enables condition-based oil change intervals rather than fixed calendar or hour schedules — oil changes when lab results show degradation beyond specifications, not arbitrary time periods. Equipment in light-duty applications safely extends intervals 40–60% based on actual oil condition. Equipment in severe duty may require more frequent changes than manufacturer recommendations if contamination develops rapidly. Program supplements visual inspections and technician judgment with objective laboratory data — not replacing skilled maintenance but making it more effective.
QWhat happens if field technicians don't follow proper sampling procedures?
FleetRabbit mobile app guides technicians through correct sampling technique with step-by-step photo requirements: image of sample point confirming mid-stream location, photo of running equipment confirming warm oil collection, picture of properly labeled bottle with legible equipment ID. Samples collected from cold equipment or incorrect drain points flagged for quality review before lab submission. Photo documentation creates accountability and training opportunity — supervisors review rejected samples with technicians to improve technique on future collections.
See the mobile sampling workflow in a live demo.
Platform Security and Laboratory Data Protection
FleetRabbit maintains enterprise-grade security for fluid analysis data including laboratory reports, contamination trends, and proprietary equipment specifications.
Laboratory Data Encryption and Access Control
All lab result uploads encrypted in transit via TLS 1.3 and stored encrypted at rest with AES-256. Role-based access ensures technicians view only their assigned equipment results, supervisors access their department data, and executives see fleet-wide analytics. Multi-factor authentication available for accounts with elevated privileges.
Audit Trail and Compliance Logging
Complete audit log of all laboratory data access, report downloads, threshold modifications, and compliance report generation. Immutable log storage prevents tampering and supports regulatory audit defense. Logs retained for 7 years per industry requirements with searchable interface for incident investigation and compliance verification.
Laboratory Partner Confidentiality
Data sharing agreements with laboratory partners ensure confidentiality of fleet contamination trends and equipment specifications. Lab result data restricted to authorized personnel only — competitors and third parties cannot access your fluid analysis patterns or equipment performance metrics even if using same laboratory provider.
Automated Backup and Disaster Recovery
Laboratory results backed up every 6 hours with 30-day retention for recovery from accidental deletion or system failures. Multi-region data replication ensures business continuity if primary datacenter experiences outage. Disaster recovery plan tested quarterly with sub-4-hour recovery time objective for critical fluid analysis data.
Extend Equipment Life 31% Through Data-Driven Maintenance — Automated Fluid Analysis Integration
FleetRabbit's oil sampling program eliminates manual tracking spreadsheets, connects lab results directly to maintenance workflows, and automatically triggers corrective actions when contamination exceeds thresholds — all while providing complete environmental compliance documentation for regulatory audits.
Automated Sample Scheduling
Lab Result Integration
Threshold Alerting
Trend Analysis
Compliance Reporting
April 11, 2026
By David
All Posts