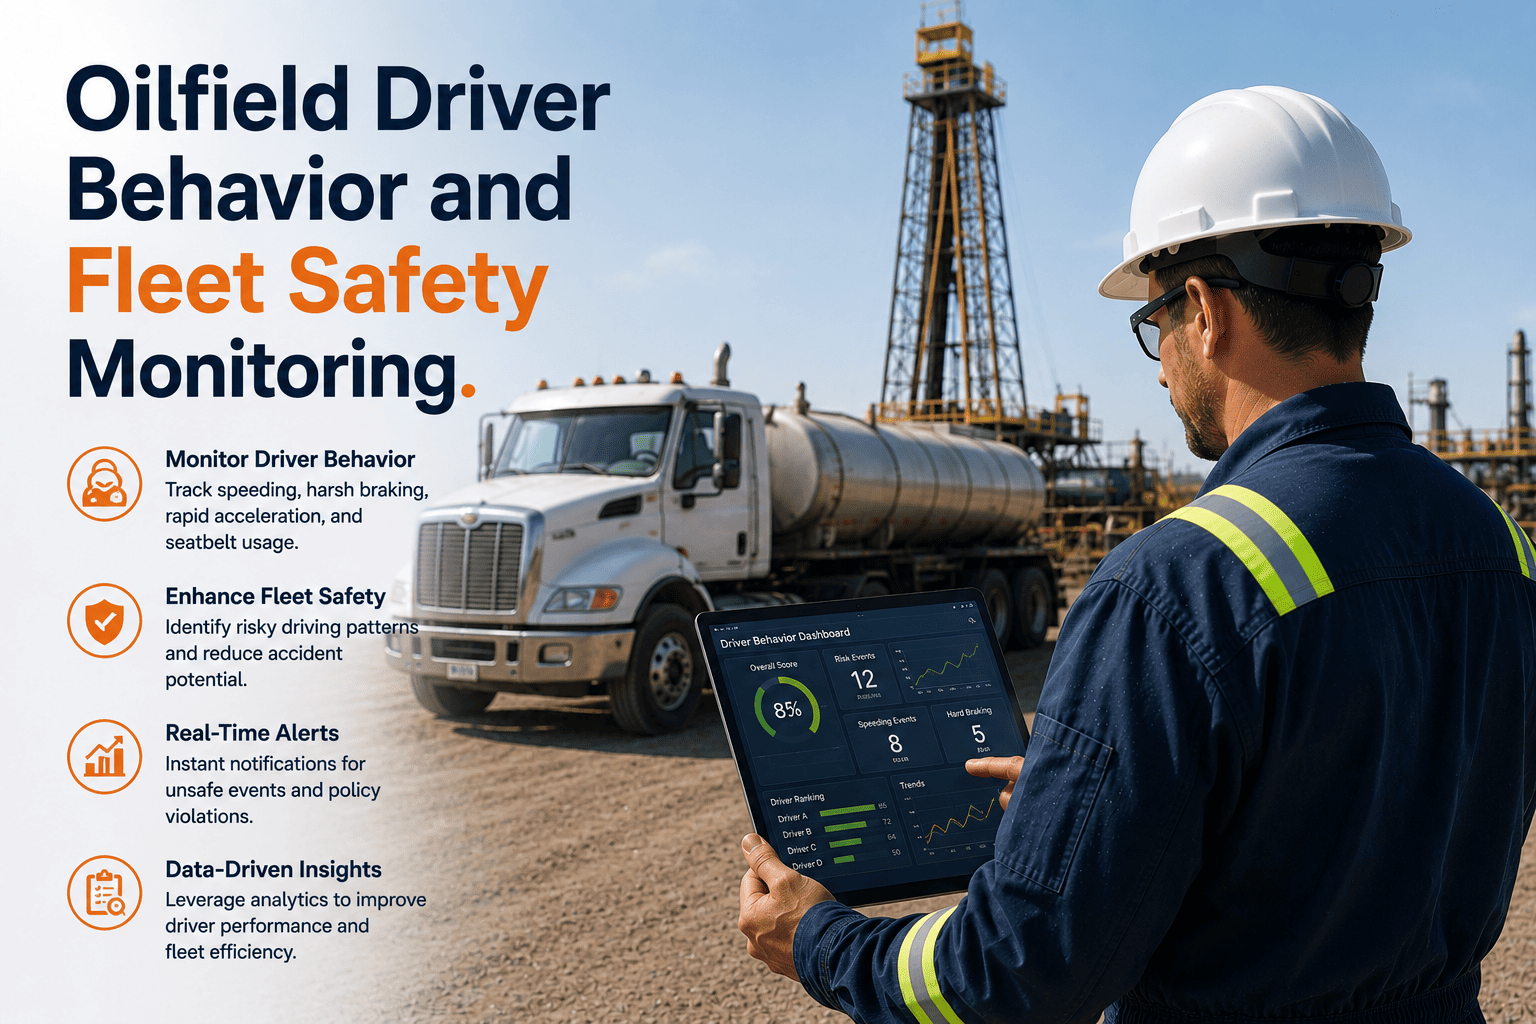
Driver behavior monitoring and fleet safety management represent critical operational priorities for oilfield fleet operations where preventable accidents create cascading consequences including $45,000-$180,000 direct costs per incident covering vehicle repairs and medical expenses, 18-35% insurance premium increases at renewal following adverse claims history, $280,000-$850,000 liability exposure from serious injury claims in high-severity collisions, and immeasurable reputational damage when safety failures result in fatalities or major incidents reported publicly. Traditional safety management relies on reactive approaches responding to accidents after occurrence through incident investigations determining root causes, implementing corrective actions addressing identified deficiencies, and conducting generic safety training reminding drivers of proper procedures — creating improvement cycles measured in months while accidents continue accumulating costs and human suffering throughout intervention lag periods. Reactive safety programs operate without systematic visibility into actual driver behavior patterns occurring daily across dispersed field locations, lack objective performance data needed to identify high-risk drivers requiring targeted coaching intervention before incidents occur, miss developing risky behavior trends that accumulate gradually over weeks building toward eventual accidents, and cannot measure coaching effectiveness or behavior change following safety interventions without quantitative before-and-after performance comparison. Progressive oilfield operators deploy proactive driver behavior monitoring systems transforming safety management from reactive incident response into predictive risk prevention — FleetRabbit's integrated safety platform combines accelerometer-based harsh event detection measuring aggressive acceleration, hard braking, sharp cornering, and speeding occurrences, GPS-timestamped event records providing specific location and time context for coaching discussions, composite driver safety scoring ranking operators from highest to lowest risk enabling targeted intervention priorities, automated coaching workflows generating notifications when drivers exceed harsh event thresholds, and trend analytics identifying gradual behavior degradation before accident occurrence. Eagle Ford operator managing 94-vehicle fleet deployed FleetRabbit safety monitoring achieving documented improvements over 18-month measurement period including 41% harsh driving event reduction through systematic coaching program, 56% decrease in preventable accidents from 18 to 8 annual incidents, $340,000 insurance cost reduction combining premium decrease and claims avoidance, zero DOT-recordable accidents during final 12 months versus 3 annually baseline, and fleet safety score improvement from Red-band 42/100 to Green-band 78/100 enabling client safety prequalification previously unavailable. Schedule consultation to explore driver behavior monitoring and safety improvement capabilities for your fleet operations.
Oilfield Driver Behavior and Fleet Safety Monitoring Systems
Transform reactive accident response into proactive risk prevention through continuous driver behavior monitoring, automated safety scoring, targeted coaching workflows, and predictive analytics. FleetRabbit delivers 41-56% accident reduction and $340,000+ insurance savings for 100-vehicle fleet through systematic behavior improvement programs.
Eight Risky Driving Behaviors Monitored Through FleetRabbit Safety Platform
Harsh Acceleration Events
Rapid throttle application exceeding 8 mph per second threshold indicating aggressive driving style increasing collision risk, fuel consumption, and drivetrain wear. Measured via accelerometer detecting forward g-force spikes with GPS timestamp and location context for coaching.
Hard Braking Incidents
Sudden deceleration exceeding -8 mph per second indicating insufficient following distance, distracted driving, or failure to anticipate traffic conditions. Hard braking events correlate strongly with rear-end collision risk and represent leading accident predictor.
Aggressive Cornering Maneuvers
Sharp turns generating lateral g-force exceeding threshold indicating excessive speed through curves creating rollover risk especially for high-center-of-gravity service trucks and loaded trailers common in oilfield operations. Cornering events identify reckless driving patterns.
Speeding Violations
Velocity exceeding posted speed limits by configurable threshold percentage tracked via GPS comparing actual speed against digital speed limit database. Speeding increases accident severity, citation exposure, and insurance liability while reducing driver reaction time.
Excessive Idle Time
Engine operation while stationary exceeding reasonable thresholds indicating wasteful fuel consumption, unnecessary engine wear, and potential distraction during extended personal phone use or other non-driving activities while vehicle running.
After-Hours Unauthorized Operation
Vehicle movement outside scheduled work hours indicating personal usage creating unauthorized insurance exposure, unreported mileage accumulation, and potential moonlighting activities using company assets without authorization or proper coverage.
Seatbelt Non-Compliance
Vehicle operation without seatbelt fastened detected through monitoring systems in equipped vehicles representing FMCSA violation exposure plus severe injury risk during collisions. Seatbelt usage correlates directly with survivability in serious accidents.
Hours of Service Fatigue Risk
Extended consecutive driving hours approaching or exceeding regulatory limits creating fatigue-related accident risk. Automated tracking ensures compliance while identifying drivers operating near limits requiring rest periods before continuing service delivery.
Comprehensive behavior monitoring across eight critical risk categories enables fleet managers to identify coaching priorities before risky patterns culminate in preventable accidents. FleetRabbit tracks all behaviors through unified platform with automated alerts. Schedule demo to review behavior monitoring capabilities with your safety requirements.
Five-Stage Driver Coaching Methodology Delivering Sustained Behavior Improvement
Baseline Performance Measurement
Initial 30-day observation period establishing individual driver behavior baselines across all monitored metrics without intervention or coaching. Baseline data identifies natural performance distribution across fleet enabling identification of high-performers for recognition, middle-performers for moderate coaching, and high-risk drivers requiring intensive intervention programs.
Data-Driven Coaching Conversations
One-on-one coaching sessions with Red-band high-risk drivers reviewing specific GPS-timestamped harsh events including date, time, location, and severity. Objective data eliminates defensive responses common with generic safety lectures enabling constructive discussions focused on actual behavior patterns versus subjective supervisor impressions.
Automated Feedback and Awareness
Real-time driver mobile app notifications providing immediate feedback when harsh events occur creating behavioral awareness at moment of occurrence when learning most effective. Weekly performance summaries showing improvement trends maintaining focus on safety goals versus single coaching conversation followed by attention drift.
Progressive Consequence Framework
Escalating accountability measures for drivers failing to improve following initial coaching including formal written warnings documenting continued unsafe operation, temporary vehicle assignment restrictions limiting high-risk drivers to controlled environments, and potential termination for persistent safety violations creating unacceptable liability exposure.
Recognition and Incentive Programs
Positive reinforcement recognizing safe driving performance through monthly safety awards, public recognition at safety meetings, and financial incentives or bonuses for drivers maintaining Green-band scores. Recognition programs create cultural emphasis on safety excellence versus punitive focus on violations alone.
94-Vehicle Eagle Ford Fleet: 56% Accident Reduction Through Behavior Monitoring
Systematic driver behavior monitoring and coaching programs deliver measurable accident reduction within first 6 months with sustained improvement through continuous feedback and accountability frameworks. FleetRabbit provides complete safety management platform. Start free trial — safety monitoring deployment completes within 48 hours.
Driver Safety Monitoring Benefits for Operations Leadership
Deploy Comprehensive Driver Safety Monitoring Platform Preventing Accidents Through Behavior Analytics
FleetRabbit provides complete driver behavior monitoring platform tracking eight critical risk categories including harsh acceleration, hard braking, aggressive cornering, speeding, excessive idle, unauthorized operation, seatbelt compliance, and hours of service fatigue — generating composite safety scores enabling targeted coaching intervention on high-risk drivers before accidents occur achieving documented 41-56% preventable accident reduction, 15-25% insurance cost decrease, and $280,000-$580,000 annual value for 100-vehicle fleet through systematic behavior improvement at $3 per vehicle monthly investment.







