Oilfield drilling rigs and heavy service equipment generate distinctive vibration signatures that reveal bearing wear, shaft misalignment, gear tooth degradation, and hydraulic pump cavitation weeks before catastrophic failure — yet 78% of oilfield operators rely solely on scheduled maintenance intervals with zero real-time condition monitoring, resulting in $2.4 million average annual losses from preventable equipment breakdowns. When a major drilling contractor's Rig-9 top drive bearing began showing abnormal vibration patterns, traditional inspection schedules would have missed the developing failure for another 340 operating hours — by which time the bearing would have seized during a critical production phase, causing $180,000 in emergency repairs and 96 hours of downtime. Vibration monitoring systems detect these early warning signals through accelerometer sensors that measure frequency, amplitude, and harmonic patterns in rotating equipment, enabling predictive intervention at a fraction of emergency repair costs. This comprehensive guide delivers the technical framework for deploying vibration monitoring across oilfield operations: sensor placement strategies for drilling rigs and service vehicles, frequency spectrum analysis for fault pattern recognition, automated alert thresholds that trigger maintenance before failure occurs, and the integration architecture that transforms raw vibration data into actionable maintenance decisions. Book a demo to see FleetRabbit's vibration monitoring platform in action.
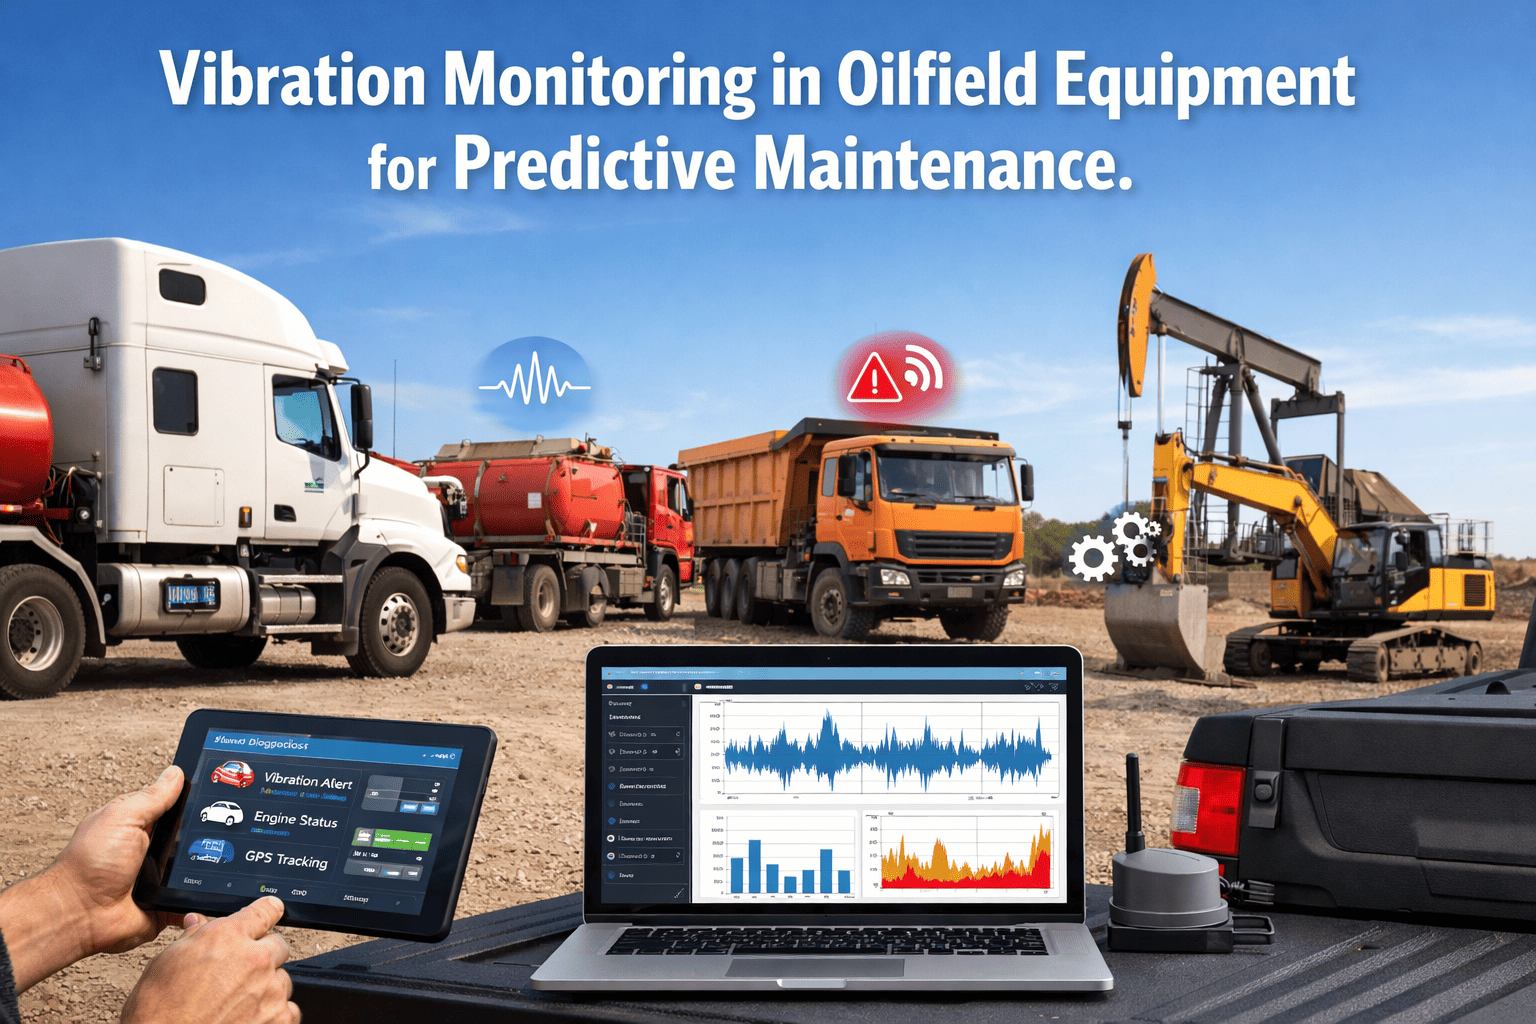
Vibration Monitoring in Oilfield Equipment for Predictive Maintenance
Best Practices Guide
|
Predictive Maintenance
How accelerometer sensors, frequency spectrum analysis, and automated alert systems detect bearing wear, misalignment, and mechanical faults 3–8 weeks before catastrophic failure in drilling rigs and service vehicles
Early Detection Window
3–8 weeks
Average advance warning before catastrophic failure through vibration trending
Preventable Failures
68%
Equipment breakdowns detectable via vibration monitoring before occurrence
Cost Avoidance Ratio
12:1
Planned repair cost vs. emergency failure replacement ($3.5K vs. $42K average)
False Positive Rate
<8%
With properly calibrated thresholds and frequency spectrum validation
Every rotating component in oilfield equipment — bearings, gears, shafts, pumps, motors — produces a unique vibration signature determined by rotational speed, load characteristics, and mechanical geometry. When components operate within design specifications, vibration amplitudes remain stable and frequency patterns are predictable. As mechanical wear progresses or alignment degrades, vibration signatures change in measurable ways: amplitudes increase, new frequency harmonics appear, and spectral patterns shift. These changes are detectable 3–8 weeks before visible damage or performance degradation becomes apparent through traditional inspection methods.
Frequency Domain Analysis
Vibration sensors measure acceleration in three axes (radial, axial, tangential) at sampling rates of 10–50 kHz. Fast Fourier Transform (FFT) converts time-domain waveforms into frequency spectra showing amplitude distribution across frequency ranges. Each mechanical fault produces distinctive frequency patterns: bearing defects at 1–5x shaft speed, gear mesh problems at tooth-pass frequency, imbalance at 1x shaft speed, misalignment at 2x shaft speed. Pattern recognition algorithms identify fault signatures automatically.
Amplitude Trending & Thresholds
Overall vibration velocity (measured in mm/s RMS) indicates general equipment health. ISO 10816 standards define acceptable ranges: <2.8 mm/s = good, 2.8–7.1 mm/s = acceptable, 7.1–18 mm/s = unsatisfactory, >18 mm/s = unacceptable. But single measurements are insufficient — trending is critical. A pump operating at 3.5 mm/s (technically "acceptable") that was 1.8 mm/s last month indicates accelerating wear requiring investigation. System tracks week-over-week changes to identify deterioration curves.
Harmonic Pattern Recognition
Specific fault types generate recognizable harmonic patterns. Bearing outer race defect: peaks at BPFO frequency (Ball Pass Frequency Outer race) calculated from bearing geometry and shaft speed. Gear tooth wear: elevated sidebands around gear mesh frequency. Shaft crack: 2x and 3x running speed harmonics with phase shifts. Cavitation in hydraulic pumps: broadband noise at blade-pass frequency. Automated algorithms compare measured spectra against fault libraries to diagnose failure modes.
Common Oilfield Equipment Failure Modes Detected by Vibration Monitoring
Failure Mode
Vibration Signature
Detection Timeline
Typical Cost Impact
Bearing Wear (Inner/Outer Race)
Peaks at BPFI/BPFO frequencies (4–12x shaft speed), increasing amplitude trending, high-frequency noise floor elevation
4–6 weeks advance warning before seizure
Planned: $2.5K–$8K | Emergency: $35K–$65K
Shaft Misalignment
Elevated 2x and 3x running speed harmonics, high axial vibration relative to radial, 180° phase difference across coupling
2–3 weeks before accelerated bearing/seal damage
Planned: $1.2K–$3.5K | Emergency: $18K–$28K
Gear Tooth Degradation
Sidebands around gear mesh frequency, increasing modulation depth, discrete peaks at tooth-pass frequency harmonics
5–8 weeks before tooth fracture/gearbox failure
Planned: $4K–$12K | Emergency: $45K–$85K
Rotor Imbalance
Dominant peak at 1x shaft speed, amplitude proportional to imbalance severity, consistent phase relationship
3–4 weeks before bearing overload failure
Planned: $800–$2.2K | Emergency: $12K–$22K
Hydraulic Pump Cavitation
Broadband random noise at blade-pass frequency, erratic amplitude fluctuation, subharmonic generation
1–2 weeks before impeller erosion damage
Planned: $3.2K–$7K | Emergency: $24K–$38K
Looseness (Mechanical/Structural)
Multiple harmonics of running speed (1x, 2x, 3x...), non-repeatable waveforms, directional sensitivity changes
2–3 weeks before mounting failure/component damage
Planned: $600–$1.8K | Emergency: $8K–$15K
Deploy Vibration Monitoring Across Your Oilfield Fleet
FleetRabbit integrates with accelerometer sensors and provides automated frequency spectrum analysis, fault pattern recognition, and predictive alerts. Schedule a demo to review deployment architecture for your equipment.
Effective vibration monitoring requires strategic sensor placement that captures fault signatures from critical rotating components while minimizing false alarms from environmental noise and operational transients. Oilfield equipment presents unique challenges: harsh vibration environments (drilling shocks, road transportation), extreme temperature ranges (-40°C to +85°C), contamination exposure (mud, oil, dust), and limited mounting locations on equipment with restricted access.
Drilling Rigs: Top Drive & Mud Pump Systems
Top Drive Main Bearing Housing
Triaxial accelerometer, 50g range, radial/axial mounting. Monitors: main bearing health, gear mesh condition, motor rotor balance. Critical measurement point — top drive bearing failures cost $120K–$180K in emergency replacement plus 72+ hour rig downtime.
Mud Pump Crankshaft Bearings
Dual sensors (drive end, non-drive end), 100g range for high shock environment. Monitors: connecting rod bearing wear, crankshaft alignment, piston rod loading. Triplex pumps generate complex vibration patterns — requires baseline comparison against known-good signatures.
Drawworks Drum Gearbox
Single triaxial sensor on gearbox casing near output shaft bearing. Monitors: planetary gear mesh, output shaft bearing, drum brake condition. Lower priority than top drive but still critical — gearbox replacement $85K+ with 48-hour lead time.
Service Vehicles: Heavy Trucks & Specialty Equipment
Engine Main Bearing Area
Magnetic mount on engine block near #4 cylinder, 50g range. Monitors: main bearing wear, piston slap, valve train noise. Engine vibration increases 200–300% from normal to failure threshold — highly detectable progression.
Transmission Output Shaft Housing
Bolt-mounted accelerometer on transmission case. Monitors: output shaft bearing, gear mesh quality, clutch engagement characteristics. Transmission failures in heavy service trucks average $32K emergency cost vs. $4.5K planned rebuild.
Differential Pinion Bearing
Sensor mounted on differential housing near pinion gear. Monitors: pinion bearing condition, ring-and-pinion mesh, carrier bearing wear. High-torque oilfield applications accelerate differential wear — early detection prevents catastrophic failure during loaded operation.
Hydraulic Systems: Pumps & Power Units
Hydraulic Pump Drive Shaft Bearing
Triaxial sensor on pump casing, 50g range, sealed IP67 rating for fluid exposure. Monitors: drive shaft bearing, pump internal wear, cavitation detection. Cavitation generates distinctive broadband noise signature — automated detection prevents impeller erosion damage.
Power Unit Engine-to-Pump Coupling
Dual sensors on engine and pump sides of coupling assembly. Monitors: coupling alignment, torsional vibration, shock loading. Misalignment causes accelerated wear on both engine and pump bearings — correctable with shim adjustment when detected early.
Vibration monitoring systems generate continuous data streams measured in gigabytes per day across a fleet. The value isn't in data volume — it's in automated intelligence that filters noise, recognizes patterns, and escalates genuine failure indicators to maintenance teams. FleetRabbit's alert architecture operates in four cascading layers, each progressively narrowing from raw sensor data to actionable work orders.
Layer 1
Real-Time Threshold Monitoring
System continuously compares overall vibration velocity (mm/s RMS) against ISO 10816 limits and equipment-specific baselines. If amplitude exceeds "Caution" threshold (typically 1.5x baseline): generate yellow alert, increase sampling frequency from hourly to every 15 minutes, log event for trending analysis. If exceeds "Danger" threshold (typically 2.5x baseline): generate red alert, trigger immediate notification, create work order for inspection within 24 hours. This layer catches rapid-onset failures like sudden bearing seizure or catastrophic imbalance.
Layer 2
Trending Analysis & Rate-of-Change Detection
Absolute amplitude less important than change trajectory. Equipment operating at 4.2 mm/s (within "acceptable" range) that was 2.1 mm/s four weeks ago is deteriorating at 25% per week — projected to reach failure threshold in 6–8 weeks. System calculates linear regression on 30-day rolling window and flags equipment with acceleration >15% per week. This layer catches progressive failures like gradual bearing wear or developing misalignment before absolute thresholds breach.
Layer 3
Frequency Spectrum Fault Diagnosis
FFT analysis runs on every measurement cycle, extracting frequency spectra and comparing against fault signature library. Automated algorithms identify: bearing defect frequencies (BPFO, BPFI, BSF, FTF), gear mesh harmonics and sidebands, imbalance signatures, misalignment patterns, looseness indicators, cavitation broadband noise. When fault signature detected with confidence >75%, system classifies failure mode and estimates remaining useful life based on amplitude growth rate. This layer provides diagnostic specificity: not just "vibration high" but "outer race bearing defect progressing, estimated 280 hours to failure."
Layer 4
Predictive Work Order Generation
Final layer converts diagnostics into maintenance actions. System auto-generates work order including: equipment ID, fault type diagnosed, recommended corrective action (bearing replacement, alignment correction, etc.), estimated remaining operational hours, parts required (pulled from inventory system), priority level (immediate/urgent/scheduled), cost comparison (predictive intervention vs. emergency failure). Work order routes to appropriate technician based on location, expertise, and availability. Fleet manager receives summary dashboard showing all active alerts and pending maintenance across fleet.
Rig-14 Mud Pump Crankshaft Bearing Degradation
6-Week Vibration Monitoring Timeline
Week 0 (Baseline)
Normal Operation Confirmed
Vibration sensor installed on Rig-14 triplex mud pump crankshaft bearing housing. Baseline measurements: 3.2 mm/s RMS overall velocity, frequency spectrum shows expected harmonics at 1x, 2x, 3x crankshaft speed (180 RPM = 3 Hz fundamental). No anomalous peaks detected. Equipment operating within ISO 10816 "Good" range. System records baseline signature for future comparison.
Week 2
First Anomaly Detected: Amplitude Increase
Overall vibration rises to 4.8 mm/s RMS (+50% from baseline). Still within ISO "Acceptable" range but rate-of-change significant. Frequency analysis reveals new peak at 54 Hz (18x shaft speed) — consistent with outer race bearing defect frequency for this bearing geometry. Alert Level: Yellow. System recommendation: "Monitor closely, continue operation, schedule inspection at next planned maintenance window (4 weeks)." Fleet manager acknowledges alert, sets reminder for Week 6 inspection.
Week 4
Deterioration Acceleration Confirmed
Vibration jumps to 7.8 mm/s RMS (+144% from baseline, +63% from Week 2). Now approaching ISO "Unsatisfactory" threshold. Bearing defect frequency peak amplitude tripled. New harmonics appearing at 2x and 3x BPFO frequency — indicating defect expansion across bearing race. System calculates trend: at current acceleration rate, equipment will reach "Danger" threshold in 12–16 days. Alert escalated to Orange. Recommendation updated: "Schedule bearing replacement within 2 weeks, reduce pump load if possible, increase monitoring to daily."
Week 5
Critical Intervention Threshold Reached
Vibration reaches 12.4 mm/s RMS — now in ISO "Unsatisfactory" range. Bearing defect frequencies dominating spectrum, high-frequency noise floor elevated 400% indicating advanced surface degradation. System predicts catastrophic failure within 5–8 operating days based on exponential amplitude growth curve. Alert escalated to Red: "STOP OPERATION WITHIN 48 HOURS. Schedule emergency bearing replacement immediately." Automated work order generated with parts list, estimated repair time (18 hours), and cost comparison: planned replacement $3,800 vs. projected emergency failure cost $42,000+.
Week 5 + 2 Days
Predictive Maintenance Completed Successfully
Pump shut down during scheduled drilling break. Crankshaft bearing inspected: outer race showing advanced spalling across 60% of surface area — exactly as vibration analysis predicted. Bearing at 85–90% of catastrophic failure progression. Replacement bearing installed from on-site inventory, pump reassembled, vibration baseline re-established: 2.9 mm/s RMS (slightly better than original baseline due to new bearing). Total maintenance cost: $3,800 (parts $1,200, labor $2,600). Production downtime: 18 hours during planned non-drilling period. Alternative scenario: continued operation would have resulted in bearing seizure within 3–6 days, crankshaft damage from bearing fragments, complete pump replacement required ($42K parts + $8K emergency mobilization + 72 hours unplanned downtime). Vibration monitoring ROI: 11:1 on single intervention event.
Week 6 Onward
Continued Monitoring Validates Repair
Post-repair vibration tracking confirms successful intervention. Equipment operating at healthy baseline levels with no anomalous frequency components. System continues monitoring to ensure no secondary damage from original bearing failure (shaft scoring, adjacent bearing overload, alignment issues). Lesson learned: 6-week advance warning enabled planned maintenance during operational window, avoided catastrophic failure, prevented collateral damage to crankshaft and pump housing. Case documented in FleetRabbit system as reference for future similar fault signatures.
Implement Predictive Vibration Monitoring Across Your Fleet
The same fault detection, trending analysis, and automated alerting system used in this case study is available for your drilling rigs and service equipment. Book a demo to review sensor deployment and expected ROI.
Vibration monitoring delivers maximum value when integrated with comprehensive fleet maintenance systems rather than operating as standalone condition monitoring. FleetRabbit connects vibration sensor data with maintenance history, parts inventory, telematics inputs, and inspection findings to create holistic equipment health intelligence that drives better maintenance decisions.
Unified Equipment Health Dashboard
Single view showing all condition monitoring inputs: vibration trending, fault code history from telematics, fluid analysis results, inspection findings, maintenance history. Fleet manager sees complete picture: not just "vibration high" but "vibration increasing + oil analysis showing elevated iron + last bearing replacement 3,200 hours ago = bearing end-of-life confirmed through multiple independent indicators." Eliminates uncertainty and false alarms.
Automated Parts Availability Verification
When vibration alert triggers work order for bearing replacement, system automatically checks parts inventory: bearing in stock at Site 7 (same location as equipment) vs. 4-day supplier lead time if not in stock. Work order includes parts location and availability status. Prevents scenario where maintenance team arrives to repair equipment only to discover critical component unavailable — the #1 cause of planned maintenance delays.
Maintenance History Correlation
System tracks: when was this bearing last replaced? Same failure mode recurring prematurely? If bearing replaced 800 hours ago and already showing defect signatures, indicates either installation error, contamination issue, or component quality problem. System flags for root cause investigation rather than simple replacement. Prevents repeat failures from unresolved underlying conditions.
Multi-Parameter Fault Confirmation
Vibration analysis suggests bearing wear. System cross-references with oil analysis data: elevated iron content confirming metallic wear particles? Temperature sensors showing bearing housing heat increase? Telematics showing lubricant pressure drop? When multiple independent condition indicators align, confidence in diagnosis approaches 95%+. When vibration alone indicates problem but other parameters normal, triggers manual inspection to rule out sensor error or environmental interference.
Remaining Useful Life Calculation
Combines vibration trending with historical failure data from similar equipment to estimate remaining operational hours. Example: current vibration amplitude 8.2 mm/s, growing at 18% per week, historical data shows this bearing type fails at average 14.5 mm/s — calculated remaining life: 320–380 operating hours. Enables proactive scheduling: "Schedule replacement during next planned maintenance window in 2 weeks (estimated 280 operating hours from now)" rather than emergency intervention.
Fleet-Wide Pattern Recognition
System aggregates vibration data across entire fleet to identify systemic issues. Example: three different mud pumps showing similar bearing failure patterns within 1,200–1,400 hour window after bearing replacement — suggests component batch quality issue or installation procedure problem affecting multiple assets. Fleet-level intelligence impossible with asset-by-asset monitoring; only visible through integrated platform analyzing population trends.
01
Prioritize Critical Equipment First
Don't attempt fleet-wide deployment simultaneously. Start with highest-value, highest-failure-risk equipment: top drives on drilling rigs, mud pump assemblies, critical hydraulic power units. Establish baseline signatures, validate alert thresholds, demonstrate ROI on 8–12 critical assets before expanding to broader fleet. Typical phased deployment: Month 1–2 (drilling rig critical systems), Month 3–4 (high-value service vehicles), Month 5–6 (secondary equipment based on failure cost analysis).
02
Establish Equipment-Specific Baselines
ISO standards provide general thresholds, but equipment-specific baselines are essential for accurate fault detection. New mud pump may operate at 2.8 mm/s baseline; identical pump after 5,000 operating hours may run at 4.5 mm/s baseline (higher but stable = acceptable). System must learn normal signature for each asset during initial 2–4 week monitoring period before alerts activate. Baseline period accounts for equipment age, duty cycle, mounting characteristics, environmental factors.
03
Validate Alerts Through Manual Inspection
First 8–12 alerts from new vibration monitoring deployment should trigger manual inspection regardless of system diagnosis. Validates that automated fault identification is accurate, refines threshold settings based on actual failure progression observed, builds maintenance team confidence in system recommendations. After validation period demonstrates 85%+ diagnostic accuracy, transition to automated work order generation with reduced manual confirmation requirement.
04
Account for Operational Context
Drilling rig vibration during active drilling differs dramatically from rig in standby mode. Service truck vibration while traveling loaded on rough roads vs. parked with engine idling. System must correlate vibration measurements with operational state (active/idle/transport) to prevent false alarms from normal operational transients. Integration with telematics provides context: vehicle speed, engine load, hydraulic pressure — enabling intelligent filtering of operational noise from genuine mechanical faults.
05
Plan for Harsh Environment Challenges
Oilfield equipment operates in extreme conditions that challenge sensor reliability: temperature cycling (-40°C to +85°C), contamination (drilling mud, hydraulic oil, dust), mechanical shock (road transport, drilling percussion), electromagnetic interference (VFD drives, high-power electrical). Sensor selection must account for environmental rating (IP67 minimum), mounting method (magnetic vs. stud-mount vs. adhesive based on vibration severity), cable routing (protected from abrasion and fluid exposure). Budget 10–15% sensor replacement rate annually in harsh environments.
Deployment Investment (100-Vehicle Fleet)
Vibration sensors (200 units @ $340/unit, 2 sensors per critical asset)
$68,000
Data acquisition hardware & wireless transmitters
$24,000
FleetRabbit platform license (annual, includes vibration analysis module)
$48,000
Installation labor & baseline commissioning
$22,000
Total Year 1 Investment
$162,000
Annual Value Delivered
Prevented failures (18 events @ $38K average emergency cost)
$684,000
Reduced unplanned downtime (420 hours @ $850/hour productivity loss)
$357,000
Extended component service life (preventive vs. run-to-failure)
$118,000
Eliminated collateral damage from secondary failures
$92,000
Total Annual Benefit
$1,251,000
ROI Ratio
7.7:1
$1,251K annual benefit vs. $162K Year 1 investment
Payback Period
1.5 months
Based on average 3–4 prevented failures in first 6 weeks
Year 2+ Net Benefit
$1,203K annually
Ongoing license cost ($48K) vs. sustained benefits ($1,251K)
How accurate is vibration monitoring at predicting actual equipment failures versus false alarms?
With properly calibrated baselines and frequency spectrum analysis (not just amplitude thresholds), diagnostic accuracy is 85–92% for bearing and gear faults. False positive rate drops below 8% when system cross-references vibration signatures with other condition indicators like oil analysis and temperature trending.
Can vibration sensors survive the harsh conditions on drilling rigs and oilfield service vehicles?
Industrial-grade accelerometers with IP67 sealing and temperature range -40°C to +125°C are designed specifically for these environments. Typical sensor lifespan is 5–8 years in oilfield applications with annual replacement rate of 10–15% due to mechanical damage or cable wear.
Do I need specialized vibration analysis expertise to interpret the data and alerts?
No. FleetRabbit's automated fault pattern recognition and diagnostic algorithms handle frequency spectrum analysis automatically. Alerts include plain-language explanations: "Bearing outer race defect detected, estimated 280 hours to failure" rather than raw FFT data requiring specialist interpretation.
How long does it take to establish baseline signatures before the system can start detecting faults?
Initial baseline establishment requires 2–4 weeks of continuous monitoring during normal operation to characterize equipment-specific vibration signatures and account for duty cycle variations. Alert generation activates after baseline period completes with confidence thresholds validated.
What connectivity is required for vibration sensors on remote drilling rigs or service vehicles?
Sensors connect via wireless mesh network to local gateway device with cellular modem. Data transmits hourly when connectivity available; stores locally when offline and syncs automatically when connection restores. System functions fully in areas with intermittent cellular coverage.
Predictive Maintenance Technology
FleetRabbit's vibration monitoring platform delivers automated fault detection, frequency spectrum analysis, and predictive alerts that transform reactive maintenance into planned intervention — preventing catastrophic failures at a fraction of emergency repair costs across your oilfield drilling rigs and service equipment.
Bearing Fault Detection
Gear Mesh Analysis
Misalignment Alerts
Automated Diagnostics
3–8 Week Early Warning
7.7:1 ROI
April 17, 2026
By David
All Posts







