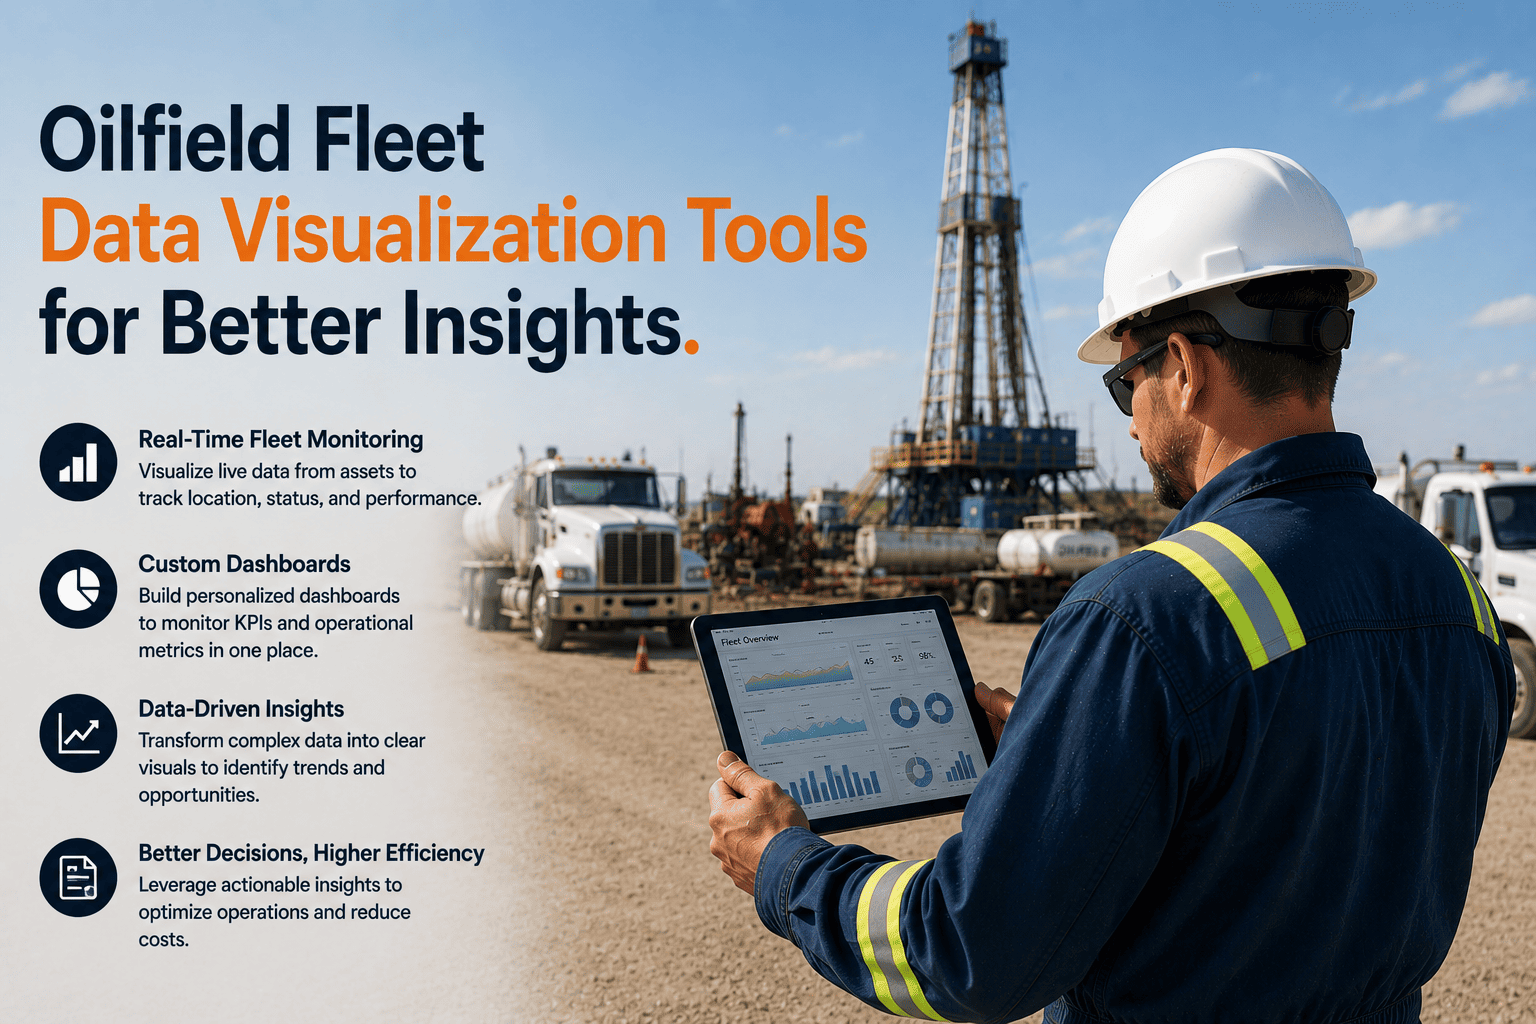
Advanced analytics dashboards and data visualization tools purpose-built for oilfield fleet operations — transforming raw telematics streams, fuel consumption logs, maintenance records, and operator behavior data into actionable intelligence that enables fleet managers and senior executives to make confident, data-driven decisions. FleetRabbit's visualization platform consolidates fragmented data sources into unified dashboards delivering real-time operational visibility, cost attribution clarity, and predictive performance insights across every asset in your oilfield fleet. Schedule a personalized demo to explore FleetRabbit's analytics dashboards with your fleet's actual data.
Oilfield Fleet Data Visualization and Analytics Intelligence
Stop managing your oilfield fleet on gut instinct and scattered spreadsheets. FleetRabbit's analytics platform transforms raw telematics, fuel, maintenance, and operator data into visual dashboards that surface performance gaps, cost overruns, and optimization opportunities the moment they emerge — giving fleet managers and executives a unified command view across every asset.
Fragmented data creates blind spots that cost oilfield operators millions annually in avoidable fuel waste, unplanned downtime, and inefficient asset deployment. FleetRabbit closes those gaps with unified visualization intelligence. Activate your fleet dashboard — live data in 3 to 5 days
Why Oilfield Fleets Lose Revenue Without Proper Data Visualization
Disconnected Data Sources Prevent Accurate Decision Making
Oilfield fleet operations generate data from a dozen separate systems — GPS units, fuel cards, maintenance logs, driver scorecards, dispatch software — none of which communicate with each other. Fleet managers spend hours extracting, reconciling, and formatting reports instead of acting on insights, while executives receive stale snapshots that no longer reflect current operational reality.
A single integrated platform ingests all data streams automatically, normalizes them against your fleet's operational parameters, and presents consolidated dashboards updated in real time — eliminating manual reconciliation and delivering current-state accuracy executives and dispatchers can act on immediately.
Lagging Reports Miss Cost Escalation Until Damage Is Done
Monthly fuel summaries and end-of-period maintenance reports reveal problems after the budget impact has already materialized. By the time abnormal idling patterns, excessive fuel consumption, or unauthorized vehicle usage appear in a report, weeks of preventable cost have accumulated across dozens of assets operating in remote basin locations without visibility.
Threshold-based alerts and live trend visualization flag cost anomalies as they develop. Fleet managers see fuel consumption spikes, idling outliers, and maintenance overdue notifications the moment thresholds are breached — enabling same-day intervention rather than end-of-month damage assessment.
Asset Utilization Blind Spots Drive Unnecessary Capital Spending
Without utilization visualization, oilfield operators routinely mobilize additional equipment or procure rentals while owned assets sit underutilized at other sites. Dispatchers lack the real-time location, status, and availability data needed to optimize deployment, resulting in inflated fleet size, excessive rental costs, and avoidable capital expenditures that compound across multi-basin operations.
Asset utilization dashboards display real-time equipment status, site location, operating hours, and availability across your entire fleet. Dispatchers identify underutilized assets available for redeployment before committing to rental agreements, optimizing fleet utilization rates and deferring unnecessary capital acquisition decisions.
Give Your Leadership Team the Fleet Intelligence They Need to Act Decisively
FleetRabbit's executive dashboards surface KPIs that matter — cost per mile, fleet availability, fuel efficiency rankings, driver performance scores, and maintenance compliance rates — in formats built for rapid review, not lengthy analysis sessions.
FleetRabbit Visualization Tools Built for Oilfield Operational Complexity
Live Operations Map and Asset Tracking Dashboard
Real-time geographic visualization of every fleet asset across oilfield sites, haul routes, and service locations. Dispatchers monitor vehicle positions, heading, speed, and status simultaneously — enabling proactive rerouting, accurate ETAs for field operations, and immediate response to geofence violations or unauthorized movement outside permitted operating zones.
- Asset clustering and site-level grouping for multi-location operations
- Geofence boundary visualization with instant alert triggers
- Historical route replay for compliance verification and incident review
Fuel Consumption Analytics and Cost Attribution Reporting
Granular fuel consumption dashboards break down usage by vehicle, driver, route, job site, and time period — identifying where fuel budget overruns originate and quantifying the cost of idling, inefficient routing, and operator behavior deviations. Managers receive ranked efficiency comparisons enabling targeted coaching and accountability conversations supported by objective data.
- Per-asset fuel efficiency trending and benchmark comparison
- Idling time visualization with cost-per-hour impact calculation
- Fuel card transaction reconciliation against telematics consumption data
Driver Performance Scorecards and Safety Behavior Analytics
Composite driver performance scores visualize safety behavior trends including harsh braking events, aggressive acceleration, speeding frequency, and seatbelt compliance — presented in ranked dashboards that enable managers to identify high-risk operators requiring intervention and recognize top performers worthy of acknowledgment in safety-critical oilfield environments.
- Composite safety scoring across multiple behavior metrics per driver
- Trend visualization showing improvement or deterioration over time
- Coaching workflow integration linking scorecard data to training records
Maintenance Compliance and Asset Health Visual Tracking
Fleet-wide maintenance status dashboards display service due dates, overdue intervals, upcoming scheduled work, and asset health scores across every vehicle and piece of equipment. Color-coded urgency indicators surface critical compliance gaps at a glance, enabling service coordinators to prioritize work orders and prevent deferred maintenance from cascading into field equipment failures.
- Fleet-wide compliance percentage with drill-down to individual assets
- Predictive service date projection based on actual usage accumulation
- Work order status tracking from open request through completion verification
Executive leadership cannot optimize what they cannot see. FleetRabbit delivers the operational transparency that transforms fleet management from reactive cost center into competitive advantage. See the executive dashboard in a live demonstration
How FleetRabbit Analytics Serves Every Level of Oilfield Leadership
Operational Control Across Every Active Asset
Monitor real-time asset positions, driver behavior scores, fuel anomalies, and maintenance compliance from a unified dashboard. Intervene on developing issues before they disrupt field operations or escalate into budget overruns that require executive-level explanation.
Basin-Wide Performance Benchmarking and Trend Analysis
Compare fleet performance across drilling pads, service basins, and operational regions with aggregated KPI dashboards. Identify which sites and supervisors are driving efficiency gains and replicate those practices across underperforming operational segments through data-supported management decisions.
Cost Attribution Clarity and Capital Efficiency Reporting
Accurate cost-per-asset, cost-per-job, and total fleet cost of ownership reports give finance leadership the attribution granularity needed for accurate project costing, budget variance analysis, and capital allocation decisions across fleet expansion, maintenance reserve, and equipment replacement planning cycles.
Risk Visualization and Regulatory Compliance Assurance
Safety behavior dashboards quantify risk exposure across your driver population with objective scoring data that supports disciplinary decisions, training program design, and regulatory reporting. Demonstrate due diligence to insurers and regulators through documented, data-driven safety management practices built into daily fleet operations.
Common Questions About Fleet Data Visualization for Oilfield Operations
Deploy the Analytics Platform That Puts Every Fleet Decision on a Foundation of Real Data
FleetRabbit's oilfield fleet data visualization platform unifies telematics performance streams, fuel consumption analytics, driver behavior scoring, asset utilization tracking, and maintenance compliance reporting into executive-grade dashboards that transform operational management from reactive guesswork into precision decision-making. Achieve 60 to 75 percent reporting time reduction, 12 to 18 percent fuel cost savings, and 92 to 96 percent fleet availability through data-driven intervention powered by real-time visibility across every asset in your oilfield operation.
Oilfield fleet performance is measurable, manageable, and improvable — when you can see it clearly. FleetRabbit delivers that visibility starting on day one. Schedule your analytics demonstration today







