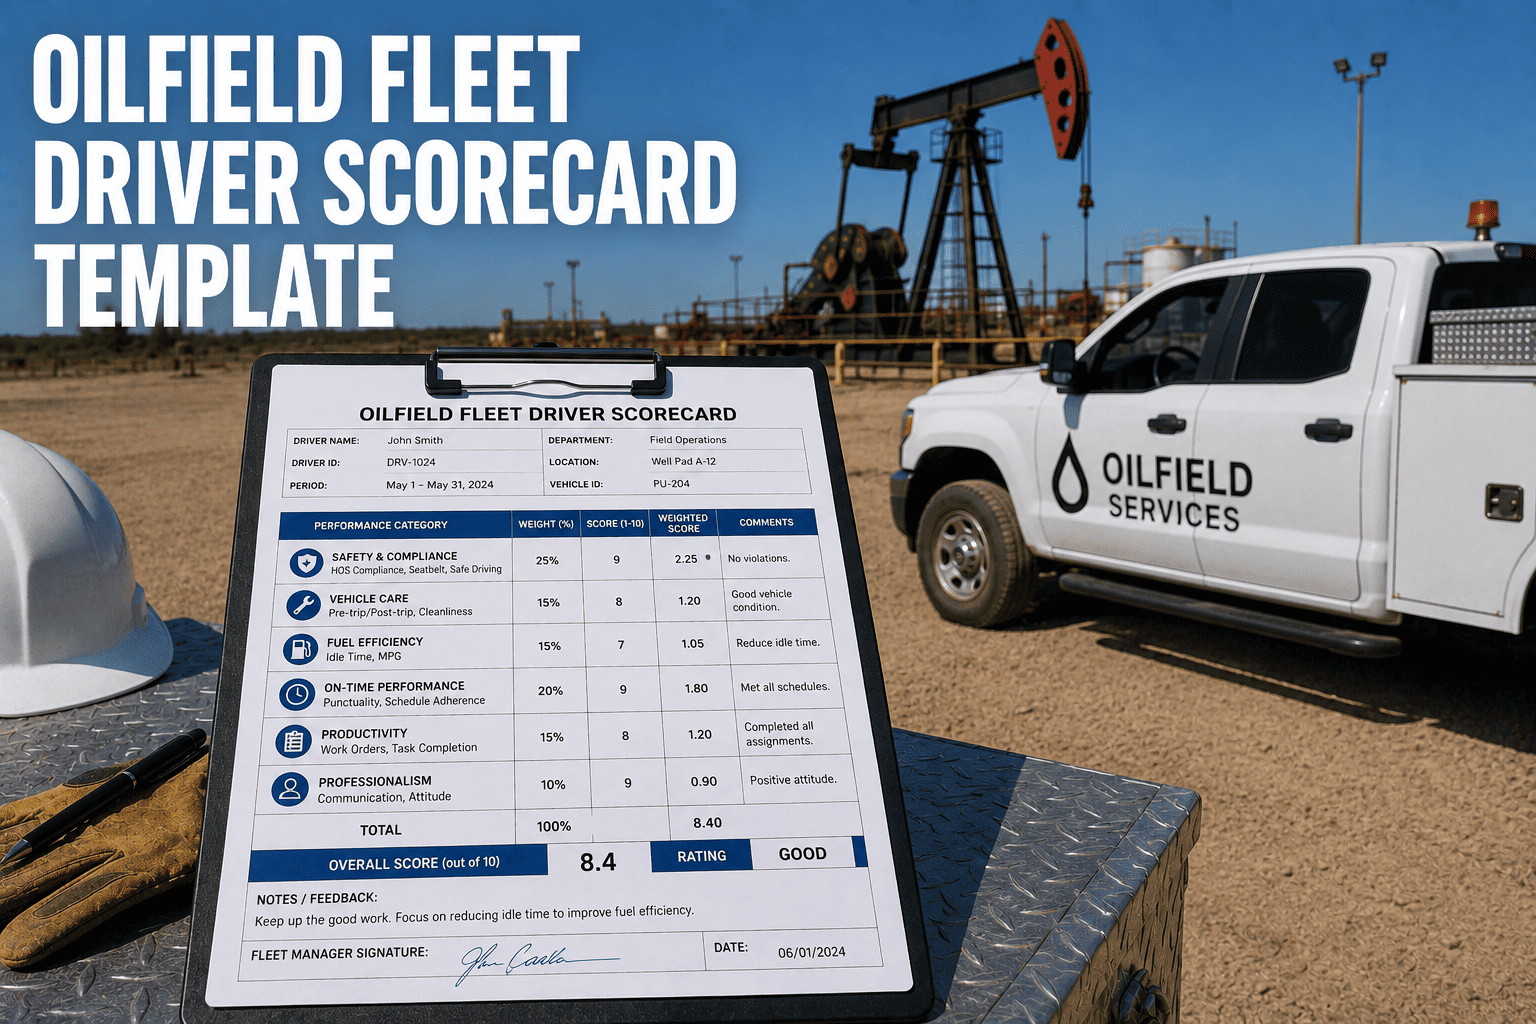
Measuring driver performance in oilfield fleets without a structured scorecard is like navigating a lease road at midnight without headlights. You know the road is there somewhere, but you cannot see the hazards until you hit them. Most oilfield fleet managers rely on gut feel, isolated incident reports, or basic violation counts to evaluate their drivers. These fragmented approaches create blind spots that let unsafe patterns develop unchecked until a preventable incident forces the issue. A driver scorecard changes this dynamic entirely by consolidating safety, efficiency, and reliability metrics into a single visual framework that makes performance instantly visible, consistently fair, and directly actionable for coaching conversations.
An oilfield fleet driver scorecard is a structured evaluation framework that measures individual driver performance across safety incidents, telematics data, fuel efficiency, and on-time delivery compliance. Fleets using standardized scorecards reduce preventable accidents by 25 to 40 percent and improve fuel efficiency by 8 to 15 percent within the first year of implementation through consistent, data-driven coaching.
Driver Average
Why Oilfield Fleets Need Driver Scorecards
Oilfield driving is among the most demanding commercial driving environments in existence. Drivers navigate unpaved lease roads with limited visibility, operate near heavy equipment on active well sites, transport hazardous materials under strict regulatory oversight, and work extended hours in remote locations far from maintenance support. In this environment, driver behavior directly determines whether your fleet operates safely and profitably or accumulates incidents, fines, and downtime. A scorecard provides the measurement framework that connects individual driver behavior to fleet-wide outcomes.
The oilfield environment amplifies the consequences of every driving decision. A hard brake on a highway is a minor telematics event. A hard brake on a gravel lease road hauling a load of produced water can mean a tipped trailer, a spill incident, and a multi-day cleanup operation costing tens of thousands of dollars. Speeding on a paved road is a citation risk. Speeding on an unpadded well site access road destroys road surfaces and triggers operator complaints that threaten your contract. These context-specific risks are why generic driver scorecards designed for highway trucking fail in oilfield applications. Your scorecard must reflect the actual risks your drivers face every day.
What Generic Scorecards Miss in Oilfield Context
Standard fleet scorecards weight highway metrics like over-the-road speed and cruise control usage heavily. These metrics matter less for oilfield fleets where most driving occurs on lease roads at speeds below 35 miles per hour. What matters more in oilfield operations is low-speed maneuvering safety, site entry and exit protocol compliance, load securement discipline for specialized equipment, and hazard communication with other well site workers. A driver who scores poorly on highway speed metrics but excels at safe site navigation and load handling is actually a stronger performer in oilfield context than a scorecard designed for long-haul would indicate. This mismatch is why customizing your scorecard categories and weightings for oilfield-specific risks is essential. You can sign up for FleetRabbit to access pre-built oilfield driver scorecard templates that already account for these context differences.
Core Categories for an Oilfield Driver Scorecard
An effective oilfield driver scorecard organizes performance data into four to six distinct categories, each carrying a weighted percentage that reflects its importance to your specific operation. The total score across all categories produces a single composite number that enables fleet-wide ranking and trend analysis while the individual category scores pinpoint exactly where each driver needs improvement. Below is the recommended category framework for oilfield fleet scorecards.
| Scorecard Category | Recommended Weight | Key Metrics Included | Data Source |
|---|---|---|---|
| Safety Compliance | 35% | Preventable incidents, violations, inspection failures, HAZMAT protocol adherence, PPE compliance | Incident reports, DOT inspections, site observation logs |
| Driving Behavior | 25% | Harsh braking, harsh acceleration, speeding events, cornering intensity, following distance | Telematics system event data |
| Fuel Efficiency | 15% | Excessive idling time, fuel consumption per mile, RPM range compliance, route adherence | Fuel card data, telematics engine data |
| On-Time Performance | 15% | Dispatch compliance, arrival window adherence, route completion rate, delay reporting | Dispatch system, GPS timestamps |
| Vehicle Care | 10% | Pre-trip inspection completion, defect reporting timeliness, interior cleanliness, equipment handling | DVIR records, maintenance system, supervisor observations |
Safety Compliance Category Deep Dive
Safety carries the highest weight because in oilfield operations, a single safety failure can cascade into environmental incidents, regulatory actions, and contract termination. This category must extend beyond simple incident counting to evaluate proactive safety behaviors. A driver with zero incidents who never reports near-misses is not necessarily safer than a driver who reports three near-misses and actively participates in safety meetings. Your scoring methodology should reward reporting behavior and safety engagement, not just penalize incidents. Assign points for completed pre-trip inspections, documented near-miss reports, safety meeting attendance, and correct PPE usage observed during site visits. Deduct points for preventable incidents, DOT inspection violations, HAZMAT protocol deviations, and unreported damage to vehicles or equipment.
Scoring Safety Incidents By Severity
Not all safety events deserve equal point deductions. A minor backing incident causing a scratched fender should not carry the same scoring penalty as a rollover or a HAZMAT spill. Establish a severity tier system within your safety category that scales deductions proportionally. Tier one events like minor contact without injury and no cargo impact might deduct 5 to 10 points. Tier two events involving injury, cargo damage, or regulatory citations might deduct 15 to 25 points. Tier three events involving serious injury, environmental release, or vehicle rollover might deduct 30 to 50 points or result in immediate scorecard review and potential removal from service. This tiered approach ensures your scorecard reflects the actual risk severity of each event rather than treating all incidents as equal.
FleetRabbit pulls telematics data, fuel card transactions, and DVIR records to calculate driver scores automatically every day. No manual data entry, no spreadsheet calculations, no delayed reporting. See each driver's safety, fuel, and performance score updated in real-time with trend tracking across weekly and monthly periods.
Driving Behavior Metrics From Telematics
Telematics data provides the most granular and objective input for your driver scorecard. Unlike incident-based metrics that capture only the worst outcomes, telematics captures every driving event across every trip, building a comprehensive behavioral profile for each driver. The key is selecting the right events to measure and setting threshold values that distinguish between normal oilfield driving and genuinely risky behavior. Oilfield driving triggers more telematics events than highway driving by nature. Hard braking events occur frequently on lease roads when drivers encounter unexpected conditions or must stop for equipment crossing their path. Your threshold settings must account for this operational reality or your scorecard will penalize drivers for normal oilfield driving conditions.
Setting Appropriate Telematics Thresholds for Oilfield
Standard telematics threshold settings calibrated for highway driving will over-count events in oilfield applications. A hard braking threshold set at 0.4G deceleration might generate 8 to 12 events per day for an oilfield driver navigating lease roads compared to 1 to 3 events per day for a highway driver covering the same mileage. Before building your scorecard, analyze your fleet's telematics data to establish baseline event frequencies. Set thresholds at the 75th percentile of your fleet's normal driving data so only genuinely aggressive events trigger score deductions. This calibration step is critical. Without it, your scorecard loses credibility with drivers who know they are driving appropriately but receiving poor scores because the thresholds are wrong.
Recommended Telematics Metrics and Weighting
Within the driving behavior category, distribute points across five core telematics metrics. Harsh braking receives the highest sub-weight because uncontrolled deceleration in oilfield settings causes load shifts, tipping risks, and following-distance failures. Harsh acceleration receives moderate weighting as it indicates impatience and increases fuel consumption disproportionately. Speeding events should be segmented into lease road speeding and highway speeding with different thresholds and point values since the risk profiles differ significantly. Cornering intensity matters on lease road intersections and well site turnaround areas where tight turns with heavy loads create rollover risk. Following distance events captured through forward-facing radar or camera systems directly measure one of the highest-risk behaviors in any driving environment.
| Telematics Metric | Sub-Weight | Oilfield Threshold | Scoring Method |
|---|---|---|---|
| Harsh Braking | 30% | 0.5G deceleration for loaded, 0.6G for empty | 2 points deducted per event above 5 events per 100 miles |
| Harsh Acceleration | 20% | 0.35G acceleration | 1 point deducted per event above 8 events per 100 miles |
| Lease Road Speeding | 20% | 5 mph above posted or operator limit | 3 points deducted per event above 3 events per day |
| Highway Speeding | 15% | 5 mph above posted limit | 2 points deducted per event above 2 events per 100 highway miles |
| Following Distance | 15% | Less than 2 seconds at current speed | 3 points deducted per event above 1 event per 50 miles |
Fuel Efficiency as a Scorecard Component
Fuel is typically the second-largest operating expense for oilfield fleets after labor. Driver behavior directly influences fuel consumption by 15 to 30 percent depending on vehicle type and operating conditions. Excessive idling is the single largest driver-controlled fuel waste in oilfield operations. Drivers waiting at well sites often leave engines running for climate control or to maintain air pressure for brake systems. While some idling is operationally necessary, fleets typically find 30 to 50 percent of total idle time is avoidable. Your scorecard should measure total idle time as a percentage of engine run time and set a threshold that distinguishes between necessary and excessive idling for your specific operation.
RPM management is the second key fuel metric. Drivers who run engines at high RPM during low-speed lease road driving burn significantly more fuel than drivers who shift appropriately and maintain lower RPM ranges. Telematics data showing percentage of driving time spent above optimal RPM range provides a clear measurement that drivers can improve through gear selection awareness. Route adherence, while partially controlled by dispatch, still involves driver decisions about whether to follow assigned routes or take shortcuts that may add distance. Measuring actual miles driven versus dispatched miles reveals route compliance that impacts both fuel cost and on-time performance simultaneously.
Balancing Fuel Metrics With Safety
A common scorecard design mistake is weighting fuel metrics too heavily, which creates perverse incentives. Drivers focused exclusively on fuel scores may coast through stop signs to avoid braking events, maintain following distance so wide that it impedes other traffic, or refuse to idle when idling is necessary for equipment operation. Your fuel category weight of 15 percent ensures fuel matters but never overrides safety. When a driver's fuel score improves but their safety score declines, the composite score still reflects the safety concern because safety carries 35 percent weight. This balance is essential for maintaining a safety-first culture while still capturing fuel efficiency gains. If you want to see how this balance works in practice, book a demo with FleetRabbit and we will walk through live scorecard examples from oilfield fleets.
On-Time Performance and Vehicle Care Scoring
On-time performance in oilfield fleets differs from standard freight delivery timing. Oilfield dispatch operates on appointment windows tied to well site schedules, crew changes, and production timelines. A water truck arriving 30 minutes late for a scheduled frac water delivery can delay the entire fracturing operation. A hot shot driver arriving late with a critical replacement part can idle a drilling rig at enormous daily cost. Your on-time scoring should measure arrival within the dispatched window, with partial credit for arrivals within a grace period and no credit for arrivals outside the grace period. The grace period should reflect the actual flexibility of each operation type rather than applying a uniform standard.
Vehicle Care as a Leading Safety Indicator
Vehicle care at 10 percent weight seems minor but serves a critical function as a leading indicator of safety performance. Drivers who consistently skip pre-trip inspections, delay defect reporting, or handle equipment carelessly are statistically more likely to experience safety incidents. The vehicle care category catches these patterns early before they manifest as breakdowns or incidents. Track pre-trip inspection completion rate, time between defect identification and reporting, interior cleanliness scores from supervisor walk-arounds, and equipment handling observations from well site visits. A driver who averages 90 percent pre-trip completion but drops to 60 percent over two weeks is showing a behavioral change that warrants a coaching conversation before it escalates to a safety event.
Using Scorecards for Driver Coaching
The scorecard's value materializes during coaching conversations. Without a scorecard, coaching sessions devolve into subjective discussions where drivers feel targeted and defensive. With a scorecard, the conversation centers on objective data that both the manager and driver can see and understand. The most effective coaching approach follows a consistent three-part structure. First, review the composite score and trend direction. Is the driver's score improving, declining, or stable compared to last month. Second, identify the one or two categories with the most room for improvement. Do not try to address every category at once. Third, agree on one specific behavior change for the next review period with a measurable target.
Coaching Frequency Based on Score Tiers
Not every driver needs the same coaching intensity. Establish score tiers that determine coaching frequency and format. Drivers scoring 90 and above need only a brief monthly acknowledgment and continued positive reinforcement. Drivers scoring 75 to 89 need a structured monthly coaching session focusing on their weakest category. Drivers scoring 60 to 74 need bi-weekly coaching sessions with specific behavioral targets and follow-up tracking. Drivers scoring below 60 need a formal performance improvement plan with weekly check-ins and clear consequences if improvement does not occur within a defined timeframe. This tiered approach concentrates your coaching resources where they generate the most impact rather than spreading them uniformly across all drivers regardless of need.
Making Scorecards Fair and Transparent
Driver acceptance of scorecards depends entirely on perceived fairness. If drivers believe the scoring methodology is rigged, thresholds are unrealistic, or data is inaccurate, the scorecard becomes a morale destroyer rather than a performance tool. Build fairness into your scorecard through three practices. First, share the complete scoring methodology with every driver before implementation. Explain each metric, how it is measured, what thresholds apply, and how points are calculated. Second, allow drivers to flag events they believe are incorrectly recorded. Telematics systems occasionally generate false events from road conditions or sensor glitches. A simple dispute process where drivers can challenge specific events and have them reviewed builds trust in the data. Third, never use scorecard data punitively without coaching first. A driver who drops two tiers should receive coaching and support before any disciplinary action. Using scores solely as a punishment weapon destroys the coaching culture that makes scorecards effective.
FleetRabbit's driver scorecards show each driver their own scores in a personal dashboard they can access anytime. Every metric is visible, every event is clickable for detail, and every score change is explainable. When drivers trust the data, coaching conversations become productive instead of adversarial.
Building Your Oilfield Driver Scorecard Template
Creating your scorecard template requires five steps that take most fleets two to three weeks to complete properly. Start by defining your categories and weightings based on the framework above, adjusting weights to match your operation's specific risk profile. A fleet primarily hauling produced water might weight safety even higher at 40 percent because spill risk is their dominant concern. A fleet doing hot shot critical parts delivery might increase on-time performance to 20 percent because delivery urgency drives their business model. Second, establish baseline data by analyzing three months of telematics, fuel, and dispatch data to understand your fleet's current performance distribution. Third, set thresholds using the 75th percentile method described earlier to ensure scores differentiate between drivers rather than penalizing everyone equally. Fourth, build your scoring calculation into a repeatable format, whether manual spreadsheet or automated platform. Fifth, pilot the scorecard with a small driver group for 30 days to identify calculation errors, threshold problems, or missing metrics before fleet-wide rollout.
Scorecard Review and Calibration Cycle
Scorecards are not set-and-forget tools. Operational conditions change, telematics systems receive updates that may alter event detection sensitivity, and your fleet composition evolves as vehicles and drivers join and leave. Schedule a quarterly scorecard calibration review where you examine score distributions across the fleet. If 80 percent of drivers score above 90, your thresholds are too lenient and the scorecard is not differentiating performance. If 80 percent of drivers score below 70, your thresholds are too aggressive and the scorecard is demoralizing rather than motivating. The ideal distribution shows the majority of drivers clustered in the 75 to 90 range with smaller groups in the recognition and action tiers. Adjust thresholds quarterly to maintain this healthy distribution as your fleet's overall performance improves over time.
Turning Driver Data Into a Safety Culture Advantage
The oilfield fleets that achieve the lowest incident rates share one common characteristic. They measure driver performance consistently, coach based on data rather than emotion, and create visibility that makes every driver aware of how their daily choices connect to fleet-wide safety outcomes. A driver scorecard is the tool that makes this possible. It transforms thousands of telematics data points, fuel transactions, and inspection records into a single number that tells you at a glance whether each driver is helping or hurting your safety performance. More importantly, it tells each driver the same thing about themselves.
When a driver opens their personal dashboard and sees their safety score dropped from 88 to 82 because of increased harsh braking events last week, they do not need a manager to tell them something changed. The data speaks for itself. When that same driver sees their score recover to 86 the following week after paying attention to following distance, they experience the direct connection between their behavior and their performance measurement. This feedback loop is what drives lasting behavioral change. Lecture-based safety meetings cannot create it. Penalty-based enforcement cannot create it. Only consistent, visible, fair measurement creates the self-awareness that transforms good drivers into excellent ones and struggling drivers into improving ones.
The template framework, threshold methodology, and coaching structure provided here give you everything needed to build an oilfield driver scorecard that works. The question is whether you will build it manually in spreadsheets that require constant maintenance, or implement it through an automated platform that calculates scores from live data every day. Either approach is better than no scorecard at all. But only automation delivers the daily update frequency, the driver self-service visibility, and the scalability that makes scorecards sustainable as your fleet grows. Your drivers are making hundreds of driving decisions every single shift. The scorecard is how you make sure those decisions are moving your fleet in the right direction.
Stop guessing about driver performance. FleetRabbit builds automated scorecards from your existing telematics data, fuel cards, and inspection records. Every driver gets a personal dashboard. Every manager gets fleet-wide visibility. Every coaching conversation starts with objective data. Start your free trial today and see your first driver scores within 24 hours of connecting your data.







