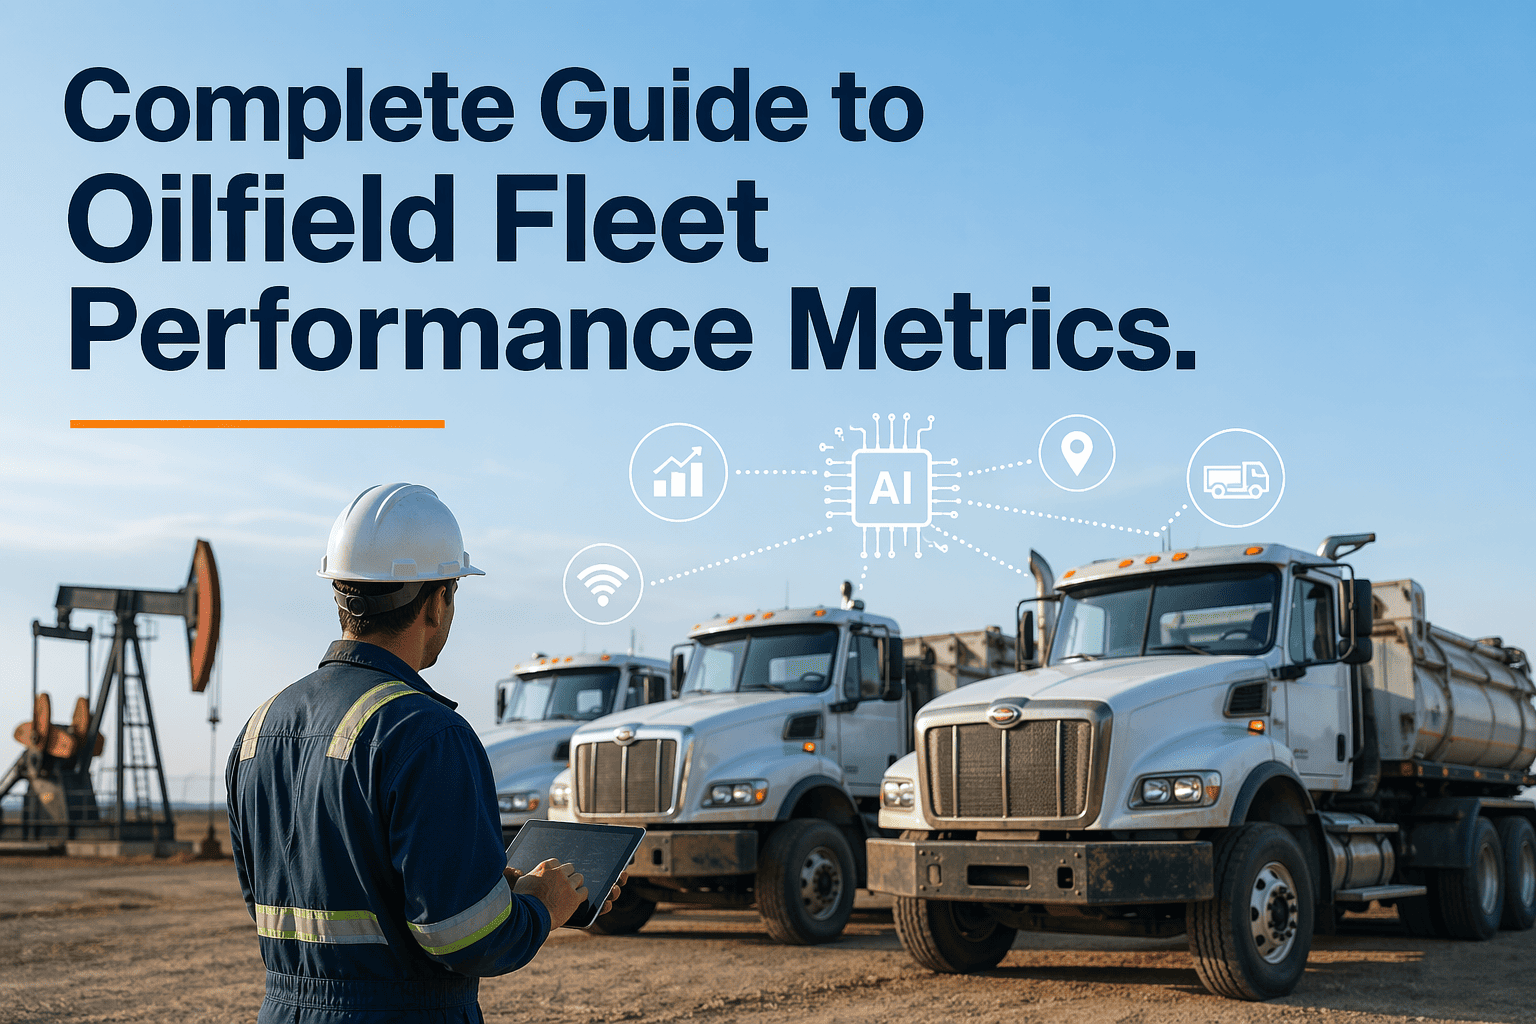
Oilfield profitability hinges on measurable performance — yet most operators lack real-time visibility into fleet utilization, fuel efficiency, maintenance costs, and equipment productivity. Manual tracking creates data lag, inconsistent metrics, and missed optimization opportunities. FleetRabbit's performance analytics platform delivers unified KPI dashboards, automated benchmarking, predictive insights, and executive reporting — transforming raw operational data into actionable intelligence that drives cost reduction, productivity gains, and strategic decision-making. Schedule a consultation to benchmark your fleet performance.
Document HeaderComplete Guide to Oilfield Fleet Performance Metrics
FleetRabbit transforms operational data into strategic advantage — delivering real-time KPI visibility, automated benchmarking, predictive analytics, and executive dashboards that help oil and gas operators maximize fleet productivity, minimize costs, and drive continuous improvement across all asset classes.
Executive Brief
Performance metrics are the foundation of operational excellence in oilfield fleet management. Without accurate, timely data on utilization rates, fuel consumption, maintenance costs, and equipment productivity, operators cannot identify inefficiencies, justify capital investments, or demonstrate ROI to stakeholders. FleetRabbit's analytics platform consolidates telematics, fuel cards, maintenance logs, and operational data into unified KPI dashboards — enabling fleet managers to optimize daily operations and executives to make data-driven strategic decisions with confidence.
Essential Performance Metrics for Oilfield Fleet Operations
Asset Utilization Rate
Percentage of time equipment is actively generating value vs. idle or in transit. Target: 75-85% for mobile assets. FleetRabbit tracks GPS-based activity status, distinguishes productive work from deadhead travel, and flags underutilized assets for redeployment or disposal decisions.
Fuel Efficiency (MPG/kWh per Unit)
Fuel or energy consumed per operational hour, mile, or production unit. Enables benchmarking across similar equipment and identification of inefficient operators or maintenance needs. FleetRabbit correlates fuel card data with telematics to calculate precise efficiency metrics by vehicle, route, and operator.
Maintenance Cost per Operating Hour
Total maintenance spend divided by equipment runtime. Critical for lifecycle cost analysis and replacement timing decisions. FleetRabbit integrates CMMS data with operational hours to track maintenance costs in real-time, alerting managers when costs exceed predictive thresholds.
Safety Incident Rate (TRIR/LTIR)
Total Recordable Incident Rate and Lost Time Incident Rate per 200,000 work hours. Leading indicator of operational risk and compliance posture. FleetRabbit automates incident logging, calculates rates by fleet segment, and correlates safety metrics with training records and equipment age for root cause analysis.
Equipment Productivity Index
Output units (barrels, feet drilled, tons moved) per operational hour. Measures true operational effectiveness beyond simple utilization. FleetRabbit integrates production data from SCADA systems with equipment runtime to calculate productivity metrics that directly tie fleet performance to revenue generation.
Regulatory Compliance Score
Percentage of fleet meeting all applicable regulatory requirements (emissions, inspections, certifications). Proactive metric preventing violations before they occur. FleetRabbit tracks compliance deadlines, certification expirations, and emissions data to generate real-time compliance scores with automated remediation alerts.
How FleetRabbit Transforms Metrics into Actionable Intelligence
Unified KPI Dashboard
Single-pane visibility into all critical fleet metrics with customizable widgets for role-specific views. Fleet managers see operational KPIs; executives see financial and strategic metrics. Drill-down capability from fleet-level summaries to individual asset performance. Real-time data refresh ensures decisions based on current conditions, not yesterday's reports.
- Drag-and-drop dashboard customization
- Role-based access controls and data views
- Mobile-optimized responsive design
- Export capabilities for presentations and reports
AI-Powered Trend Analysis
Machine learning algorithms identify performance trends, anomalies, and correlations invisible to manual analysis. Predict equipment failures before they occur, forecast fuel consumption based on operational patterns, and identify optimization opportunities through historical benchmarking. FleetRabbit's AI engine continuously learns from your operational data to improve prediction accuracy over time.
- Anomaly detection for early issue identification
- Seasonal pattern recognition for proactive planning
- Correlation analysis between metrics (e.g., maintenance frequency vs. fuel efficiency)
- Forecasting models for budget and resource planning
Industry & Internal Benchmarking
Compare your fleet performance against anonymized industry aggregates or internal historical baselines. Identify top-performing assets, operators, or regions and replicate success factors across the organization. FleetRabbit's benchmarking engine normalizes data for fair comparisons across different equipment types, operating conditions, and geographic regions.
- Peer group benchmarking by equipment class and region
- Historical trend comparison for continuous improvement tracking
- Best practice identification from top-quartile performers
- Custom benchmark creation for unique operational scenarios
Automated Reporting & Alerts
Schedule automated KPI reports delivered to stakeholders via email, dashboard, or mobile notification. Configure threshold-based alerts for metrics requiring immediate attention — fuel efficiency drops, maintenance cost spikes, or utilization declines. FleetRabbit eliminates manual report generation, ensuring consistent, timely performance communication across the organization.
- Customizable report templates and delivery schedules
- Multi-channel alert routing (email, SMS, push notification)
- Escalation rules for unaddressed metric deviations
- Audit trail of all report generations and alert acknowledgments
Executive Dashboard: Strategic Metrics for Leadership
Financial Performance Overview
Operational Excellence Indicators
Risk & Compliance Metrics
Case Study: Permian Operator Achieves 31% Productivity Gain
Data-Driven Optimization Delivers $1.2M Annual Savings
Independent producer — 42-vehicle fleet across West Texas — implemented FleetRabbit performance analytics Q1 2024
Implementation Approach
FleetRabbit Platform: Performance Management Capabilities
Automated Data Integration
Seamlessly connect telematics, fuel cards, maintenance systems, production data, and HR records. FleetRabbit's API-first architecture eliminates manual data entry, ensuring KPIs reflect accurate, comprehensive operational reality.
Custom KPI Builder
Define organization-specific metrics beyond standard templates. Create composite indices, weighted scorecards, and custom calculations that align with your unique operational priorities and strategic objectives.
Trend Visualization & Forecasting
Interactive charts and graphs reveal performance patterns over time. Predictive models forecast future metric trajectories, enabling proactive planning for maintenance budgets, fuel procurement, and capital replacement cycles.
Collaborative Performance Reviews
Share dashboards with stakeholders, annotate insights, and track action items directly within the platform. FleetRabbit transforms performance data from static reports into dynamic conversation starters that drive organizational improvement.
Multi-Location & Multi-Entity Support
Consolidate performance data across geographic regions, business units, or joint venture partners. Compare performance across entities while respecting data access controls and organizational boundaries.
Audit-Ready Documentation
Every metric calculation, data source, and report generation is logged with timestamps and user attribution. FleetRabbit provides defensible documentation for internal audits, regulatory reviews, and investor reporting.
Implementation Roadmap: From Data to Decisions
Foundation & Integration
- Connect data sources: telematics, fuel cards, CMMS, production systems
- Configure baseline KPI definitions and calculation logic
- Establish user roles, permissions, and dashboard views
- Validate data accuracy through parallel manual/automated reporting
Adoption & Optimization
- Train fleet managers and executives on dashboard navigation and interpretation
- Configure automated reports and threshold-based alerts
- Conduct first performance review cycles using FleetRabbit data
- Refine KPI definitions based on initial operational feedback
Scale & Strategic Integration
- Expand dashboard access to additional stakeholders and locations
- Integrate performance metrics into capital planning and budgeting processes
- Enable predictive analytics and AI-powered recommendations
- Establish continuous improvement cycles with quarterly KPI reviews
Transform Your Fleet Data into Strategic Advantage
Stop guessing about fleet performance. Start optimizing with confidence. FleetRabbit's performance analytics platform delivers the visibility, insights, and intelligence oil and gas operators need to maximize productivity, minimize costs, and drive continuous improvement across all fleet operations.
Frequently Asked Questions
How does FleetRabbit handle data from multiple telematics and fuel card providers?
FleetRabbit's integration engine normalizes data from all major telematics (Geotab, Samsara, Verizon Connect) and fuel card providers into unified KPI calculations. No data silos — all metrics reflect comprehensive fleet performance regardless of underlying data sources.
Can we customize KPIs to match our unique operational priorities?
Absolutely. FleetRabbit's custom KPI builder lets you define organization-specific metrics, composite indices, and weighted scorecards. Create metrics that align with your strategic objectives, not just industry standards.
How quickly can we see ROI from implementing performance analytics?
Most customers identify actionable optimization opportunities within 30 days. Typical ROI timeline: 3-4 months for fuel efficiency gains, 6-8 months for maintenance cost reductions, 12 months for strategic capital planning improvements.
Does FleetRabbit support multi-entity or joint venture reporting structures?
Yes. Configure separate data views, permissions, and dashboards for different business units, geographic regions, or joint venture partners. Consolidate reporting at the executive level while maintaining operational autonomy where needed.
How does predictive analytics work for maintenance and failure forecasting?
FleetRabbit's AI models analyze historical maintenance records, operational patterns, and equipment telemetry to identify failure precursors. The system flags assets with elevated risk profiles, enabling proactive maintenance before costly breakdowns occur.
Can executives access performance data on mobile devices?
Yes. FleetRabbit's responsive design delivers full dashboard functionality on smartphones and tablets. Executives can monitor KPIs, review reports, and receive alerts anywhere — no desktop required for strategic oversight.
Measure What Matters. Optimize What Counts.
FleetRabbit transforms operational data into strategic intelligence — empowering oil and gas operators to maximize fleet performance, minimize costs, and drive continuous improvement through data-driven decision-making. Start your performance optimization journey today.







