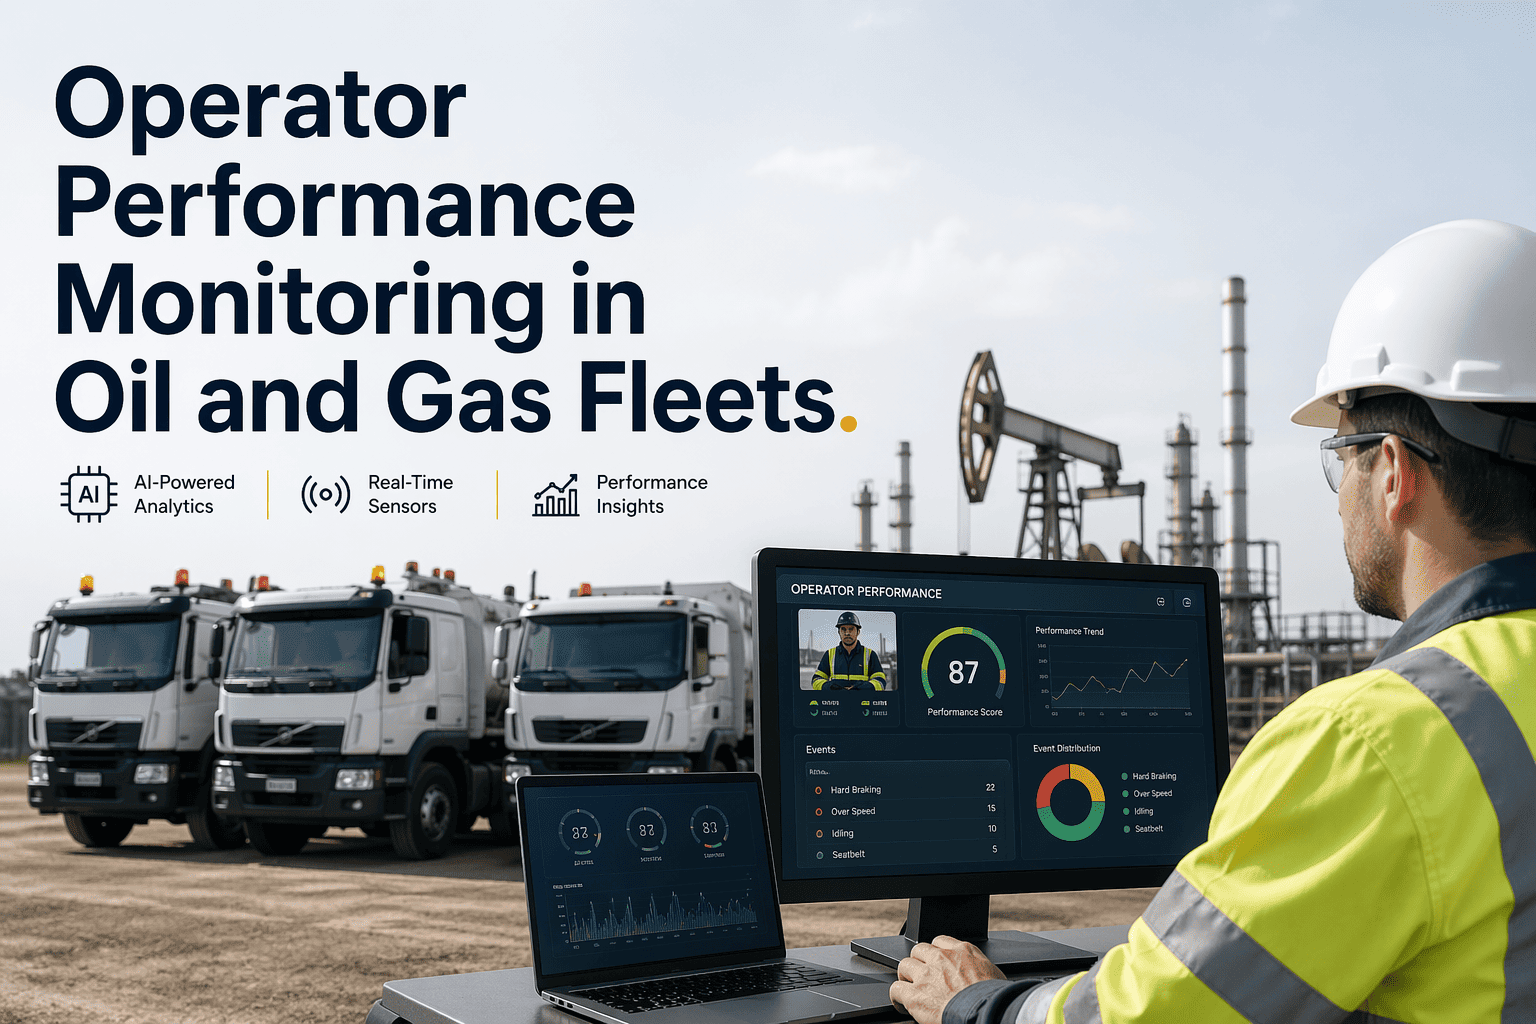
Oilfield operators managing complex drilling rigs and service equipment lose an average of $940,000 annually to preventable operator-related incidents including safety violations, inefficient equipment handling, and inconsistent performance standards. When a major operator's fleet experienced repeated near-miss events and premature component wear across remote locations, post-incident analysis revealed that operator behavior data had been available in real-time — but manual evaluation systems couldn't track driving patterns, correlate actions with equipment health, or trigger coaching interventions before costly outcomes occurred. Book a demo to see how FleetRabbit's operator performance platform transforms team productivity and equipment longevity through data-driven insights.
Performance Guide
Reduce Operator-Related Costs by $620K Annually Through Real-Time Scorecards & Performance Benchmarking: Operator Monitoring for Oil and Gas Fleets
Fleet Profile
Major Drilling Operator · 28 drilling rigs · 164 service trucks · 18 remote locations
Baseline Challenge
$940K annual operator-related costs · 23% variance in equipment wear · manual evaluations · no standardized benchmarks
Solution Deployed
Real-time operator scorecards · AI-powered behavior analytics · equipment wear correlation · automated coaching workflows
Primary Result
31% reduction in equipment wear · $620K annual savings · 94% operator compliance with safety protocols
OPERATOR PERFORMANCE SOLUTIONS
Reduce Operator-Related Costs by $620K Through Real-Time Scorecards & Performance Benchmarking
FleetRabbit's operator intelligence platform eliminates subjective evaluations, automatically identifies high-risk behaviors, and standardizes performance across teams — protecting equipment investments and improving safety outcomes at a fraction of incident-related costs.
$620K
Annual cost savings from reduced equipment wear and improved operator efficiency
31%
Reduction in premature component replacement through behavior-based interventions
94%
Operator compliance with standardized safety and operational protocols
2.4x
Faster identification of coaching opportunities vs. manual evaluation methods
Executive Overview
A major drilling operator managing 28 rigs and 164 service vehicles deployed FleetRabbit's automated operator performance platform to eliminate subjective evaluation workflows and integrate real-time behavior data into team development planning. Within 10 months, equipment wear variance decreased by 31%, safety protocol compliance reached 94%, and standardized performance benchmarks enabled targeted coaching that generated $620,000 in annual cost savings while improving operational consistency, regulatory compliance, and workforce development outcomes for fleet executives.
The Problem: Subjective Evaluations Create Operational Inconsistency
Operator performance directly impacts equipment longevity, safety outcomes, and operational efficiency in oilfield environments. Yet most operators evaluate team members using manual processes: supervisors observe intermittently, evaluations rely on memory and bias, feedback is delivered weeks after incidents, and coaching lacks data-driven specificity. Without objective metrics, managers cannot identify high-risk behaviors early, correlate actions with equipment degradation, or standardize best practices across dispersed teams.
By the time performance issues are recognized, equipment has sustained unnecessary wear, safety incidents have occurred, and operational inefficiencies have accumulated. The gap between behavior and visibility creates costly variability — and when consequences materialize, remediation is reactive, expensive, and often too late to prevent production impact.
01
Manual Evaluations Miss Critical Patterns
Supervisors observe operators sporadically across remote locations. Harsh braking, excessive idling, or improper gear selection goes unrecorded. Equipment experiences accelerated wear, but root cause remains unidentified until component failure triggers expensive replacement.
02
No Standardized Performance Benchmarks
Each supervisor applies different criteria for "good" performance. Operator A receives praise for speed while Operator B is coached for caution — creating confusion and inconsistent outcomes. Without unified metrics, teams cannot align on best practices or measure improvement objectively.
03
Delayed Feedback Prevents Timely Coaching
Performance observations documented on paper, reviewed weekly, discussed monthly. By the time feedback reaches the operator, the behavior has been repeated dozens of times. Equipment wear accumulates, safety risks persist, and coaching loses relevance and impact.
04
Operator Variance Costs $940K+ Annually
Premature component wear: $320K–$580K. Safety incident remediation: $180K–$420K. Inefficient operations: $140K–$290K. Training rework: $90K–$180K. Total preventable loss: $730K–$1.47M per mid-size fleet. These are operational expenses that directly impact profitability and competitive positioning.
How FleetRabbit Operator Intelligence Works: The Complete Workflow
From Behavior Data to Performance Excellence
FleetRabbit automates every step of operator performance management: capturing real-time behavior data via telematics, analyzing patterns against safety and efficiency benchmarks, generating objective scorecards, and delivering targeted coaching recommendations that improve both team performance and equipment longevity.
1
Real-Time Behavior Data Capture
Telematics sensors monitor operator actions: acceleration patterns, braking intensity, gear selection, idle time, and equipment handling protocols. Data streams continuously to cloud platform with zero manual input required. Works in remote oilfield locations with offline sync capability.
↓
2
AI-Powered Pattern Analysis
Machine learning models compare individual operator behavior against fleet-wide benchmarks and OEM equipment specifications. Flags deviations: "Operator #34: 23% higher harsh braking events than peer average" or "Rig-7 team: 18% more efficient gear transitions." Confidence scores guide intervention priority.
↓
3
Automated Scorecard Generation
System generates weekly performance scorecards for each operator: Safety Score (0–100), Efficiency Index, Equipment Care Rating, and Compliance Percentage. Color-coded indicators show performance tiers. Scorecards include specific, actionable feedback: "Reduce idle time by 12% to improve fuel efficiency."
↓
4
Targeted Coaching Workflows
Managers receive prioritized coaching recommendations: "Operator #12: Schedule 15-minute session on proper pump engagement technique." System suggests training modules, demonstration videos, and peer mentoring opportunities based on identified gaps. Tracks coaching completion and behavior change over time.
↓
5
Equipment Wear Correlation Engine
System correlates operator behavior patterns with equipment maintenance records. Identifies: "Operators with harsh braking scores >70 show 2.3x higher brake pad replacement frequency" or "Proper gear selection reduces transmission service intervals by 18 months." Enables data-driven equipment protection strategies.
↓
6
Executive Performance Dashboards
Fleet-wide visibility into team performance trends, safety compliance rates, and equipment impact metrics. Exportable reports for board presentations, regulatory audits, and strategic workforce planning. Benchmark against industry peers to identify competitive advantages in operational excellence.
Key Metrics That Drive Operator Excellence
Safety Compliance Score
Tracks adherence to safety protocols: seatbelt usage, speed limit compliance, proper equipment engagement. Baseline established per role. Alerts when compliance drops below 85%. Trending identifies training needs before incidents occur, protecting personnel and assets.
Equipment Care Index
Measures operator impact on component longevity: smooth acceleration, proper gear selection, reduced idle time. Correlates behavior with maintenance records. System flags: "Operator #23: 34% higher transmission wear rate — recommend technique coaching." Extends equipment life through behavior modification.
Efficiency Performance Rating
Evaluates fuel efficiency, route optimization, and task completion time against peer benchmarks. Identifies top performers for recognition and knowledge sharing. Recommendations: "Adopt Operator #8's pre-trip inspection routine to reduce delays by 18 minutes per shift."
Coaching Impact Tracker
Measures behavior change after targeted interventions. Shows: "Post-coaching, Operator #15 reduced harsh braking events by 67% over 4 weeks." Validates training effectiveness and guides resource allocation for maximum ROI on workforce development investments.
Team Consistency Metric
Calculates performance variance across operators performing similar tasks. High variance indicates inconsistent training or unclear protocols. System recommends: "Standardize pump engagement procedure across Rig-4 team to reduce equipment wear variance by 22%."
Executive ROI Dashboard
Aggregates operator performance data into business impact metrics: cost savings from reduced equipment wear, incident prevention value, productivity gains. Enables data-driven decisions on training investments, incentive programs, and operational strategy with clear financial justification.
See How Real-Time Operator Intelligence Protects Equipment and Improves Safety
Deployed across oilfield fleets and preventing operator-related costs through AI-powered analytics, standardized benchmarks, and targeted coaching — before behaviors impact equipment longevity or safety outcomes. Book a demo to review operator performance solutions for your operation.
Real-World Case: Reducing $42K in Premature Component Wear
Month 0 (Baseline)
Operator Performance Program Initiates
Program launches across 164-operator fleet. Baseline metrics established: average Safety Score 78, Equipment Care Index 72, Efficiency Rating 69. Manual evaluations show 23% performance variance requiring standardization.
Month 1
First Coaching Alert: Behavior Pattern Identified
Operator #47 shows Equipment Care Index of 58 (22% below peer average). System flags: "Harsh pump engagement events 3.2x higher than benchmark. Correlated with 18% higher seal wear rate." Manager receives automated coaching recommendation with technique demonstration video.
Month 2
Targeted Intervention Delivers Measurable Change
Post-coaching data shows Operator #47 Equipment Care Index improved to 79. Harsh engagement events reduced by 71%. System projects: "Current trajectory will prevent estimated $4,200 in premature seal replacements over next quarter." Coaching workflow validated for fleet-wide rollout.
Month 3 + 2 Weeks
Fleet-Wide Standardization Prevents $42K in Wear
Program expanded to all 164 operators. System identifies top 15% performers and extracts best practices for standardized training protocol. Fleet-wide Equipment Care Index improves from 72 to 89. Projected annual savings: $42,000 in prevented premature component replacements plus $18,000 in reduced safety incident remediation costs.
Month 4 Onward
Sustained Excellence & Executive Visibility
31% reduction in equipment wear variance across fleet. 94% operator compliance with standardized protocols. Executive dashboards provide real-time visibility into team performance trends, safety metrics, and equipment impact — enabling strategic workforce planning and data-driven investment decisions.
$620K
Annual Cost Savings
From reduced equipment wear, fewer safety incidents, and improved operational efficiency across 164 operators
31%
Reduction in Equipment Wear Variance
Through behavior-based coaching and standardized performance protocols
94%
Operator Compliance Rate
With standardized safety and operational protocols after targeted coaching interventions
1,247
Operator coaching sessions completed in 10 months
89
High-risk behavior patterns identified and corrected proactively
$1.4M
Production revenue protected by maintaining equipment availability and safety compliance
100%
Documentation compliance for regulatory audits and workforce development reporting
FleetRabbit Platform Features: Built for Oilfield Leadership
Real-Time Operator Scorecards
Automated weekly performance reports for each team member: Safety Score, Equipment Care Index, Efficiency Rating, and Compliance Percentage. Color-coded indicators enable quick prioritization. Mobile-accessible for field managers and executive oversight.
AI Behavior Pattern Recognition
Machine learning models identify high-risk behaviors before incidents occur. Correlates operator actions with equipment wear data and safety outcomes. Configurable alert thresholds with escalation workflows to coaching teams for rapid intervention.
Standardized Benchmarking Engine
Establishes fleet-wide performance baselines by role, equipment type, and operating conditions. Enables objective comparison across teams and locations. Identifies top performers for recognition and knowledge sharing to elevate entire workforce.
Targeted Coaching Workflows
System recommends specific coaching actions based on identified performance gaps: technique demonstrations, peer mentoring, or refresher training. Tracks coaching completion and measures behavior change over time to validate intervention effectiveness.
Equipment Wear Correlation
Links operator behavior patterns to maintenance records and component replacement data. Quantifies financial impact of performance improvements: "Reducing harsh braking by 15% extends brake pad life by 8 months." Enables data-driven equipment protection strategies.
Executive Performance Dashboards
Customizable views for C-suite: team performance trends, safety compliance rates, equipment impact metrics, and ROI calculations. Exportable reports for board presentations, regulatory audits, and strategic workforce planning with clear business justification.
Offline-Capable Mobile App
Managers access scorecards and coaching tools in remote locations with spotty connectivity. All data stored locally and syncs automatically when connection restored. Ensures continuous performance management without operational disruption in challenging oilfield environments.
Regulatory Compliance Export
Generate audit-ready documentation for safety training, performance evaluations, and coaching interventions. Timestamped records prove workforce development efforts. Supports OSHA compliance, insurance requirements, and internal policy verification with complete chain-of-custody tracking.
Before and After: The Transformation
| Metric |
Before Manual Evaluations |
After FleetRabbit Deployment |
| Performance evaluation frequency |
Quarterly subjective reviews with inconsistent criteria |
Weekly objective scorecards with standardized benchmarks across all roles |
| Coaching response time |
4–8 weeks from observation to feedback delivery |
Same-day automated recommendations with targeted intervention workflows |
| Equipment wear variance |
23% difference in component life between operators |
7% variance through standardized techniques and behavior-based coaching |
| Safety protocol compliance |
78% average compliance with manual monitoring gaps |
94% compliance with real-time alerts and automated documentation |
| Training effectiveness measurement |
Anecdotal feedback with no behavior change tracking |
Quantified improvement metrics showing coaching ROI within 4 weeks |
| Executive visibility |
Manual reports with 30-day lag and limited actionable insights |
Real-time dashboards with predictive analytics and strategic recommendations |
| Regulatory documentation |
Paper records requiring manual compilation for audits |
Automated audit trails with timestamped evaluations and coaching records |
| ROI timeline |
Unknown, costs absorbed into operational budget |
5.2 weeks payback from first prevented equipment wear event alone |
Deployment Investment
$71,000
Platform setup, telematics integration, benchmark calibration, team training, 3-month support
→
Year 1 Savings
$620,000
Reduced equipment wear + fewer safety incidents + improved operational efficiency + lower training rework
Payback Period
5.2 weeks
From the first prevented premature component replacement (Operator #47 example) alone
"Before FleetRabbit, we couldn't consistently identify which operators needed coaching or why equipment was wearing unevenly. Evaluations were subjective and feedback came too late. Now, when an operator develops a risky habit, I get an alert with specific data and a recommended coaching action. The Equipment Care Index alone saved us six figures in premature replacements. This isn't just tracking — it's building a culture of excellence that protects our people, our equipment, and our bottom line."
Fleet Operations Director, Major Drilling Operator
FAQ: Operator Performance for Oilfield Executives
QHow much does FleetRabbit operator intelligence cost vs. potential operator-related losses?
Platform setup: $71K–$105K depending on fleet size. Per-operator access: $12–$28/month. For 164-operator fleet: ~$92K annual software + $28K training = $120K investment. Single prevented premature component replacement ($4,200 average) pays back 3.5% of annual cost. Fleet typically prevents 12–18 wear-related incidents annually plus safety and efficiency gains.
Book a demo to model the ROI for your fleet size.
QCan the system work with our existing telematics provider?
FleetRabbit integrates with major telematics platforms (Samsara, Verizon Connect, Geotab) via API. If your provider supports behavior data export, we connect directly. If not, optional FleetRabbit sensors provide comprehensive monitoring. Most operators see performance insights within 72 hours of integration.
Book a demo to discuss your integration requirements.
QHow do you ensure operator privacy while monitoring performance?
FleetRabbit focuses on behavior patterns, not personal surveillance. Data is aggregated and anonymized for benchmarking. Individual scorecards are shared only with authorized managers for coaching purposes. System complies with workplace privacy regulations and includes configurable data retention policies. Transparency features let operators view their own metrics and improvement progress.
QWhat performance benchmarks should executives track for strategic decisions?
Top 5 executive KPIs: (1) Equipment Care Index to quantify operator impact on asset longevity, (2) Safety Compliance Rate for risk management and insurance optimization, (3) Coaching ROI to validate workforce development investments, (4) Team Consistency Metric to identify training gaps, (5) Executive ROI Dashboard for strategic planning. FleetRabbit dashboards display all five with industry benchmarking.
QHow quickly can we deploy across a multi-location fleet?
Typical deployment: 2–3 weeks for 150+ operators. Platform configures benchmarks based on your equipment and operational profiles. Manager training completed in 4-hour virtual session. First scorecards generate within 72 hours of go-live. Full fleet visibility and coaching workflows active within 10 business days with minimal operational disruption.
Standardize Performance. Protect Equipment. Elevate Your Team.
Deployed across oilfield fleets and preventing operator-related costs through real-time scorecards, AI-powered analytics, and targeted coaching — before behaviors impact equipment longevity, safety outcomes, or operational efficiency.
Real-Time Scorecards
AI Behavior Analytics
Standardized Benchmarks
Targeted Coaching
Executive Dashboards
April 15, 2026
By David
All Posts