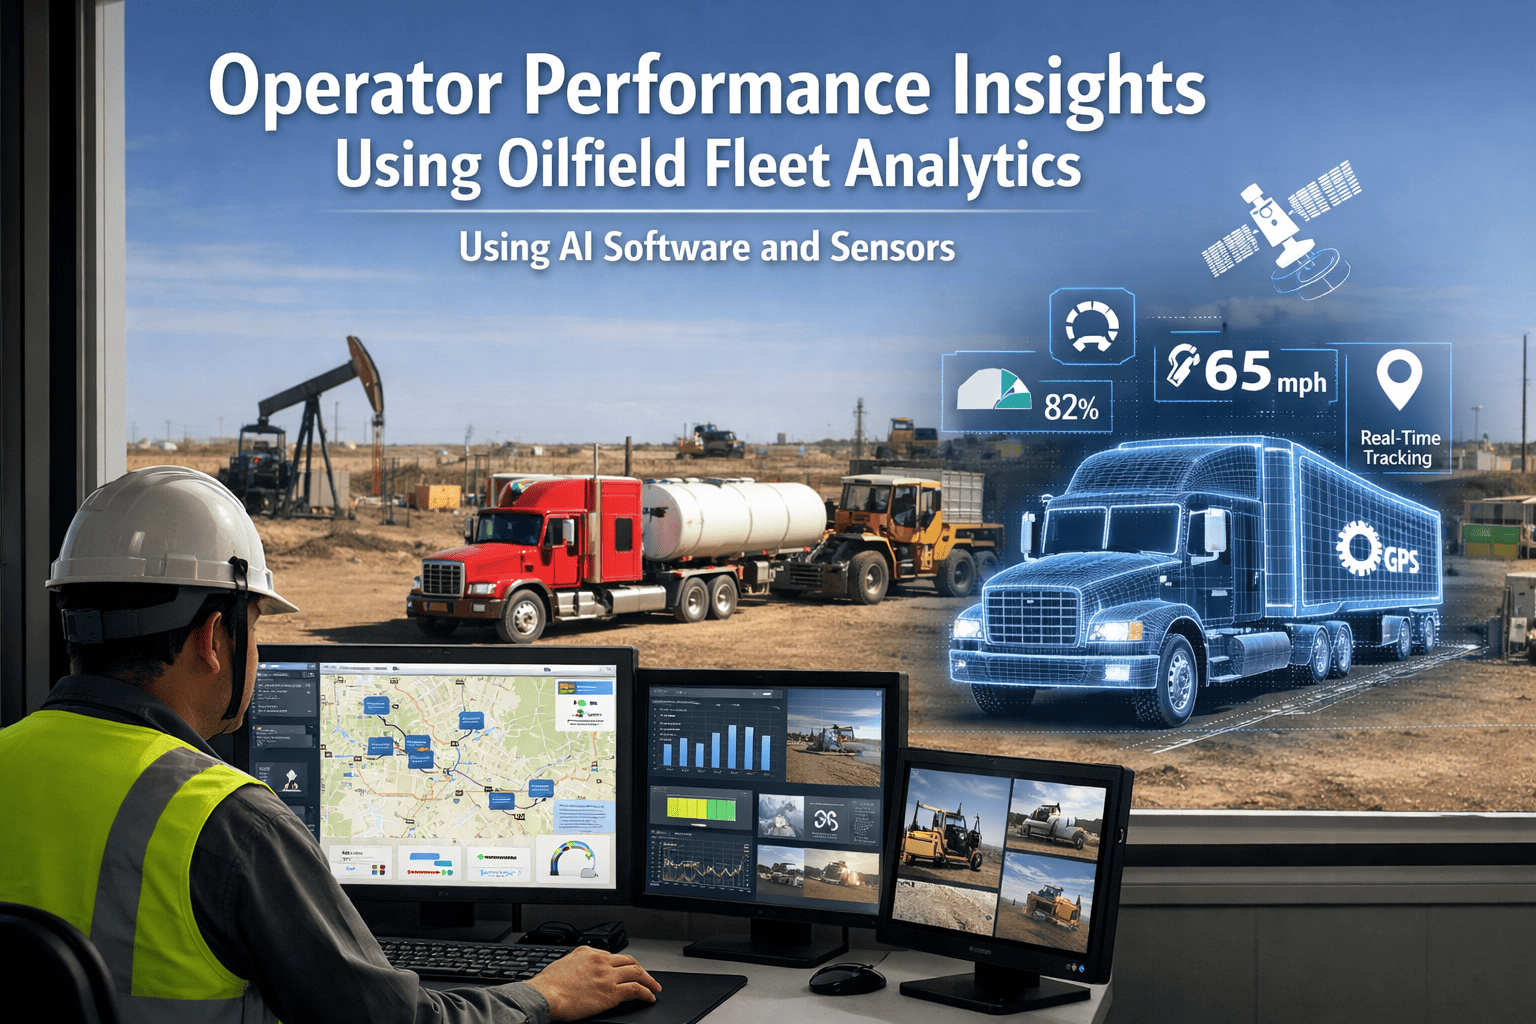
In oil and gas field operations, the difference between a high-performing driver and an average one is not talent — it is data. A wellhead service driver who consistently idles 5 hours per day, brakes harshly on gravel access roads, and overspeeds on pipeline corridors is invisible in a paper-based fleet management system until an incident occurs. By that point, the cost — vehicle damage, HSE investigation, insurance premium increase, or worse — has already been paid. FleetRabbit's operator performance analytics platform gives oil and gas fleet managers and operations directors the behavioural scorecards, equipment handling intelligence, and coaching frameworks needed to turn every driver in their fleet into a measurably safer and more efficient operator. Not through surveillance — through structured data, individual feedback, and progressive improvement tracking that drivers respond to because it is fair, transparent, and evidenced. Book a demo to see operator performance analytics applied to your oilfield fleet.
Quick Answer
FleetRabbit's operator performance platform tracks 12 core behavioural and equipment handling metrics for every driver across your oilfield fleet — speeding, harsh braking, rapid acceleration, cornering, seatbelt compliance, idle time, engine abuse indicators, load handling, route compliance, inspection completion, hours of service, and safety event frequency. Individual scorecards are generated automatically, coaching prompts delivered via mobile app, and manager dashboards rank performance across the full team — giving fleet managers and executives the data to reduce incidents, cut fuel costs, and protect HSE compliance simultaneously.
The True Cost of Unmonitored Operator Behaviour in Oilfield Fleets
Most oil and gas fleet managers intuitively know that driver behaviour varies significantly across their team — but without data, they cannot quantify it, target it, or improve it. The financial and safety consequences of unmonitored operator behaviour accumulate silently across three cost categories that never appear on a single invoice.
42%
Average reduction in speeding events within 60 days of deploying structured driver scoring and in-cab coaching alerts
£8,400
Average annual maintenance cost saving per vehicle from eliminating harsh braking and aggressive acceleration behaviour
22%
Reduction in fleet fuel consumption driven by idle time reduction and smooth driving coaching in oilfield fleet deployments
68%
Fewer serious vehicle incidents reported in FleetRabbit-deployed oilfield fleets within 12 months of platform activation
Core Metrics FleetRabbit Tracks for Every Oilfield Operator
Every metric below is tracked automatically in real time by FleetRabbit's telematics platform — no manual input, no driver self-reporting, no retrospective data assembly. Each metric feeds the individual driver scorecard that fleet managers and team leaders use for structured coaching conversations.
Safety Behaviour Metrics
Speeding Events
Number of speed threshold exceedances per journey — segmented by road type (access track, highway, wellpad zone). Configurable thresholds per operating area. In-cab alert delivered in real time on first exceedance per journey.
Fleet average: tracked per 100km | Individual ranking visible to manager
Harsh Braking Events
Deceleration events exceeding configurable G-force threshold — indicating late braking, distracted driving, or following too closely. On oilfield access roads, harsh braking is the primary leading indicator of near-miss events involving pedestrians and plant.
Threshold: typically 0.4G deceleration | Per-journey count + trend
Rapid Acceleration
Acceleration events exceeding configurable G-force threshold — a primary driver of fuel waste, tyre wear, and drivetrain stress. Particularly significant for heavy load vehicles (vacuum tankers, flatbed service trucks) where aggressive acceleration multiplies component wear disproportionately.
Threshold: typically 0.3G acceleration | Direct fuel cost linkage
Cornering Force Events
Lateral G-force exceedances during cornering — indicating excessive speed through bends, particularly hazardous on gravel wellpad access tracks with limited visibility. High cornering scores correlate strongly with tyre wear rates and rollover risk for tall-bodied oilfield service vehicles.
Fleet-specific threshold by vehicle type | Critical for HGV operators
Seatbelt Compliance
Real-time seatbelt sensor monitoring with immediate in-cab alert and event logging for any journey segment driven without seatbelt engaged. Critical for oilfield operations where rollover risk on loose-surface tracks is significantly higher than highway driving.
Zero tolerance metric | Automatic manager notification on any non-compliance
Distraction Events
Where dashcam integration is enabled, AI-detected distraction events (phone use, inattention) logged and timestamped. Without dashcam, erratic speed/acceleration patterns flag potential distraction periods for review. Manager-only visibility to ensure proportionate use.
Dashcam integration optional | Privacy-appropriate flagging protocol
Equipment Handling Efficiency Metrics
Idle Time per Operating Day
Engine-on stationary time expressed as hours per operating day and cost in £/$ per period. In oilfield operations, high idle time is often legitimate (PTO operation, cab heating) but excessive idle at times and locations inconsistent with operational requirements is flagged for review. Contextual idle tracking avoids false coaching conversations.
Cost-attributed | Fleet benchmark comparison | Driver coaching target
Engine Over-Rev Events
RPM exceedances above manufacturer recommended range tracked per journey. Engine over-revving indicates poor gear selection discipline — a direct predictor of premature clutch, gearbox, and engine wear. Particularly significant for heavy goods vehicles on gradient oilfield access roads where wrong gear selection is most common.
OBD-II sourced | Per-journey count | Work order trigger linkage
Fuel Efficiency per Journey
Actual fuel consumption vs expected baseline for vehicle type, load, and route — highlighting operators whose driving style consistently consumes more fuel than fleet average on equivalent routes. Individual fuel efficiency ranking visible to fleet managers for targeted coaching intervention.
Baseline-adjusted per vehicle type | Monthly trend | Cost attribution
Pre-Trip Inspection Completion Rate
Percentage of required pre-trip and post-trip inspections completed on time with mandatory photo evidence per driver. Inspection non-completion is a leading indicator of both compliance risk and driver disengagement — tracked individually and reported to fleet managers and HSE leads automatically.
100% completion target | Non-completion escalated immediately | Audit linkage
Hours of Service Compliance
Daily and weekly driving hours tracked against legal and company limits — with fatigue risk flags generated when accumulated hours approach thresholds before the next shift begins. Critical in 24/7 oilfield operations where shift pattern pressures create the highest fatigue risk environments in road transport.
Pre-shift fatigue flag | Regulatory limit tracking | Shift planner integration
Route Compliance and Unauthorised Deviation
Geofence-based route compliance tracking flags unauthorised deviations from approved routes and off-site movements outside operational hours. Particularly relevant for vehicles carrying hazardous materials (chemicals, hydrocarbons) where route compliance is a regulatory requirement under ADR and equivalent frameworks.
Geofence-configured | ADR route compliance | After-hours movement detection
12-Metric Operator Scorecard
Every Driver Scored. Every Journey Tracked. Every Manager Informed.
FleetRabbit automatically generates individual operator scorecards from real telematics data — giving fleet managers and team leaders the structured data needed for evidence-based coaching that drivers accept because it is fair and transparent.
42%
Speeding Event Reduction
Role of Fleet Analytics in Operator Performance Monitoring
Raw telematics data alone does not improve operator performance — it is the system that converts data into structured insight, delivers individual feedback at the right moment, and tracks improvement over time that creates behavioural change. FleetRabbit's operator performance architecture is designed around this principle: data collection is automatic, insight delivery is contextual, and coaching is progressive rather than punitive.
Data
Continuous Behavioural Data Collection
12 operator metrics captured automatically via OBD-II telematics every 60 seconds — no manual input, no self-reporting. Data collected regardless of cellular connectivity with offline sync on return to coverage. Every journey logged against driver ID, vehicle, route, and timestamp.
Score
Individual Operator Scorecard Generation
Weighted composite score (0–100) calculated per driver per period — balancing safety events, equipment handling efficiency, compliance metrics, and fuel performance. Scores baseline-adjusted for vehicle type and operational environment to ensure fair comparison between drivers on different duty types.
Coach
Real-Time In-Cab Coaching Alerts
Threshold breach events trigger immediate in-cab mobile alerts — delivered to the driver at the moment of the behaviour, not days later in a manager meeting. Alert wording is coaching-framed rather than punitive. Repeat thresholds within a single journey are tracked but alerts spaced to avoid distraction.
Review
Post-Journey Summary and Driver Self-Review
Each driver receives a post-journey summary on their FleetRabbit mobile app — showing their score, specific events, and comparison to their own previous period trend. Drivers can see their own data at any time, creating self-coaching awareness between formal manager review conversations.
Escalate
Manager Escalation for Persistent Underperformance
Configurable thresholds trigger automatic escalation to fleet managers when a driver's score falls below defined minimum, or when specific safety metrics (seatbelt non-compliance, severe speeding) breach zero-tolerance levels. Escalation notifications include the full data record for evidence-based HR conversations.
Report
Executive Team Performance Dashboard
Fleet-wide operator performance summary delivered automatically to operations directors and safety leads — team average score trend, top and bottom quartile identification, incident frequency correlation, and improvement trajectory over rolling 12-week periods. No manual compilation required.
How FleetRabbit Operator Scorecards Differ from Generic Telematics Scoring
Most fleet telematics systems produce a single composite driver score derived from event counts — without contextualising the data for vehicle type, operational environment, or duty cycle. An oilfield service driver completing wellpad deliveries on loose gravel tracks will always score worse on cornering metrics than a motorway driver in an identical vehicle. FleetRabbit's scoring engine addresses this through operational context adjustment.
Operational Context Adjustment
Scoring thresholds configured per vehicle type, duty cycle, and operating area. A vacuum tanker on wellpad access tracks is benchmarked against other wellpad operators — not against motorway HGV drivers. Scores reflect genuine performance variation, not operational environment variation.
Result: Coaching conversations that are operationally credible and driver-accepted
Improvement Trajectory Tracking
Scores trended over 4, 8, and 12 weeks — identifying drivers who are improving following coaching interventions and those whose scores are deteriorating despite intervention. Trend data is more actionable than point-in-time scores for progressive HR management.
Result: Evidence base for progression from informal coaching to formal HR process
Incident Linkage and Root Cause Evidence
Vehicle incidents automatically linked to the driver's performance record at the time of the event — providing HSE investigators and insurance claims managers with the behavioural context data (speed, braking, seatbelt, route) from the specific journey, not just the driver's historical average.
Result: Faster, more accurate HSE investigation outcomes and insurance claim defence
FleetRabbit Operator Performance — What Fleet Managers See vs What Executives See
The operator performance platform is designed to deliver the right level of insight to the right person — fleet managers need operational detail to run effective coaching conversations, while operations directors and HSE leads need strategic performance trends to make resource and training investment decisions.
- Individual driver scorecard with 12-metric breakdown per period
- Journey-by-journey event log — speeding, braking, acceleration, cornering per trip
- Inspection compliance status — completed, overdue, and defects logged per driver
- Hours of service status before each shift begins
- Seatbelt and zero-tolerance alert history with timestamps
- Idle time cost report by driver — weekly and monthly
- Driver score trend over 4, 8, 12 weeks for coaching conversation evidence
- Team ranking — top and bottom performers visible immediately
- Fleet-wide average safety score — current period vs prior period trend
- Incident frequency correlation with driver score distribution
- Training investment ROI — score improvement rate per coaching intervention
- High-risk driver identification — bottom quartile with deteriorating trend
- Fuel cost attributed to driver behaviour — idle, acceleration, and route waste
- HSE compliance rate across fleet — seatbelt, inspection, hours of service
- Insurance risk profile data — incident history linked to behaviour scores
- Automated weekly executive summary — delivered to inbox, no manual prep
Measured Operator Performance Outcomes Across Deployed Oilfield Fleets
42%
Reduction in Speeding Events within 60 Days
68%
Reduction in Serious Vehicle Incidents at 12 Months
22%
Fleet Fuel Cost Reduction via Behaviour Coaching
£8,400
Annual Maintenance Saving per Vehicle
100%
Inspection Compliance Rate After Digital Deployment
96%
Driver Platform Adoption Rate Within 30 Days
From the Field
"We had a strong suspicion that 3 or 4 of our 28 drivers were responsible for the majority of our vehicle wear and near-miss incidents — but without data, we couldn't act on it fairly. Within 6 weeks of deploying FleetRabbit, we had objective scorecard data for every driver. Two of them showed exactly what we expected — one had 47 speeding events in a month on wellpad access roads, the other had 31 harsh braking events per 100km. We had structured conversations supported by their own journey data. Both improved significantly within 60 days. The fuel savings from the wider behaviour improvement across the fleet paid for the platform within 3 months. The safety improvement was worth far more than that."
Fleet Manager
28-Vehicle Oilfield Services Fleet — Upstream Onshore Operations, UK
Frequently Asked Questions
QHow do drivers typically respond to being scored on their behaviour?
Driver acceptance depends entirely on how scoring is introduced and presented. FleetRabbit-deployed fleets consistently report high driver acceptance when three conditions are met: scores are communicated transparently before deployment begins, every driver can see their own data at any time via the mobile app, and coaching conversations are improvement-focused rather than disciplinary. When drivers see their own score improving, the system becomes motivating rather than threatening. 96% adoption rate within 30 days reflects this.
QCan operator scores be used in formal HR processes and disciplinary proceedings?
Yes — with appropriate process. FleetRabbit's telematics data provides timestamped, GPS-verified event records that have been used in formal HR proceedings and HSE investigations. The critical requirement is that the scoring criteria and thresholds are documented and communicated to drivers before the data collection period begins.
Discuss your HR policy integration in a scoping call.
QHow does FleetRabbit handle operator scoring in cellular dead zones on remote wellpads?
All telematics data — including behavioural event scoring — is captured and stored locally on the tracking unit and synchronised automatically when connectivity is restored. There are no data gaps in operator scoring for remote location journeys. Post-journey coaching summaries are delivered to drivers via the mobile app on reconnection, maintaining the immediate feedback loop even for dead-zone operations.
QCan FleetRabbit score contractor and owner-operator drivers alongside employed drivers?
Yes. FleetRabbit's multi-contractor architecture applies the same scoring framework to contractor-supplied drivers operating on your sites — with role-based access ensuring contractors can only see their own team's scores. This is increasingly important for oil company operators whose HSE standards require contractor driver performance evidence as part of ongoing contractor management.
QHow quickly does driver behaviour typically improve after FleetRabbit deployment?
Most oilfield fleets see measurable score improvement within 2–4 weeks of the first structured coaching conversations. Speeding events typically reduce fastest — 42% average reduction within 60 days. Idle time reduction follows at 4–8 weeks as drivers internalise the cost attribution data. Harsh braking improvement is the slowest — typically 8–12 weeks — as it requires habitual driving pattern change rather than just speed compliance.
See improvement benchmarks for your fleet size in a demo.
Turn Operator Behaviour Data into Measurable Safety and Cost Improvements.
FleetRabbit gives oil and gas fleet managers the operator scorecards, real-time coaching alerts, and executive reporting needed to systematically improve driver performance across every shift, every vehicle, and every location — including remote wellpads with no cellular coverage.
12-Metric Operator Scorecard
Real-Time Coaching Alerts
Equipment Handling Analytics
Executive Performance Reports
Offline Dead-Zone Coverage
April 11, 2026
By David
All Posts