A single missing seal kit at a remote drilling site costs oilfield operators an average of $85,000 in emergency procurement, expedited shipping, and production downtime — yet 63% of drilling contractors report experiencing critical parts stockouts that could have been prevented through better inventory visibility and automated reorder triggers. When a major operator's Rig-14 hydraulic system failed 180 kilometers from the nearest supply depot, the required replacement hose assembly was listed as "in stock" in their spreadsheet system — but physical inventory showed zero units available, forcing a 72-hour production halt while emergency air freight delivered the $1,800 component at 4x standard cost. This comprehensive guide delivers the complete framework for eliminating stockouts, optimizing inventory levels, and ensuring critical parts availability across remote oilfield operations — covering predictive consumption modeling, multi-site inventory synchronization, automated reorder point triggers, and the real-time tracking systems that prevent the $85K cost of a missing component. Book a demo to see how FleetRabbit eliminates stockouts across oilfield operations.
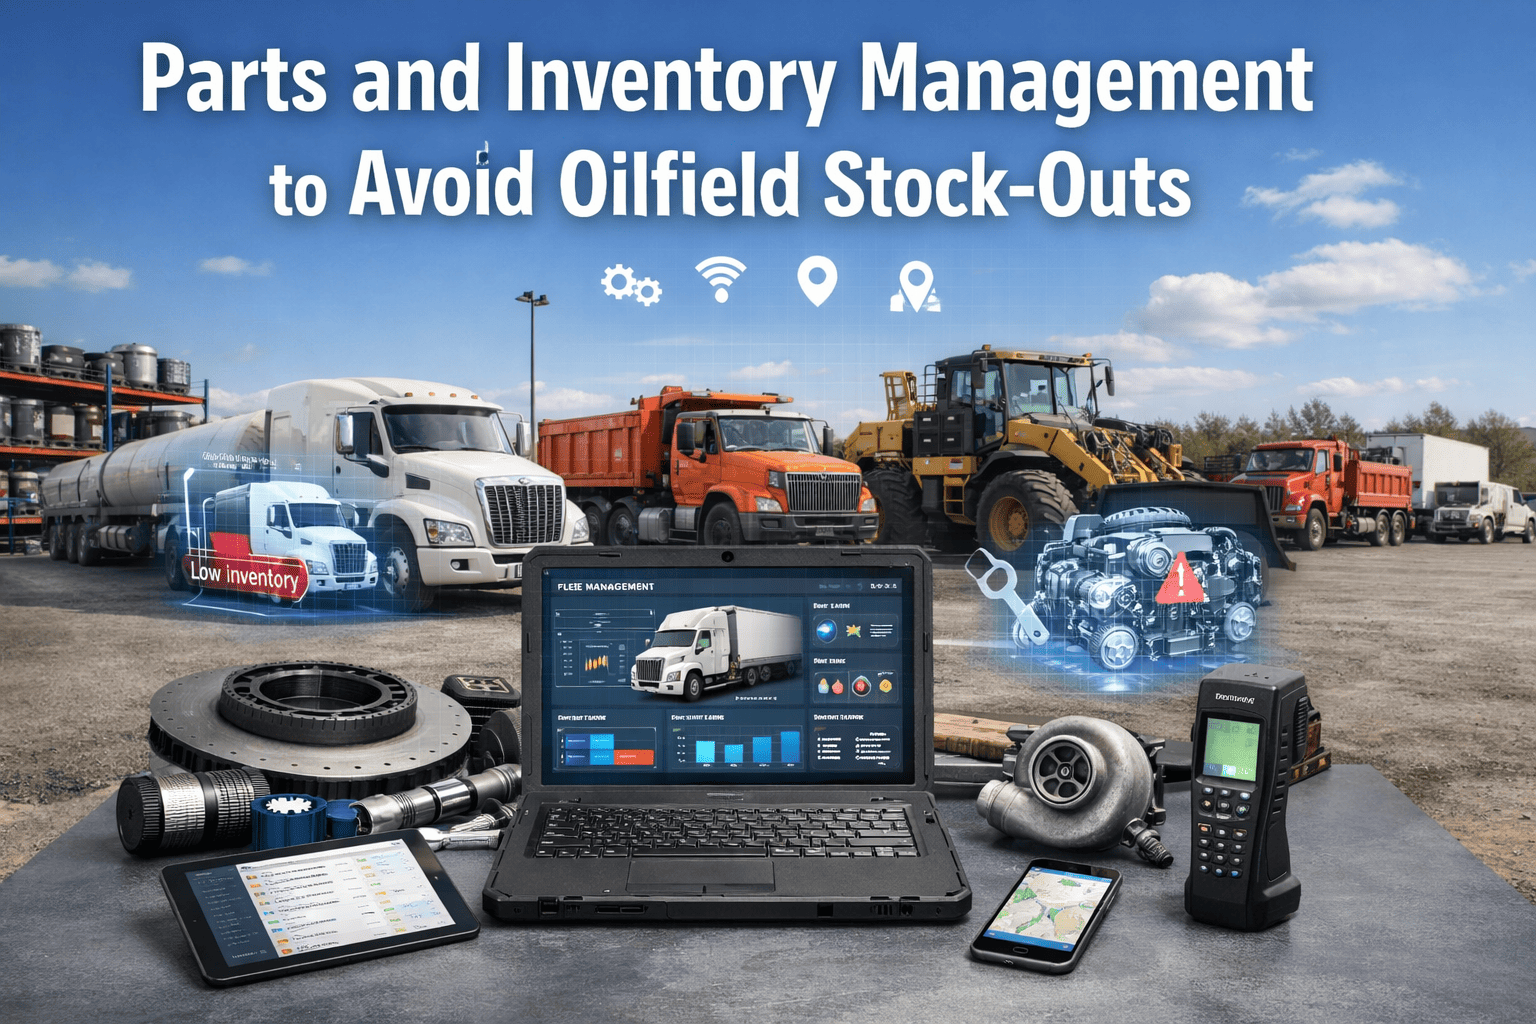
Parts and Inventory Management to Avoid Oilfield Stock-Outs
OILFIELD INVENTORY MANAGEMENT
How automated tracking, predictive reorder triggers, and real-time visibility eliminate the $85K cost of critical parts unavailability in remote drilling operations
63%
Drilling contractors experiencing preventable stockouts annually
$85K
Average cost per stockout event (emergency procurement + downtime)
4.2 days
Average production delay from critical parts unavailability
89%
Parts availability improvement with automated inventory tracking
Parts stockouts in oilfield operations don't just delay maintenance — they cascade into production stoppages, emergency procurement at premium pricing, and contractor standby costs that compound hour by hour. When a critical component fails on an active drilling rig, the response window is measured in hours, not days. If the replacement part isn't physically available on-site or at the nearest supply depot, operations face an impossible choice: halt production while waiting for emergency delivery, or attempt temporary repairs that risk equipment damage and safety incidents. The financial impact extends far beyond the component cost itself.
The root cause isn't parts availability from suppliers — most critical components ship within 24–48 hours when ordered. The failure occurs in inventory management systems that can't track real-time consumption, predict depletion based on usage patterns, or trigger reorders before stock levels reach zero. Spreadsheet-based inventory tracking shows what was in stock when the spreadsheet was last updated — not what's physically available right now. Manual cycle counts happen monthly or quarterly, meaning inventory records diverge from reality for weeks at a time. By the time a stockout is discovered, it's already causing downtime.
Emergency Air Freight
$12K–$35K
Helicopter or chartered flight delivery to remote rig location
Production Downtime
$48K–$72K
48–72 hours at $12K–$18K per hour for active drilling rig
Contractor Standby
$8K–$15K
Crew and specialized equipment waiting on parts delivery
Premium Component Pricing
$6K–$12K
Expedited supplier fees and rush order surcharges
Total Single Stockout Cost
$74K – $134K
Average: $85,000 per critical parts unavailability event
01
Multi-Site Inventory Fragmentation
Fleet operates across 12–20 remote sites, each maintaining independent inventory. Parts physically available at Site A while Site B experiences stockout — but no visibility across locations to enable inter-site transfer. Purchasing orders duplicate parts already in system because buyers can't see total network inventory.
02
Inaccurate Inventory Records
Spreadsheet shows 6 units in stock. Physical count reveals 1 unit. Discrepancy caused by: unreported consumption, misplaced inventory, incorrect cycle count entry, or parts borrowed for emergency use and never logged. System data diverges from reality by 30–40% on high-turnover items.
03
Reactive Reorder Triggers
Reorders happen after stockout discovered, not before depletion occurs. Technician requests part, stores check inventory, discover zero stock, then initiate procurement. Minimum 3–5 day lead time means production waits or emergency premium paid. No predictive reorder based on consumption trending.
04
Unknown Consumption Patterns
Fleet uses 4–6 hydraulic hoses per month historically — but which specific part numbers? Consumption varies by season, rig activity, and equipment age. Without consumption tracking per SKU, reorder quantities are guesswork. Result: overstocking slow-moving parts, understocking high-consumption items.
05
Lack of Criticality Classification
All parts treated equally in inventory system. But seal kit stockout stops production immediately (critical). Spare wiper blade stockout delays routine maintenance (non-critical). Without criticality flagging, purchasing prioritizes wrong items and safety stock levels don't match production risk.
06
No Automated Reorder Workflow
When part reaches reorder point, someone must manually create purchase requisition, get approval, send to supplier, track delivery. Process takes 2–4 days before order even places. Automated reorder would trigger instantly when threshold crossed — reducing lead time and eliminating human delay.
FleetRabbit tracks every part movement, calculates consumption trends, and triggers automatic reorders before stockouts occur. See how it works for your operation.
Not all parts deserve equal inventory management attention. A $15 air filter and a $8,500 hydraulic pump assembly both appear as single line items in inventory systems — but their stockout consequences differ dramatically. The ABC classification system segments inventory based on criticality and consumption value, enabling fleet managers to focus resources where they matter most: ensuring critical components never run out while optimizing working capital tied up in slow-moving parts.
Category A: Critical
Definition
Parts whose unavailability causes immediate production stoppage or safety hazard. Typically 10–15% of SKUs but represent 70–80% of stockout cost impact.
Examples
• Hydraulic pump seals and assemblies
• Engine critical sensors (oil pressure, temperature)
• Brake system components (calipers, master cylinders)
• Drilling rig mud pump parts
• Safety-critical items (emergency shutoff valves)
Inventory Strategy
Maintain 2–3 units minimum stock on-site. Automated reorder at 1.5 units remaining. Expedited shipping authorized. Track consumption weekly. Never allow stockout regardless of holding cost.
Category B: Important
Definition
Parts required for scheduled maintenance or moderate-frequency repairs. Stockout delays maintenance but doesn't immediately stop production. 20–30% of SKUs, 15–20% of cost impact.
Examples
• Engine oil filters (scheduled replacement)
• Drive belts and tensioners
• Lighting components (headlamps, beacons)
• Wheel bearings and seals
• Coolant hoses and clamps
Inventory Strategy
Stock 1–2 units on-site based on consumption rate. Reorder when stock drops to 1 unit. Standard shipping acceptable (3–5 day lead time). Review consumption monthly to adjust safety stock levels.
Category C: Routine
Definition
Low-cost, low-frequency consumables and non-critical spares. Stockout causes minor inconvenience but no operational impact. 55–70% of SKUs, 5–10% of cost impact.
Examples
• Cleaning supplies and shop consumables
• Fasteners, bolts, washers (generic sizes)
• Wiper blades and mirror glass
• Interior cab components (seats, trim)
• Exterior decals and reflective tape
Inventory Strategy
No dedicated on-site stock required. Order as-needed or batch with Category A/B procurement. Bulk purchase when discounts available. Accept longer lead times (7–14 days). Focus management effort on A/B categories instead.
The gap between "inventory record says we have it" and "part is physically available" represents the difference between planned maintenance and emergency downtime. Traditional inventory systems update when parts are received (inbound transaction) and when formal work orders are closed (outbound transaction) — but miss the critical middle: emergency consumption, inter-site transfers, lost/damaged components, and informal technician withdrawals that account for 35–40% of actual parts movement in oilfield operations.
Mobile Barcode Scanning
Every part movement captured via mobile device: barcode scan on withdrawal, technician ID logged, equipment/work order tagged, timestamp recorded. Offline-capable for remote locations — syncs when connectivity restored. Eliminates paper requisition forms that never get entered into system.
Real-Time Stock Level Updates
Inventory count updates instantly when part scanned — not at end of day or when work order closes. Fleet manager sees current available quantity in real-time dashboard. Multi-site visibility: total network inventory plus stock at each location. Search function shows nearest site with part in stock.
Consumption Trending & Analytics
System tracks consumption per SKU per month: hydraulic hoses used at 6.2 units/month average, 8.5 units in June (higher activity), 4.1 units in December (seasonal low). Trending enables accurate reorder point calculation and identifies abnormal consumption requiring investigation (quality issue? theft? incorrect application?).
Automated Reorder Triggers
When stock level drops to defined reorder point (based on lead time + consumption rate + safety buffer), system auto-generates purchase requisition. Approval routing based on value threshold: <$5K auto-approved, $5K–$20K to fleet manager, >$20K to operations director. Email notification includes consumption data and justification.
94%
Inventory record accuracy with real-time tracking vs. 62% with spreadsheets
3.8 days
Reduction in reorder lead time through automated triggers vs. manual process
$340K
Annual savings from eliminated stockouts (24-rig fleet, Year 1)
Reorder points aren't arbitrary — they're calculated based on consumption rate, supplier lead time, and acceptable risk tolerance. The formula accounts for the time between placing an order and receiving delivery, plus safety stock to buffer against demand variation or supply delays. FleetRabbit automates this calculation per SKU and updates reorder points dynamically as consumption patterns change.
Reorder Point Formula
Reorder Point = (Average Daily Usage × Lead Time in Days) + Safety Stock
Example: Hydraulic Hose Assembly
Average monthly consumption: 6.2 units
Average daily usage: 6.2 ÷ 30 = 0.21 units/day
Supplier lead time: 5 days (standard shipping)
Safety stock: 1.5 units (to buffer demand variation)
Reorder Point = (0.21 × 5) + 1.5 = 2.55 units
Action: Trigger reorder when inventory drops to 3 units (rounded up)
Key Variables That Impact Reorder Points
Lead Time
Longer lead times require higher reorder points. Remote locations: 7–10 days vs. urban sites: 2–3 days. FleetRabbit tracks actual lead time per supplier per location and adjusts calculations accordingly.
Consumption Variability
Stable consumption (4–6 units/month) = lower safety stock. Highly variable (2–12 units/month) = higher safety stock to prevent stockout during demand spikes. System calculates standard deviation and adjusts safety buffer.
Criticality Level
Category A (critical) parts get higher safety stock — acceptable to carry extra inventory to guarantee availability. Category C parts get minimal safety stock — acceptable stockout risk given low operational impact.
Supplier Reliability
Reliable supplier (98% on-time delivery) = lower safety stock. Unreliable supplier (75% on-time) = higher safety stock to buffer late deliveries. FleetRabbit tracks supplier performance and adjusts reorder points when reliability degrades.
FleetRabbit calculates optimal reorder points for every SKU based on your fleet's actual consumption patterns and supplier lead times — then triggers automatic reorders before you run out. See the system in action.
Common Scenario
Site A needs hydraulic hose immediately — shows zero stock locally. Emergency order placed for overnight delivery at $2,800 premium. Next day, inventory audit at Site B (140km away) discovers 3 unused hoses in back of storage container. If Site A had visibility into Site B inventory, inter-site transfer would have cost $180 in courier fees instead of $2,800 emergency procurement.
FleetRabbit Multi-Site Inventory Features
Network-Wide Search
Search any SKU and see total available quantity across all sites. Results show: quantity at each location, distance from requesting site, last movement date. Enables informed decision: inter-site transfer vs. new procurement vs. emergency order.
Inter-Site Transfer Tracking
Transfer work order created: part removed from Site B inventory, in-transit status, received at Site A and added to inventory. Complete audit trail with courier details, transit time, and receiving confirmation. Prevents "lost in transfer" inventory discrepancies.
Optimal Stock Distribution
System analyzes consumption by site and recommends stock redistribution. Example: Site C using 8 units/month but only 2 in stock. Site D using 1 unit/month with 7 in stock. Recommendation: transfer 4 units from D to C to balance inventory against actual demand.
Consolidated Purchasing
Fleet-wide view prevents duplicate orders. Site A about to order 10 hydraulic hoses. System shows Site B already ordered 15 units (arriving in 3 days) and only needs 6. Recommendation: increase Site B order to 19 units, transfer 4 to Site A upon delivery. Saves duplicate shipping costs and volume discount on single larger order.
47%
Reduction in emergency procurement through inter-site transfers
$127K
Annual savings from eliminated duplicate orders (18-site network)
22%
Reduction in total inventory value through optimized distribution
Fleet Size
240 vehicles
Sites
14 locations
Parts SKUs
2,847 items
Baseline Stockouts
38/year
Pre-Deployment Baseline
Spreadsheet Inventory System: 38 Stockouts Annually
Fleet managing inventory across 14 sites using shared Excel spreadsheet. Monthly cycle counts to update records. Average stockout cost: $82,000 (emergency procurement + downtime). Total annual stockout cost: $3.1M. Root causes: inaccurate stock counts (43% of events), missed reorders (31%), inter-site visibility gaps (26%).
Month 2 Post-Deployment
First Prevented Stockout: Brake Caliper Assembly
FleetRabbit tracking shows brake caliper consumption accelerating: 2 units in Month 1, 4 units in Month 2 (double rate). Stock level at 3 units. System calculates reorder point should be 5 units based on new consumption trend and triggers automatic reorder. Parts arrive 4 days later. Week after delivery, technician requests caliper — 2 units in stock (would have been stockout under old system). Emergency avoided. Cost saved: $78,000.
Month 5
Inter-Site Transfer Eliminates Emergency Order
Site 7 needs hydraulic pump seal immediately (critical failure, production stopped). Local stock: zero. Network search shows Site 11 has 2 units (180km away). Inter-site courier arranged — seal delivered in 6 hours for $240 courier fee. Alternative: emergency overnight supplier delivery at $4,800. Cost avoided: $4,560. Production downtime reduced from 24 hours to 6 hours.
Month 12 Results
89% Stockout Reduction, $2.76M Annual Savings
Year-one outcomes: stockouts reduced from 38 to 4 events (89% reduction). Four remaining stockouts were Category C non-critical items with minimal impact. Total annual cost from stockouts: $340K (vs. $3.1M baseline). Net annual savings: $2.76M. Additional benefits: inventory record accuracy 94% (vs. 61% baseline), carrying cost reduced 18% through optimized stock levels, purchasing efficiency improved via consolidated multi-site orders.
89%
Stockout reduction (38 to 4 events annually)
$2.76M
Annual cost savings from eliminated emergency procurement
94%
Inventory accuracy with real-time tracking
$620K
Reduction in total inventory carrying cost
Mobile Parts Scanning & Tracking
Offline-capable mobile app for barcode scanning at parts withdrawal. Captures: SKU, quantity, technician ID, equipment/work order, timestamp, location. Syncs automatically when connectivity restored. Eliminates paper requisition forms and manual data entry delays.
Real-Time Multi-Site Visibility
Dashboard shows current inventory across all locations: total network quantity, stock at each site, last movement date, consumption trend. Search function displays nearest location with part in stock. Enables inter-site transfer decisions in seconds.
Automated Reorder Point Calculation
System calculates optimal reorder point per SKU based on: average consumption rate, supplier lead time, safety stock requirements, and criticality level. Reorder points update automatically as consumption patterns change. No manual spreadsheet calculations required.
Intelligent Purchase Requisition
When stock drops to reorder point, system auto-generates purchase requisition with: SKU details, recommended order quantity, supplier information, consumption justification, and approval routing. Email notification to purchasing team with one-click approval for authorized items.
Consumption Trending & Analytics
Historical consumption tracking per SKU: monthly usage, seasonal variation, trend direction (increasing/stable/decreasing). Identifies abnormal consumption requiring investigation. Forecasts future demand for budget planning and supplier contract negotiations.
ABC Criticality Classification
Parts tagged as Category A (critical), B (important), or C (routine) based on operational impact. Classification drives inventory strategy: A parts get highest safety stock, automated expedited reorder, and never-stockout policy. C parts ordered as-needed with longer acceptable lead times.
Supplier Performance Tracking
System records actual vs. promised delivery date per supplier per order. Calculates on-time delivery percentage, average lead time, and order accuracy. Performance data informs supplier selection and reorder point safety stock adjustments for unreliable suppliers.
Inventory Audit Trail
Complete transaction history per SKU: received date, withdrawn date, technician name, work order number, inter-site transfers, adjustments, and physical cycle counts. Timestamped records support financial audits, warranty claims, and theft investigation. Exportable for regulatory compliance.
Week 1
Parts Catalog Build & ABC Classification
✓ Import existing parts master file (SKUs, descriptions, unit costs)
✓ Assign ABC criticality classification per SKU with fleet manager input
✓ Configure storage locations (sites, bins, shelves) in system hierarchy
✓ Generate barcode labels for high-turnover items (Categories A & B)
Week 2
Initial Physical Inventory & Data Migration
✓ Conduct full physical count at each site using mobile app
✓ Upload opening stock quantities and locations into FleetRabbit
✓ Import historical consumption data (past 12 months) for trending baseline
✓ Configure supplier catalog with lead times and contact information
Week 3
Reorder Point Configuration & Automation
✓ Calculate initial reorder points for Category A parts (critical items)
✓ Set safety stock levels based on criticality and lead time variability
✓ Configure automated purchase requisition workflow and approval routing
✓ Deploy mobile scanning app to technicians and stores personnel
Week 4
Go-Live: Real-Time Tracking Active
✓ All parts movements logged via mobile app — no more paper requisitions
✓ Real-time stock levels visible across all sites on executive dashboard
✓ Automated reorder triggers active for Category A & B parts
✓ Support period begins: 60-day high-touch assistance and refinement
How do you handle parts that are used infrequently but are critical when needed?
These are classic Category A items with low consumption but high stockout impact — think specialized drilling rig components used once per quarter but cause $150K+ downtime if unavailable. FleetRabbit handles these through: (1) maintaining minimum stock of 1–2 units regardless of consumption rate, (2) longer safety stock buffer (90–120 days vs. standard 30 days), (3) automated annual review to confirm part still required vs. obsolete, (4) inter-site visibility so one unit can serve multiple locations. The holding cost of carrying a $3K low-use part is trivial compared to one prevented $150K emergency procurement event.
What happens if technicians don't scan parts when they withdraw them from inventory?
Non-compliance with scanning protocol is the #1 risk to inventory accuracy in any digital system. FleetRabbit addresses this through: (1) work order cannot be closed until all parts consumption logged — forces compliance at workflow level, (2) monthly physical cycle counts on high-value items detect discrepancies early, (3) variance reporting flags technicians with highest unscanned withdrawal rates for retraining, (4) offline-capable mobile app eliminates "no signal" excuse at remote locations, (5) integration with maintenance work orders pre-populates expected parts usage — technician confirms rather than manually entering. Most fleets achieve 92–96% scanning compliance within 90 days of go-live.
Can FleetRabbit integrate with our existing ERP or accounting system for purchase order generation?
Yes. FleetRabbit integrates with major ERP platforms (SAP, Oracle, Microsoft Dynamics, NetSuite) via API or automated file export. Two integration models: (1) FleetRabbit generates purchase requisition, exports to ERP for PO creation and supplier transmission — maintains single source of truth for financial records, (2) FleetRabbit manages entire procurement workflow and exports completed PO data to ERP for accounting posting — reduces duplicate data entry. Integration typically configured during implementation (Week 1–2). For smaller operators without ERP, FleetRabbit includes native PO generation and supplier email transmission.
How does the system handle parts that fit multiple equipment types (generic vs. equipment-specific)?
FleetRabbit supports both generic parts (SKU serves any equipment) and equipment-specific parts (SKU tied to particular rig/vehicle) through flexible cataloging. Generic example: hydraulic hose assembly H-1250 fits 18 different equipment types — single SKU, consumption aggregated across all uses, reorder point based on total fleet usage. Equipment-specific example: Rig-7 mud pump impeller (unique to that rig model) — separate SKU, consumption tracked only for Rig-7 and sister rigs, reorder point based on that equipment subset. System also supports cross-reference: when generic part withdrawn, user selects which equipment it's installed on — enables failure analysis (which equipment types consume parts fastest).
What's the typical ROI timeline for implementing automated inventory management?
For fleets experiencing 20+ stockouts annually, ROI is typically 2–4 months. Single prevented stockout saves $75K–$90K on average (emergency procurement + downtime). Implementation cost for 200–300 vehicle fleet: $45K–$65K including software, barcode hardware, and deployment services. Payback occurs after preventing first 1–2 stockouts. Year-one savings typically 15–25x deployment cost. For fleets with fewer baseline stockouts (8–12/year), ROI extends to 5–8 months but remains strongly positive. Additional savings beyond stockout prevention: reduced inventory carrying cost (15–20% reduction), eliminated duplicate orders across sites, improved purchasing leverage through better consumption visibility.
Oilfield Inventory Management
FleetRabbit gives you real-time visibility into every part across every site — with automated reorder triggers that ensure critical components never run out, predictive consumption analytics that optimize stock levels, and multi-site synchronization that eliminates emergency procurement through intelligent inter-site transfers.
ABC Classification
Real-Time Tracking
Automated Reorders
Multi-Site Visibility
Consumption Analytics
89% Stockout Reduction
April 15, 2026
By David
All Posts







