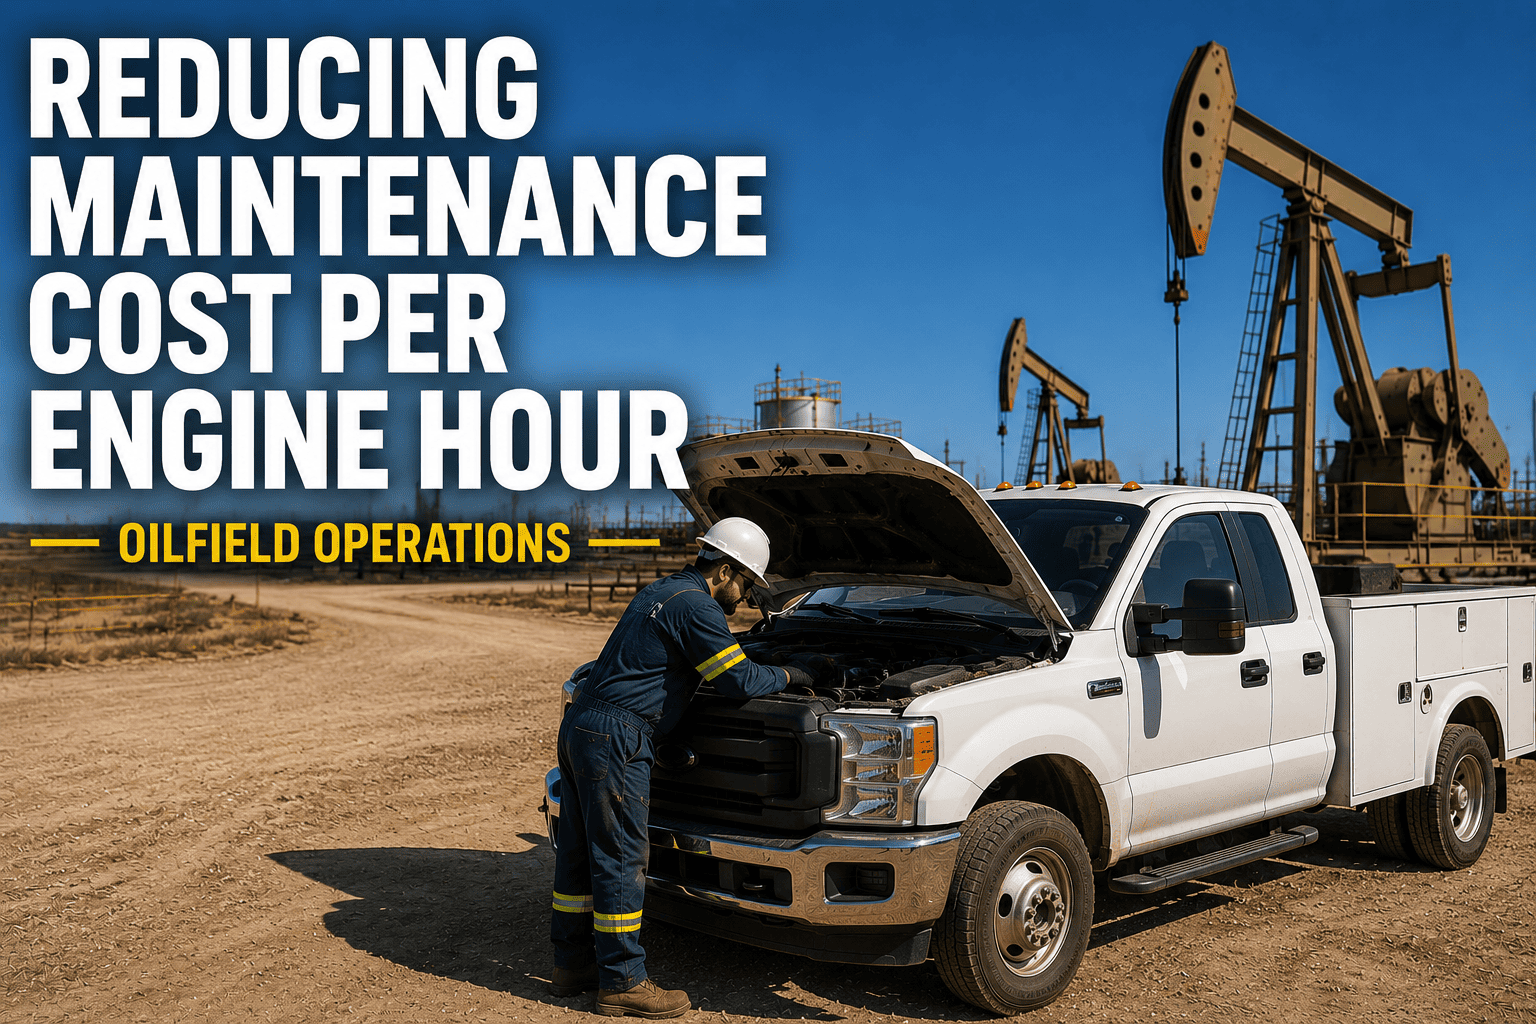
Ask ten oilfield fleet managers how much a truck costs to run and most will quote you a number per mile. But a workover rig, a frac pump, or a wellsite service truck doesn't earn its keep by distance, it earns it by hours on location, hours running, hours the engine is doing work. Cost per mile misses almost everything that actually drives oilfield maintenance spend. Cost per engine hour is the number that tells you which assets are quietly bleeding money and which ones are worth every dollar you put into them.
Cost per engine hour is calculated by dividing total maintenance spend, parts, labor, and downtime-related cost, by total recorded engine hours over the same period. Assets running 20 to 40 percent above the fleet average on this metric are strong candidates for closer inspection or lifecycle replacement review. Operators who track this number by individual asset, rather than as a fleet-wide average, typically uncover a small group of vehicles quietly driving most of the excess spend.
What Cost Per Engine Hour Actually Measures
This metric isn't just a maintenance total divided by a number. It's a way of connecting spend directly to how hard an asset is actually working, which matters enormously in oilfield operations where idle time, standby time, and active work time can look identical on an odometer but mean very different things for wear.
Why This Metric Beats Cost Per Mile in Oilfield Operations
A service truck that drives 40 miles round trip to a wellsite and then runs a pump for six hours puts almost all of its wear into those six stationary hours, not the drive. Cost per mile completely misses that, which is exactly why the metric that matters most in this industry looks so different from standard trucking benchmarks.
| Factor | Cost Per Mile | Cost Per Engine Hour |
|---|---|---|
| Captures Idle & PTO Wear | No, ignores stationary running time entirely | Yes, reflects power-take-off and standby engine load |
| Fits Non-Road Assets | Poor fit for rigs, pumps, and generators with no mileage | Works for any engine-hour-tracked asset regardless of mobility |
| Reflects True Wear Driver | Distance rarely correlates with component wear in the field | Directly tied to the operating time that actually causes wear |
| Supports Replacement Decisions | Hard to compare across mixed asset types | Comparable across trucks, rigs, and stationary equipment alike |
Building Your Cost Per Engine Hour Calculation
The formula is simple, but getting a number worth acting on depends on clean inputs and the right level of detail behind them.
Pull Maintenance Spend by Individual Asset
Fleet-wide averages hide the outliers that matter most. Breaking maintenance spend down asset by asset, including parts, labor, and any premium paid for emergency repairs, is the first step toward a number you can actually act on.
Practical Step
Separating planned maintenance cost from unplanned repair cost within each asset's total makes it far easier to see whether a high number comes from age, misuse, or simply overdue preventive work.
Use Accurate, Automated Engine Hour Data
Manually logged hours drift over time, and a single mistyped entry can throw off a cost-per-hour calculation for weeks. Automated telematics data pulled directly from the engine removes that risk and keeps the denominator honest.
Practical Step
Flagging any hour reading that jumps unrealistically between logs catches data entry errors before they distort your cost trends.
Include Downtime Cost, Not Just Repair Cost
Two assets can have identical repair bills and very different true costs if one sat idle for two days waiting on a part while the other was back running in an hour. Factoring in the value of lost productive time gives a fuller picture.
Practical Step
Estimating a standard daily value for downtime by asset class lets you fold this into the calculation consistently instead of guessing case by case.
FleetRabbit calculates cost per engine hour automatically for every asset, comparing each one against your fleet average so you know exactly where to focus. Start your free trial or book a demo to see your fleet's true cost-per-hour breakdown.
What Drives Cost Per Hour Up, and How to Fix It
Once you have the number by asset, the outliers usually trace back to one of a few recurring causes.
Deferred Preventive Maintenance
Skipped or delayed services don't disappear, they resurface later as bigger, more expensive repairs. Assets with a low preventive-to-reactive maintenance ratio almost always show up near the top of the cost-per-hour list.
Fix
Scheduling PM against actual engine hours, not just calendar time, keeps service intervals aligned with real wear instead of an arbitrary date.
Aging Equipment Past Its Economic Life
Every asset eventually reaches a point where maintenance investment stops making financial sense compared to replacement. Cost per hour is one of the clearest signals for spotting that threshold before it becomes an emergency decision.
Fix
Tracking cost-per-hour trend over time, not just a single snapshot, shows whether an asset is climbing steadily toward replacement territory.
Remote Location Repair Premiums
Wellsite locations far from a shop mean towing costs, mobile repair premiums, and longer downtime for even routine failures, all of which inflate the effective cost of every hour that asset runs.
Fix
Prioritizing predictive alerts for assets working the most remote routes lets teams schedule service before a failure happens miles from the nearest technician.
Quick Benchmarks Worth Tracking
Frequently Asked Questions
Fleet-wide averages hide the outliers driving your maintenance budget up. FleetRabbit tracks cost per engine hour automatically for every asset, so you know exactly where to focus repair, retraining, or replacement decisions. Start your free trial with no credit card required, or book a demo to see your fleet's true cost breakdown.







