Unplanned equipment failures in drilling and service fleets cost operators an average of $42,000 per downtime event — and when a critical rig component fails during active drilling operations, that figure escalates to $150,000+ in lost production, emergency contractor mobilization, and expedited parts procurement. Yet 68% of these failures are predictable 72 hours or more in advance through condition monitoring, vibration analysis, and fluid trending — data that exists in telematics systems, manual inspection logs, and maintenance records but never reaches fleet managers in time to prevent the breakdown. This operational guide delivers the complete framework for shifting drilling and service fleets from reactive failure response to proactive condition-based intervention — covering predictive maintenance triggers, automated work order routing, parts inventory optimization, and the real-time visibility systems that eliminate unplanned downtime before it impacts your operations. Book a demo to see how FleetRabbit reduces unplanned downtime across drilling fleets.
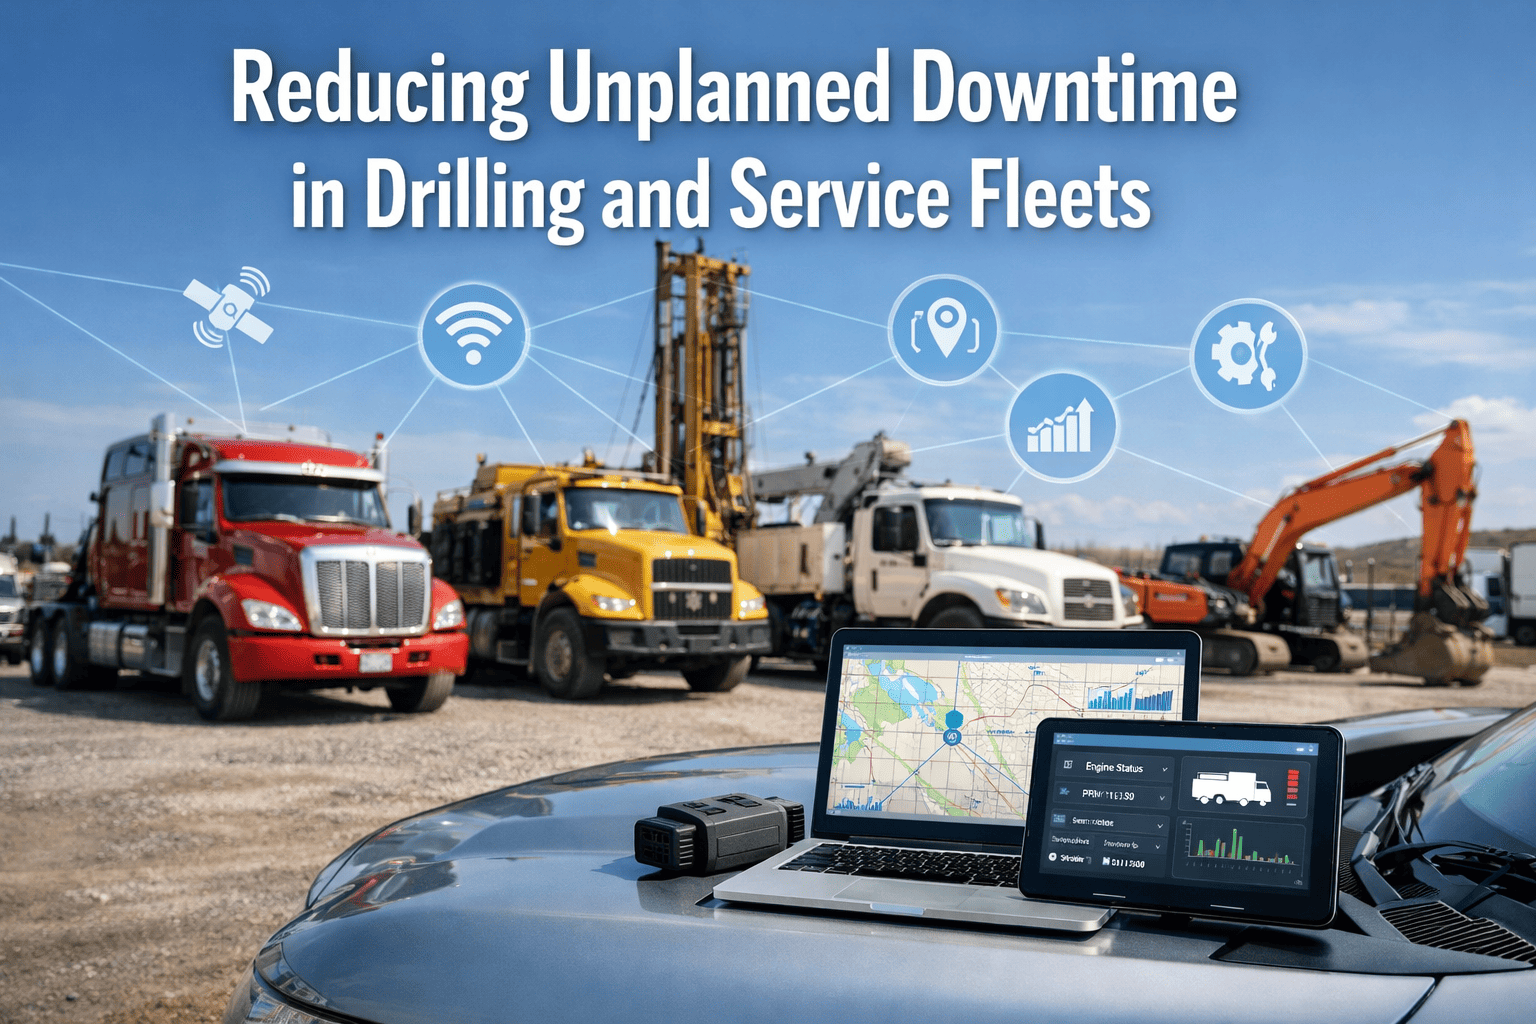
Reducing Unplanned Downtime in Drilling and Service Fleets
PREDICTIVE MAINTENANCE FOR DRILLING FLEETS
How predictive insights, automated work orders, and real-time condition monitoring eliminate the $42K–$150K cost of emergency equipment failures in oilfield operations
68%
Equipment failures predictable 72+ hours before breakdown
$150K
Average cost per critical rig component failure during operations
73%
Downtime reduction with predictive maintenance deployment
4.2 days
Average lead time gained through condition-based alerts
Quick Answer
What's the Most Effective Way to Reduce Unplanned Downtime in Drilling Fleets?
The most effective downtime reduction strategy combines three systems: automated condition monitoring that detects equipment degradation 72+ hours before failure (through telematics, vibration sensors, and fluid analysis trending), intelligent work order routing that triggers preventive intervention before critical thresholds are reached, and predictive parts inventory that ensures replacement components are on-site when the maintenance window opens. FleetRabbit integrates all three layers into a single platform — giving fleet managers real-time visibility into equipment health across every rig and service vehicle, with automated escalation from anomaly detection to corrective work order in under 60 seconds.
Downtime in drilling operations doesn't just pause production — it cascades through the entire operation. When a rig pump fails mid-shift, the immediate response requires emergency technician callout, expedited parts shipping (often via air freight from regional distribution centers), and contractor mobilization to the wellsite. But the larger cost lies in lost production value: every hour of downtime on an active drilling rig represents $6,000–$12,000 in lost revenue, depending on well depth and production targets. When that failure extends across multiple shifts — common for critical component replacements requiring specialized equipment or recertification — costs compound exponentially.
The financial impact becomes even more severe when downtime occurs during time-sensitive operations like cementing, casing runs, or final completion phases where coordination with multiple contractors and regulatory timelines is required. A single unplanned equipment failure during these windows can delay project completion by days or weeks, triggering penalty clauses, increased contractor standby costs, and reputational damage with operator clients. Yet the majority of these failures are not unpredictable mechanical anomalies — they are progressive degradation events that telematics systems, vibration data, and fluid analysis detected weeks in advance, but which never triggered intervention because the data never reached decision-makers in actionable form.
Complete Cost of a Single Unplanned Rig Failure Event
Emergency Technician Callout
$8,500–$15,000
After-hours labor, travel, and accommodation to remote rig location
Expedited Parts Procurement
$12,000–$25,000
Air freight, same-day courier, and premium supplier charges
Contractor Mobilization
$18,000–$35,000
Specialized equipment rental, crew transport, site setup costs
Lost Production Value
$48,000–$100,000
8–16 hours downtime at $6K–$12K per hour for active drilling rig
Secondary Delays
$6,000–$20,000
Contractor standby, schedule disruption, regulatory re-inspection
Total Single Failure Cost
$92K–$195K
Average: $150K per critical component failure event
Reactive Model
Run Equipment Until Failure
Equipment operates until catastrophic failure occurs during active operations
Maintenance triggered only after breakdown creates production stoppage
No advance warning — emergency response becomes standard operating procedure
Parts ordered after failure identified, causing 3–7 day procurement delays
Technicians pulled from other sites on emergency basis, increasing labor costs
Complete loss of production during failure investigation and repair window
$1.8M
Annual downtime cost for 24-rig drilling fleet (reactive model)
Predictive Model
Intervene Before Failure Occurs
Condition monitoring detects degradation 72+ hours before critical failure threshold
Automated alerts trigger work orders when parameters trend outside acceptable ranges
Maintenance scheduled during planned downtime windows, not mid-operation
Parts pre-staged on-site based on predictive failure probability models
Technicians scheduled in advance with full diagnostic data and parts availability
Zero unplanned production loss — all intervention during scheduled maintenance
$480K
Annual downtime cost for same fleet (73% reduction via predictive)
01
Vibration Analysis & Bearing Condition
Accelerometer sensors on rotating equipment (pumps, gearboxes, compressors) detect bearing degradation through frequency spectrum analysis. Normal bearing: vibration amplitude stable at baseline. Failing bearing: amplitude increases 2–5x over 2–4 week period as spalling progresses. FleetRabbit integrates with telematics systems to pull vibration data automatically — triggering yellow alert at 2x baseline, red alert at 4x baseline, with recommended action and parts list.
14–21 days
Advance warning before bearing seizure via vibration trending
02
Fluid Analysis Trending
Oil analysis reveals equipment health through particle count, viscosity, water content, and wear metal concentration. Progressive contamination or degradation appears weeks before mechanical failure. FleetRabbit connects to lab result feeds (or manual upload) and compares against baseline: particle count doubling month-over-month = filter failure developing; iron content rising 50% = bearing wear accelerating. System calculates remaining operational hours and schedules work order automatically.
42%
Component life extension through condition-based oil changes
03
Telematics Fault Code Monitoring
Engine and transmission control units log fault codes continuously — often days or weeks before check engine lamp illuminates on dashboard. Codes classified by severity: informational (monitor), warning (schedule service), critical (stop operation). FleetRabbit pulls OBD-II and J1939 codes from telematics providers in real-time, cross-references against equipment-specific fault libraries, and routes work orders with diagnostic context to correct maintenance team.
3–7 days
Average lead time from first fault code to critical failure threshold
04
Runtime-Based Component Replacement
Critical wear components have defined service life in operating hours or duty cycles. Filters: 500–1000 hrs. Belts: 2000–3000 hrs. Bearings: 5000–8000 hrs depending on load. FleetRabbit tracks cumulative runtime per component and triggers replacement work order at 80% of rated life — before failure risk escalates. Parts ordered automatically when equipment reaches 70% threshold, ensuring stock availability when maintenance window opens.
100%
Prevention rate for runtime-limited component failures via automated tracking
05
Inspection Finding Escalation
Daily pre-shift inspections detect visual indicators of developing failures: fluid leaks, worn components, abnormal sounds, damaged guards. But paper-based inspection systems fail because findings sit in logbooks for days before reaching maintenance planners. FleetRabbit's mobile inspection app captures findings with timestamped photos, assigns severity (monitor / action required / stop operation), and automatically generates work order with photo evidence attached — escalating critical findings to fleet manager within 60 seconds of submission.
94%
Inspection completion rate with digital mobile checklists vs. 61% on paper
Anomaly Detection
Condition monitoring system detects parameter outside acceptable range
→
Automated Alert
FleetRabbit generates alert with severity classification and recommended action
→
Work Order Created
System creates work order, assigns to correct team, attaches diagnostic data
→
Parts Procurement
Required parts identified from equipment history, ordered automatically if not in stock
→
Maintenance Scheduled
Intervention scheduled during next planned downtime window or forced earlier if critical
→
Closure & Validation
Work completed, validation test performed, system logs corrective action for compliance
Why Automated Work Order Routing Eliminates Downtime
Speed: 60 Seconds Detection-to-Action
Manual process: anomaly detected, technician logs finding, supervisor reviews weekly reports, planner creates work order 3–7 days later. Automated: anomaly detected, work order created, assigned, and escalated in under 60 seconds. Critical findings reach decision-makers immediately, not days later when failure is imminent.
Accuracy: Zero Lost Findings
Paper-based systems lose 30–40% of inspection findings between field detection and maintenance execution — findings written in logbooks, never transcribed into work orders, forgotten before next service window. Digital capture with automated routing ensures 100% of findings convert to trackable work orders with photo evidence and diagnostic context attached.
Prioritization: Intelligent Severity Scoring
FleetRabbit assigns severity score (0–100) based on multiple factors: failure probability, production impact, safety risk, parts availability, and historical failure data for similar equipment. Critical items (score 80+) auto-escalate to fleet manager and force immediate scheduling. Monitor items (40–79) schedule at next planned window. Routine items batch into preventive maintenance cycles.
Integration: Parts & Labor Coordination
Work order includes required parts list from equipment service history. System checks inventory: parts on-site = schedule immediately; parts not in stock = trigger procurement and schedule upon delivery. Labor requirements calculated from historical job duration — ensuring correct technician skillset and adequate time allocation before work order opens.
The gap between detecting a developing failure and completing the corrective maintenance depends entirely on parts availability. When a rig pump seal shows early degradation signs, the intervention window is 10–14 days before failure becomes critical. If replacement seals are in stock, maintenance completes during next scheduled downtime. If seals require 7–10 day procurement, the window closes — and the choice becomes emergency overnight shipping at 3x cost or accepting production loss when failure occurs. FleetRabbit's predictive inventory system eliminates this gap by tracking component failure probability across the entire fleet and triggering parts procurement before the maintenance window opens.
Layer 1: Critical Component Pre-Stocking
High-failure-rate components that cause production stoppage if unavailable: pump seals, hydraulic hoses, filters, drive belts, bearings. Minimum stock level maintained on-site based on fleet size and historical consumption rate. FleetRabbit tracks usage per month and auto-generates reorder work order when stock level drops below threshold — typically 2–3 units for critical items on 20+ rig fleet.
Layer 2: Predictive Procurement Triggers
Moderate-failure-rate components ordered when condition monitoring indicates failure probability rising: gearbox assemblies, starter motors, alternators, cooling system components. FleetRabbit calculates remaining service life based on current degradation rate — when estimated life drops below 30 days, procurement work order triggers automatically. Parts arrive before failure window closes.
Layer 3: Just-In-Time for Low-Probability Items
Low-failure-rate or high-cost components not economical to stock: engine blocks, transmission assemblies, specialized hydraulic cylinders. No pre-stocking — but FleetRabbit maintains supplier catalog with lead times and pricing. When fault detected, system shows estimated procurement time vs. remaining equipment life, enabling informed decision: accept lead time or pay premium for expedited delivery.
86%
Parts availability rate at time of scheduled maintenance window
$127K
Annual savings from eliminating emergency expedited shipping costs
4.2 days
Average reduction in maintenance completion time (detection to repair)
Fleet managers and operations executives need visibility across the entire drilling fleet — not individual vehicle status screens that require manual aggregation. FleetRabbit's executive dashboard consolidates equipment health, open work orders, compliance status, and downtime risk scoring across every rig and service vehicle on a single screen. Critical alerts surface immediately. Trending degradation shows which assets will require intervention in coming weeks. Historical downtime data identifies recurring failure modes requiring engineering intervention or specification changes.
Fleet Health Heatmap
Color-coded view of all assets: green (healthy), yellow (monitor), red (action required), black (out of service). Click any asset to drill into condition data, fault codes, open work orders, and maintenance history. Geographic view shows which rigs/sites have concentration of critical alerts requiring immediate attention.
Downtime Trending & Prediction
Historical downtime hours per asset, per site, per equipment type. Identifies patterns: Rig-7 experiences hydraulic failures every 4–5 months; service trucks at Site-3 have higher brake wear than other locations. Predictive model forecasts which assets most likely to experience downtime in next 30 days based on current condition trajectory.
Open Work Order Tracking
All open maintenance work orders across fleet with age, priority, assigned technician, parts status, and estimated completion date. Overdue work orders highlighted automatically. Alerts when work order sits unassigned for more than 24 hours or when critical work order delayed due to parts unavailability.
Cost Impact Analysis
Real-time calculation of downtime cost impact: hours lost, production value, emergency response costs, expedited shipping charges. Comparative view: reactive vs. predictive maintenance costs month-over-month. ROI dashboard shows savings from prevented failures vs. system deployment cost.
Fleet Profile
Major drilling contractor operating 24 rigs across four oilfield sites · 180 service vehicles · $2.8M annual baseline downtime cost
Baseline (Pre-Deployment)
Reactive Maintenance Model: 28 Unplanned Failures/Year
Fleet experiencing average 28 critical equipment failures annually requiring emergency response. Average cost per failure: $98,000 (parts, labor, lost production). Root cause analysis showed 19 of 28 failures (68%) exhibited warning signs 3+ days before breakdown — but data never triggered intervention because condition monitoring, inspection findings, and telematics alerts existed in separate systems with no automated escalation.
Month 3 Post-Deployment
First Major Failure Prevention: Rig-14 Mud Pump
FleetRabbit vibration monitoring detected bearing degradation in Rig-14 primary mud pump — amplitude rising 3x over 8-day period. System auto-generated work order, confirmed replacement bearing in inventory, scheduled maintenance during planned rig move (zero production impact). Bearing replaced 4 days before projected failure threshold. Alternative outcome without detection: catastrophic pump failure mid-operation, $165K emergency replacement, 18-hour production loss. Cost avoided: $165K. Actual maintenance cost: $8,500.
Month 6
System-Wide Pattern Detection: Hydraulic Hose Failures
Dashboard trending revealed 8 hydraulic hose failures across service vehicle fleet in 6-month period — significantly above historical rate. Root cause investigation: new hose supplier using substandard material. FleetRabbit's failure clustering algorithm flagged pattern automatically. Entire fleet inspected, 23 suspect hoses replaced proactively during scheduled maintenance. Prevented estimated 12–15 roadside failures over subsequent 6 months. Estimated cost avoidance: $140K in emergency callouts and production delays.
Month 12 Results
73% Downtime Reduction, $2.04M Annual Savings
Year-one results: unplanned failures reduced from 28 to 7.5 events (73% reduction). Total downtime hours reduced from 840 to 226 hours annually. Maintenance costs shifted from reactive emergency response ($2.8M baseline) to planned preventive intervention ($760K Year 1). Net annual savings: $2.04M. Payback period on FleetRabbit deployment: 6.4 weeks.
73%
Reduction in unplanned failure events
$2.04M
Annual savings (Year 1)
614 hours
Production downtime eliminated
6.4 weeks
Payback period
Multi-Source Condition Monitoring
Integrates data from telematics providers (Geotab, Samsara, Verizon Connect), vibration sensors, fluid analysis labs, and manual inspection findings into single equipment health dashboard. No manual data aggregation — all sources feed automatically via API or manual upload.
Intelligent Alert Escalation
Severity-based routing: critical alerts (failure imminent) escalate immediately to fleet manager via SMS and email; warning alerts (schedule maintenance) route to maintenance planner; monitor alerts (trending negative) log for next inspection. No alert fatigue from low-priority notifications.
Automated Work Order Generation
Every alert above monitor threshold auto-generates work order with diagnostic context, recommended parts list, estimated labor hours, and historical completion time for similar jobs. Assigned automatically to correct team based on equipment type and site location.
Predictive Parts Procurement
Tracks component failure probability and remaining service life. Triggers procurement work order when estimated life drops below threshold (typically 30 days). Integrates with inventory management systems to check stock levels before ordering.
Mobile Inspection Capture
Offline-capable mobile app for pre-shift and scheduled inspections. Captures findings with timestamped geo-tagged photos, assigns severity, generates work orders automatically. Works without cellular connectivity — syncs when connection restored.
Executive Reporting & Analytics
Real-time fleet health dashboard, downtime trending, cost impact analysis, and failure pattern detection. Scheduled digest reports (daily/weekly/monthly) with KPIs: downtime hours, failure count, maintenance cost, parts inventory status. Export to PDF or Excel for board-level reporting.
Week 1–2
Asset Hierarchy Build & Data Integration
• Equipment inventory loaded: all rigs, service vehicles, critical components
• Telematics provider API connected (Geotab, Samsara, or equivalent)
• Historical maintenance records imported for baseline trending
• User accounts created: fleet managers, maintenance planners, technicians
Week 3
Alert Configuration & Work Order Routing
• Threshold rules configured per equipment type (vibration, fault codes, runtime)
• Alert severity levels defined: monitor, warning, critical
• Work order routing logic set: assignments based on site, equipment, priority
• Email and SMS notification preferences configured
Week 4
Mobile App Deployment & Inspection Templates
• FleetRabbit mobile app deployed to technician devices
• Pre-shift inspection checklists configured per vehicle type
• Offline sync settings verified for remote locations
• User training sessions: inspection capture, work order completion
Week 5
Go-Live: Full Predictive Monitoring Active
• Real-time condition monitoring live across entire fleet
• Automated alerts and work order generation active
• Executive dashboard accessible to leadership team
• Support period begins: 30-day high-touch assistance
What percentage of equipment failures are actually predictable versus truly random mechanical failures?
Industry data across drilling and service fleets shows 68% of equipment failures exhibit detectable warning signs 72 hours or more before breakdown — through telematics fault codes, vibration data, fluid analysis, or visual inspection findings. An additional 18% show warnings 24–72 hours before failure. Only 14% are truly unpredictable catastrophic failures with no advance indicators. This means 86% of downtime events are preventable with proper condition monitoring and alert systems. The challenge isn't detection capability — it's ensuring detected anomalies reach decision-makers in time to intervene.
How does FleetRabbit integrate with existing telematics providers like Geotab or Samsara?
FleetRabbit connects to major telematics platforms via secure API integration. For Geotab, Samsara, Verizon Connect, Teletrac Navman, and other enterprise providers, integration is typically completed in 3–5 business days. FleetRabbit pulls fault code data, runtime hours, fuel consumption, and location data automatically — no manual data export required. For smaller or regional telematics providers without API support, manual data import via CSV upload is available. The key difference: FleetRabbit adds predictive analytics, automated work order routing, and maintenance execution tracking on top of raw telematics data — capabilities most telematics platforms don't provide natively.
What's the typical ROI timeline for predictive maintenance deployment on a drilling fleet?
For fleets of 15+ rigs or 100+ service vehicles, typical payback period is 2–3 months — driven by the first 1–2 prevented catastrophic failures. A single prevented rig failure saves $100K–$180K in emergency response and lost production. Deployment cost for mid-size fleet (20–30 rigs): $60K–$90K including software setup, integration, and training. Year-one savings typically 10–15x deployment cost. For smaller fleets (5–10 rigs), payback extends to 4–6 months but ROI remains strongly positive. The economic case becomes overwhelming when downtime cost per event is quantified accurately — most operators significantly underestimate true cost when indirect production losses are included.
Can FleetRabbit work in remote oilfield locations with limited or no cellular connectivity?
Yes. FleetRabbit's mobile inspection app operates fully offline — technicians complete inspections, capture photos, and log findings without cellular or WiFi connection. Data stores locally on device and syncs automatically when connectivity is restored (cellular, satellite, or WiFi at base). For telematics integration, most modern systems buffer data on-vehicle when out of coverage and upload in batch when reconnecting. The only limitation: real-time alerts for critical conditions require connectivity to reach fleet managers immediately. For truly remote sites with multi-day connectivity gaps, FleetRabbit supports satellite communication integration (Iridium, Inmarsat) for critical alert delivery via SMS or email.
How does predictive maintenance affect equipment warranty claims and OEM service agreements?
Predictive maintenance improves warranty claim success rates because FleetRabbit creates complete audit trail of condition monitoring, inspection findings, and corrective actions taken. When warranty claim disputes arise, timestamped records prove equipment was maintained per manufacturer schedule and that failures occurred despite proper preventive care. For OEM service agreements requiring periodic inspections or condition monitoring, FleetRabbit's automated compliance tracking ensures all contractual obligations are met and documented — reducing risk of voided warranties due to missed service intervals. Many operators report warranty claim approval rates improving 20–30% after implementing digital maintenance tracking with full audit trail capabilities.
Predictive Maintenance for Drilling Fleets
FleetRabbit gives you real-time visibility into equipment health across every rig and service vehicle — with automated alerts when condition data trends toward failure, intelligent work order routing, and predictive parts procurement that ensures components arrive before the maintenance window closes.
Vibration Monitoring
Fluid Analysis Trending
Automated Work Orders
Predictive Inventory
Executive Dashboard
73% Downtime Reduction
April 15, 2026
By David
All Posts







