Most oilfield safety programs still run on a rearview mirror. Incident reports get reviewed after something has already gone wrong, and by then the coaching conversation is about damage control instead of prevention. The fleets with genuinely strong safety records track a different set of numbers entirely, the leading indicators that show risk building days or weeks before it turns into a recordable incident. Knowing which metrics actually predict trouble, and which ones just describe it after the fact, is what separates a safety program that reacts from one that prevents.
Fleets that track leading indicators like harsh braking, speeding, and HOS approaching-limit alerts reduce harsh driving events by 34 to 47 percent within 60 days. Data-based coaching using GPS-timestamped events produces 3 to 5 times better behavior change than general safety reminders, and integrated safety platforms have driven incident rates down 40 to 60 percent for operators that adopted them.
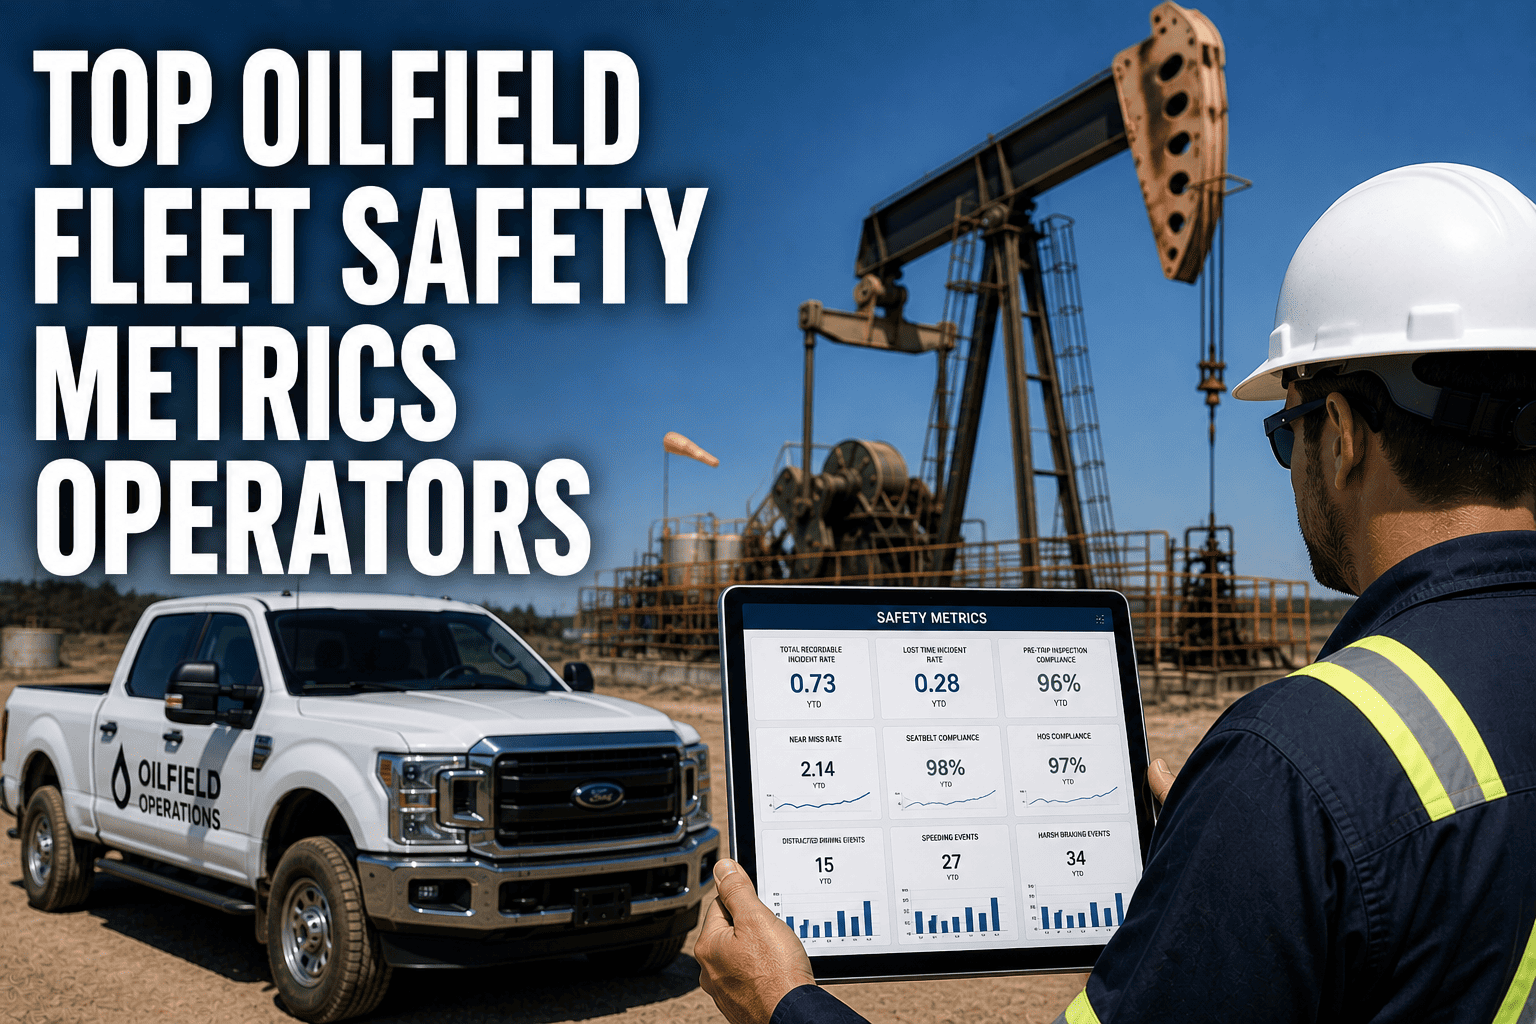
The Metrics Dashboard Every Oilfield Operator Should Watch
Not every number on a safety report deserves equal attention. These eight metrics are the ones that consistently predict incident risk before it becomes a recordable event, and each one is something a fleet manager can act on the same day it moves in the wrong direction.
Harsh Braking Frequency
Deceleration events exceeding safe thresholds are one of the strongest early indicators of following-distance and attention issues before a collision occurs.
Speeding Against Zone Limits
Speed measured against posted limits and site-specific zone thresholds, not just a flat company policy, catches risk on lease roads and wellsite approaches.
HOS Approaching-Limit Alerts
Flagging drivers nearing their available hours before dispatch prevents fatigue-related incidents rather than discovering violations during an audit.
Inspection Completion Rate
The percentage of scheduled pre-trip and DVIR inspections actually completed on time reflects whether defects are being caught before a vehicle leaves the yard.
Seatbelt Compliance
A simple binary metric per trip, but one of the most consistent predictors of injury severity when an incident does occur.
TRIR And DART Rate
Total recordable incident rate and days-away-restricted-transfer rate confirm how the program performed, but they only show up after the incident already happened.
Near-Miss Frequency
Tracking near-misses alongside actual incidents reveals whether risk is trending up even while recordable numbers still look acceptable.
Certification Compliance Status
CDL, hazmat endorsement, and medical certificate status confirm whether every driver dispatched was actually qualified to be on the road that day.
FleetRabbit scores every driver continuously across these risk dimensions, updating in real time instead of waiting for a monthly report. Sign up free and see your fleet's live safety scores today.
Leading Indicators Versus Lagging Indicators
The difference between these two categories is not academic. It determines whether your safety program is preventing incidents or just documenting them after the fact.
Why Leading Indicators Change Outcomes
A fleet risk assessment that produces a report once a month is not really risk assessment, it is incident history review. Leading indicators like harsh braking clusters and speeding frequency let a fleet manager intervene in the same week the risk appears, long before it compounds into a recordable event.
Where Lagging Indicators Still Matter
Lagging indicators like TRIR and DART rate remain essential for benchmarking overall program health and satisfying insurance underwriting and client prequalification requirements. They just cannot be the only numbers a fleet manager checks, because by the time they move, the cost has already been paid.
| Indicator Type | What It Shows | When You See It | Best Use |
|---|---|---|---|
| Leading Indicators | Behavior patterns building toward risk | Same day, real time | Immediate coaching intervention |
| Lagging Indicators | Confirmed outcomes and incident history | After the fact, monthly or quarterly | Program benchmarking and audits |
What Consistent Monitoring Actually Achieves
Numbers on a dashboard only matter if they change behavior on the ground. Operators who committed to continuous safety monitoring over the past year report results that manual, paper-based safety reviews were never able to produce.
A Real Result: Zero HSE Incidents In 18 Months
One oilfield operator activated dispatch blocking rules that prevent vehicle assignment to drivers with expired credentials or insufficient hours of service, paired with continuous telematics monitoring of harsh braking, acceleration, and speeding. Three expired credentials were identified and renewed before drivers were ever dispatched in the first month alone, and the fleet went eighteen months without a reportable HSE incident.
Data-Based Coaching Outperforms Observation-Based Coaching
When a supervisor sits down with a driver to discuss a specific GPS-timestamped hard braking event, complete with location, speed, and deceleration rate, the conversation is grounded in an objective record that cannot be disputed or reframed. Research on oilfield coaching programs consistently finds this approach produces 3 to 5 times better behavior change than a general safety reminder.
FleetRabbit's coaching workflow hands supervisors GPS-timestamped event records for every driver, turning subjective feedback into objective, actionable conversations. Book a free demo to see the safety scorecard in action.
Benchmark Targets For Oilfield Fleet Safety Metrics
These targets give fleet managers a realistic range to compare against, based on current operator data from 2026 oilfield safety programs.
| Metric | Needs Attention | Industry Average | Strong Performance |
|---|---|---|---|
| Inspection Completion Rate | Below 75 percent | 75 to 90 percent | Above 95 percent |
| Harsh Event Frequency Trend | Increasing month over month | Stable | Declining 30 percent plus yearly |
| HOS Violation Rate | Discovered at roadside | Caught before dispatch | Blocked automatically pre-dispatch |
| Driver Safety Engagement | Below 60 percent | 60 to 85 percent | Above 90 percent |
A safety program built entirely on monthly reports and paper reviews will always be one step behind. The oilfield fleets seeing genuine, sustained improvement are the ones treating harsh braking, speeding, and HOS alerts as daily numbers to act on, not quarterly ones to file away. Watching the right metrics, in real time, is what turns a safety program from documentation into actual prevention.
Harsh braking, speeding, HOS alerts, and inspection completion rates are the leading indicators that stop incidents before they happen. FleetRabbit puts them all on one live dashboard built for oilfield operations. Start your free trial today, no credit card required.







