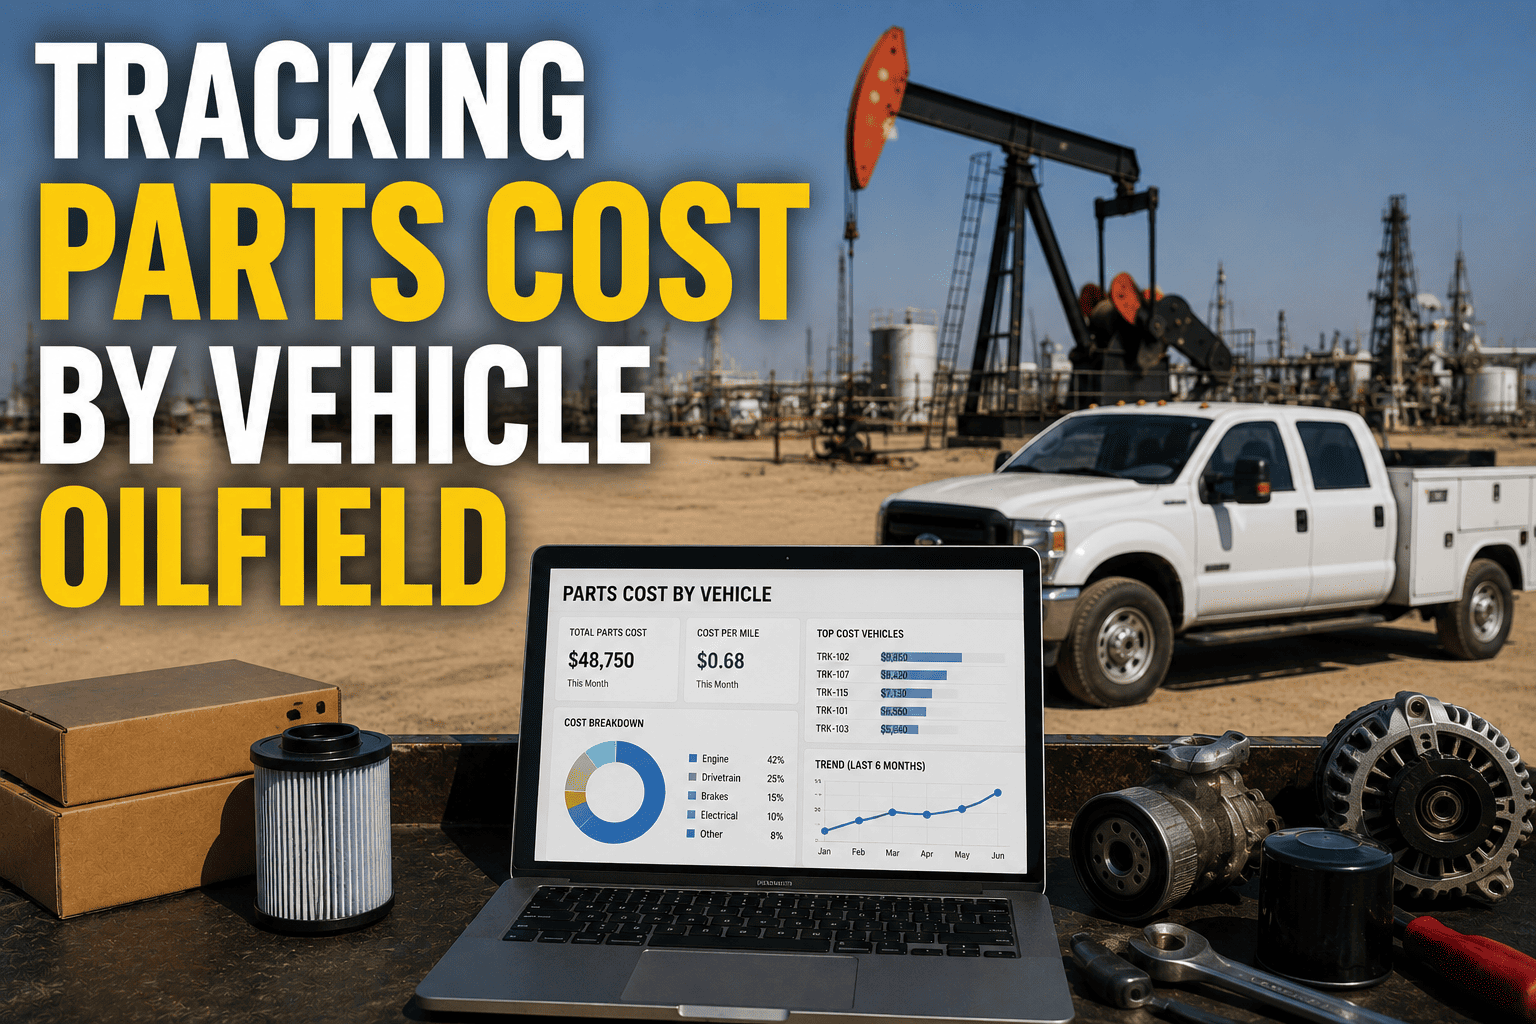
Ask most oilfield fleet managers what they spent on parts last quarter and they'll give you a number. Ask which specific truck ate a third of that number and most go quiet. Parts spend tracked at the fleet level tells you the total is rising. It doesn't tell you why, and in an oilfield operation running mixed-duty service trucks, tankers, and specialty rigs across remote wellpads, that gap between the total and the truck-by-truck breakdown is exactly where the waste hides.
When parts consumption isn't tied to a specific vehicle, fleets can't calculate true cost per truck, can't spot which units are quietly becoming money pits, and can't tell a normal repair from a recurring failure pattern. A small share of SKUs, typically 10 to 15 percent, drives 70 to 80 percent of stockout impact, and reactive repairs run 3 to 9 times the cost of the same job done on a planned schedule. Tracking parts spend by vehicle turns those blind spots into a ranked list of exactly which assets need attention first.
Why A Fleet-Wide Parts Number Hides The Real Problem
Oilfield fleets running mixed-duty vehicles across service work, transport, and specialty tasks generate parts spend that looks reasonable in aggregate and hides serious problems underneath. A total that grows five percent year over year could mean five percent more wear across the whole fleet, or it could mean two trucks absorbing most of the increase while the rest stay flat. Without a per-vehicle breakdown, those two situations look identical on the budget report.
Aggregate Totals Reward The Wrong Behavior
When parts spend is only tracked at the fleet level, there's no mechanism that flags a specific truck as an outlier. A unit quietly consuming three times the parts budget of an identical vehicle in the same duty class can run that way for a full year before anyone notices, simply because the number never gets isolated from the total.
Remote Wellpad Operations Compound The Problem
Parts requested for emergency repairs at a remote site often get logged against a general work order rather than reconciled back to the specific vehicle and its full service history, especially when expedited shipping and a rushed technician response are already the priority.
FleetRabbit ties every parts transaction to the specific vehicle it was consumed on, building a ranked cost profile across your fleet automatically. You can start a free trial and see your highest-cost assets within days.
The Vehicle-Level Signals Fleet Totals Can't Show
Once parts spend is attributed to a specific truck, four signals become visible that a fleet-wide number simply can't surface.
| Signal | What It Reveals | Action It Triggers |
|---|---|---|
| Cost Per Vehicle Ranking | Which trucks sit above the fleet's typical parts spend for their duty class | Prioritize inspection and root-cause review on top outliers first |
| Repeat Repair Rate | Which vehicles keep replacing the same component within a short window | Investigate root cause instead of treating each event as isolated |
| Parts Spend Vs. Asset Value | Whether cumulative repair cost is approaching the truck's replacement value | Trigger a formal repair-versus-replace evaluation |
| Sibling Asset Comparison | How one truck's parts consumption compares to an identical unit | Flag abnormal wear tied to route, operator, or environment |
Classifying Parts By Criticality, Not Just Price
Not every part deserves the same level of tracking attention. Segmenting inventory by how much a stockout would actually cost, rather than by unit price alone, keeps the focus on what matters.
Class A: Mission-Critical, Low Volume
Typically 10 to 15 percent of SKUs, these are components whose absence stops a truck on the spot, such as hydraulic pump assemblies or drivetrain parts. They carry the highest stockout cost and need dedicated on-site minimum stock levels.
Class B: Frequently Replaced, Moderate Impact
Filters, belts, and wear items that get consumed regularly but rarely cause a full stoppage on their own. These are the best candidates for bulk ordering tied to PM schedules rather than reactive purchasing.
Class C: Low Cost, Low Urgency
Small hardware and consumables that carry minimal stockout risk individually, but whose combined spend across a large fleet is still worth tracking by vehicle to catch unusual consumption patterns.
Spotting A High-Cost Asset Before It Becomes A Money Pit
A few consistent patterns show up in the data well before a truck's total repair cost becomes an obvious problem.
Parts spend climbing while mileage or hours stay flat
If a truck's usage hasn't changed but its parts consumption has, something beyond normal wear is driving the cost.
The same part replaced inside a short window
A component reordered for the same truck within a few months of the last replacement usually points to a root cause that wasn't actually fixed.
Emergency orders outpacing scheduled ones for a single unit
A vehicle whose parts requests are consistently unplanned rather than tied to a PM schedule is running on a reactive cycle that costs several times more per repair.
FleetRabbit flags repeat repairs, tracks parts spend against asset value, and compares identical trucks side by side, so repair-versus-replace decisions are based on data instead of a gut call. You can book a demo to see your fleet's cost profile.
Building A Parts-By-Vehicle Tracking System
Getting from a fleet-wide total to a ranked, vehicle-level view takes four consistent steps, not a full inventory system overhaul.
Step 1: Tie every parts transaction to a vehicle ID
Every part pulled from inventory or ordered on a work order needs to be logged against the specific truck it was installed on, not just the job or the technician.
Step 2: Build a 60-day cost baseline per asset
Importing historical records and tracking new spend from day one establishes each truck's normal parts cost range, which is what makes an outlier visible in the first place.
Step 3: Group vehicles by duty class before comparing
A specialty rig and a light service truck will never have the same parts profile, so comparisons only make sense within matched duty groups.
Step 4: Review the ranked list monthly, not just at budget time
Catching a cost outlier in month two is far cheaper than discovering it during an annual budget review, once the pattern has already run for a year.
Turning The Ranking Into A Decision
Once a truck consistently sits at the top of the cost-per-vehicle list, the conversation shifts from "why is parts spend up" to a specific, data-backed choice: fix the root cause, reassign the vehicle to lighter duty, or begin a formal replacement evaluation.
A fleet-wide parts total tells you spending is up. Vehicle-level tracking tells you why, and exactly which truck to look at first. FleetRabbit connects every part to the asset it was installed on, turning scattered invoices into a ranked, actionable view of your fleet.







