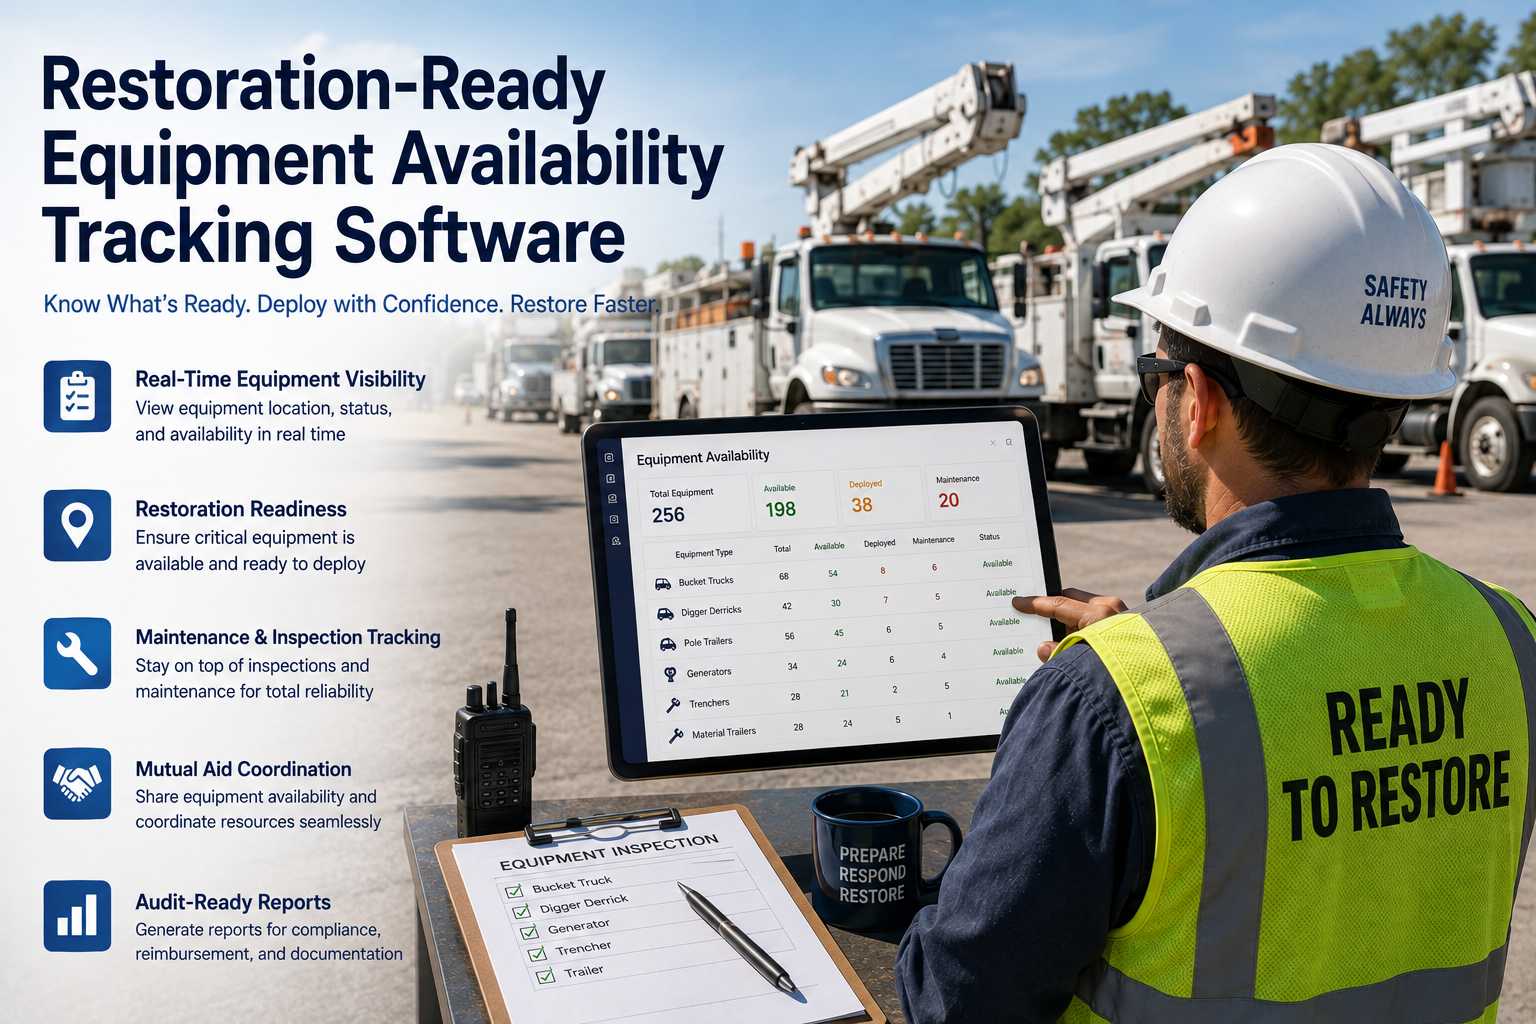
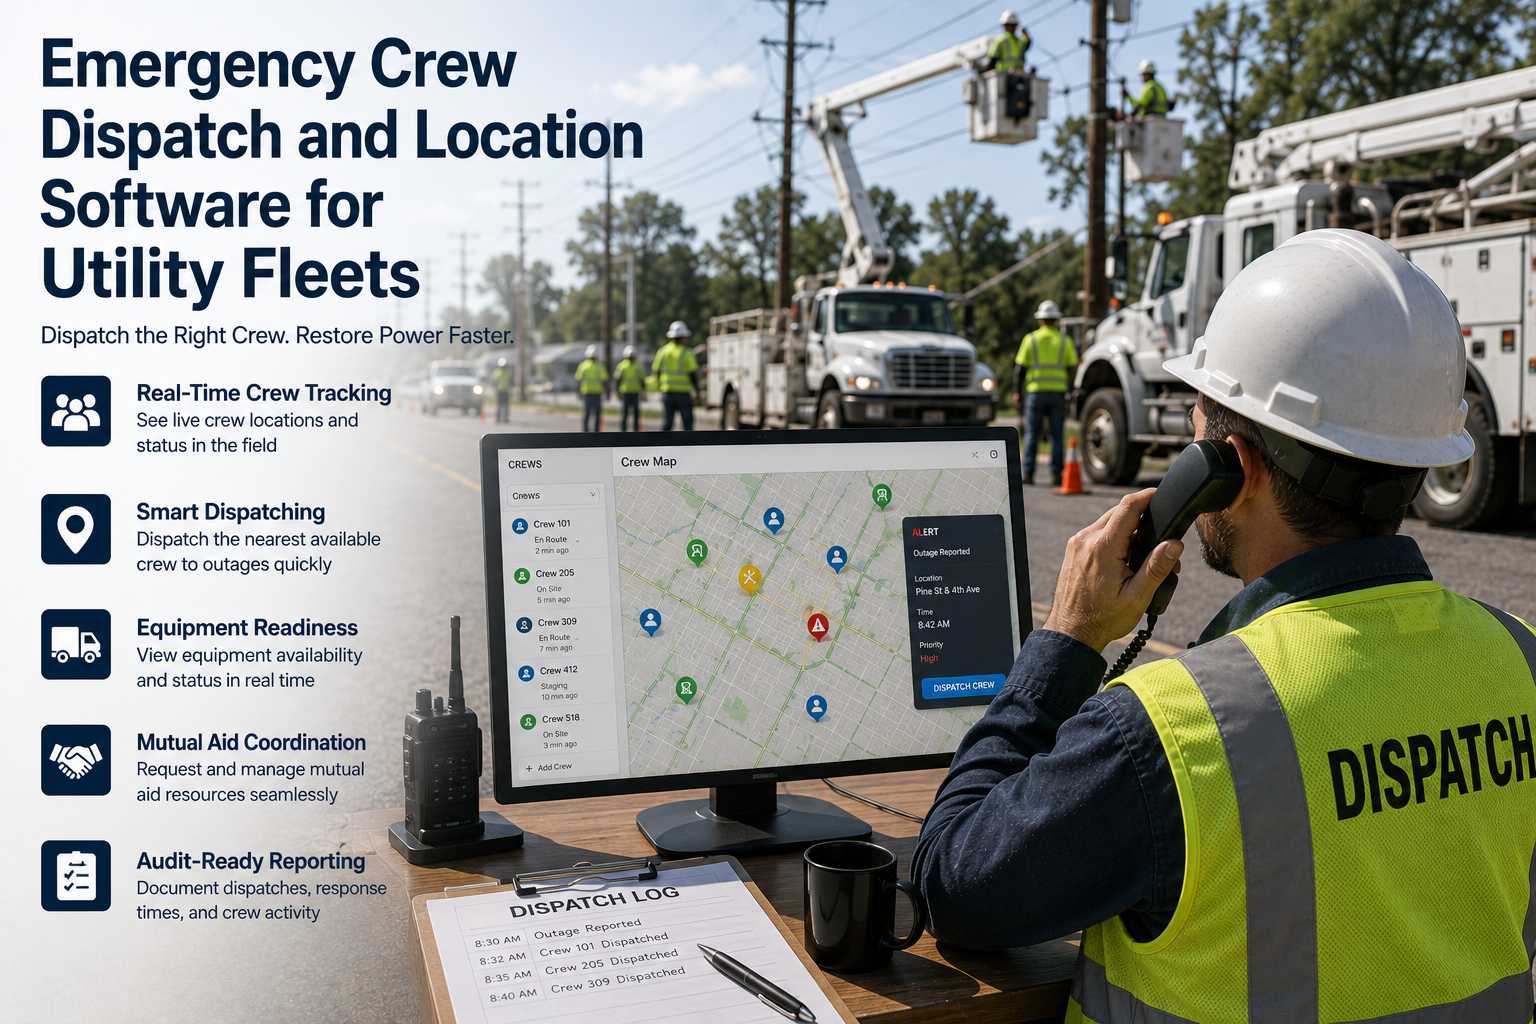
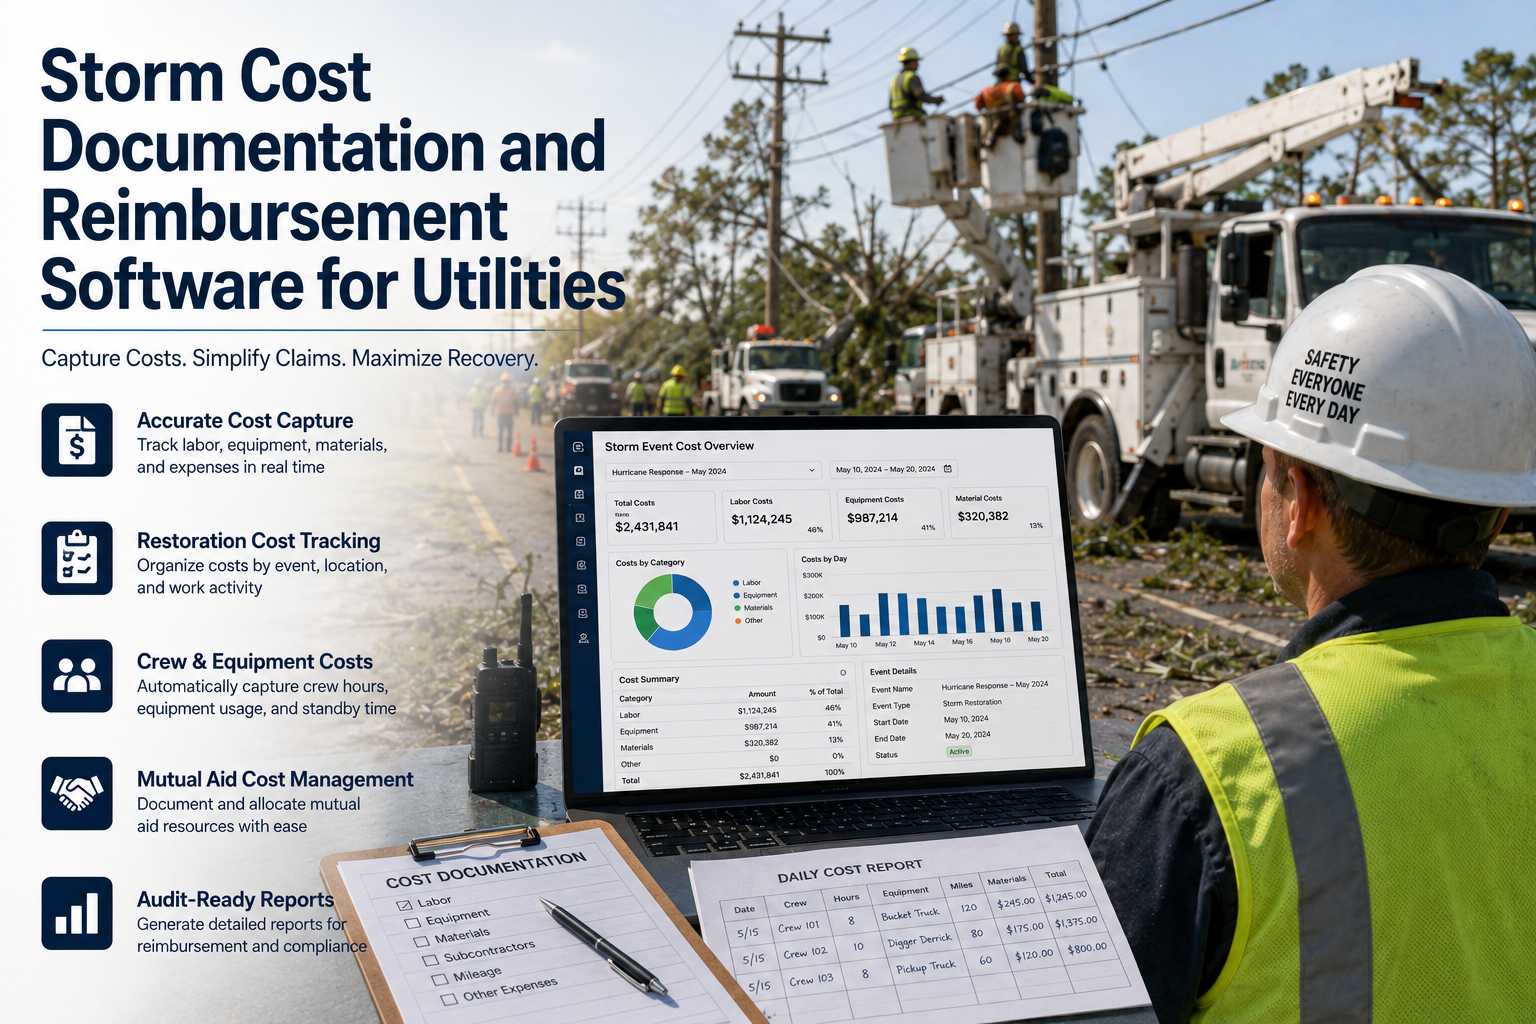
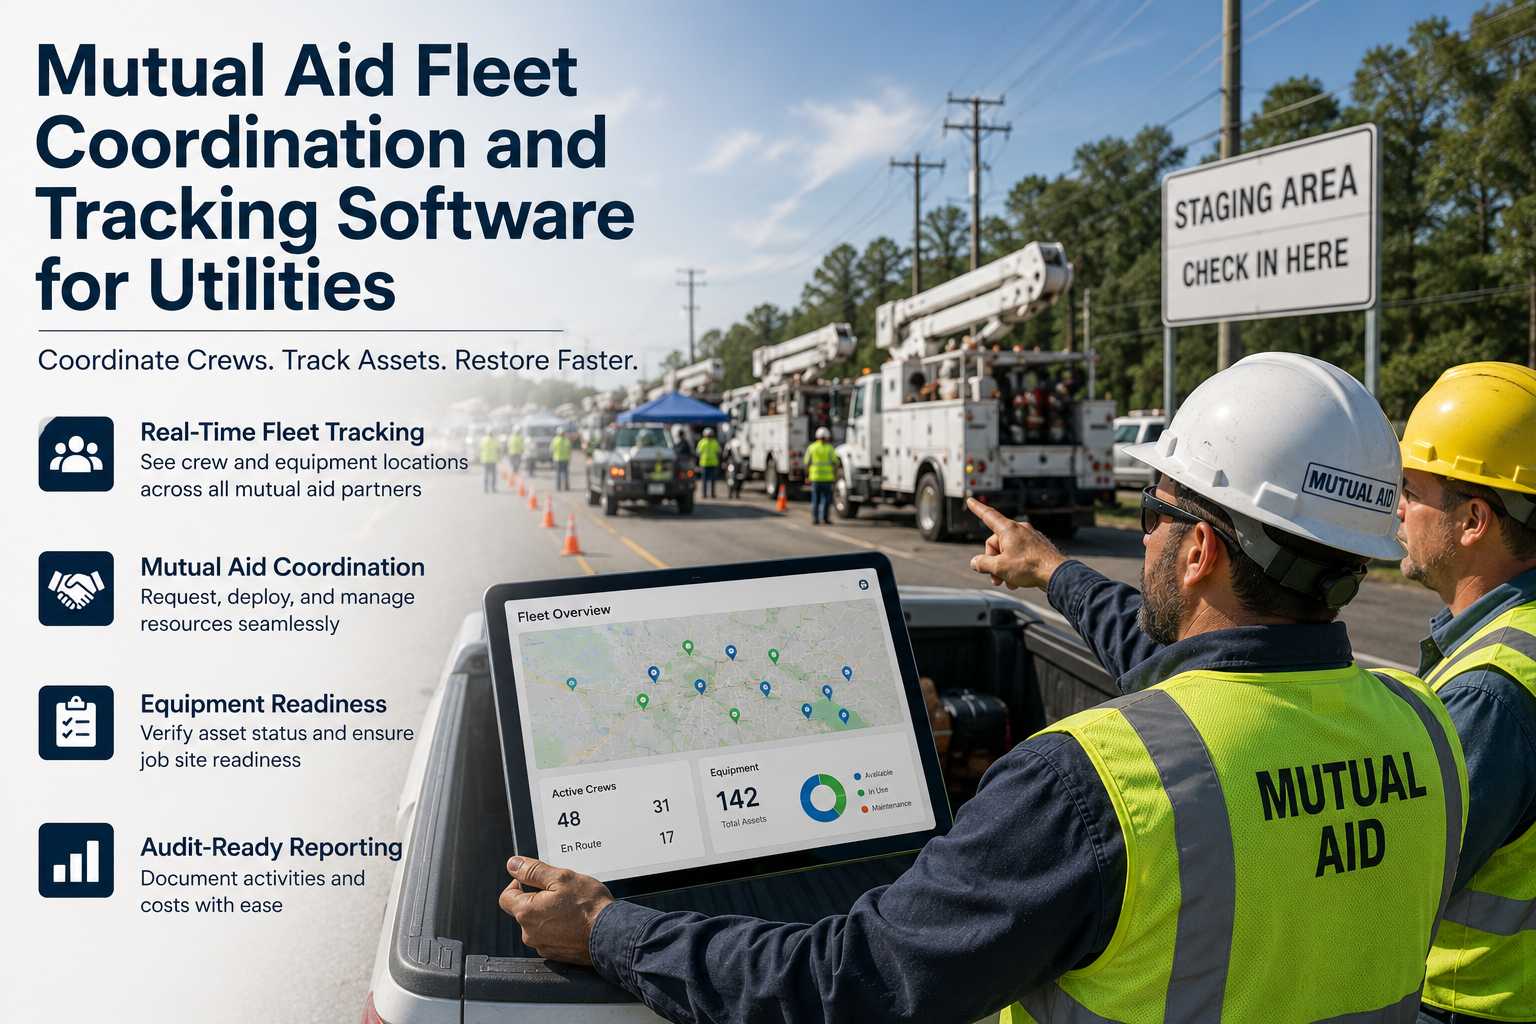
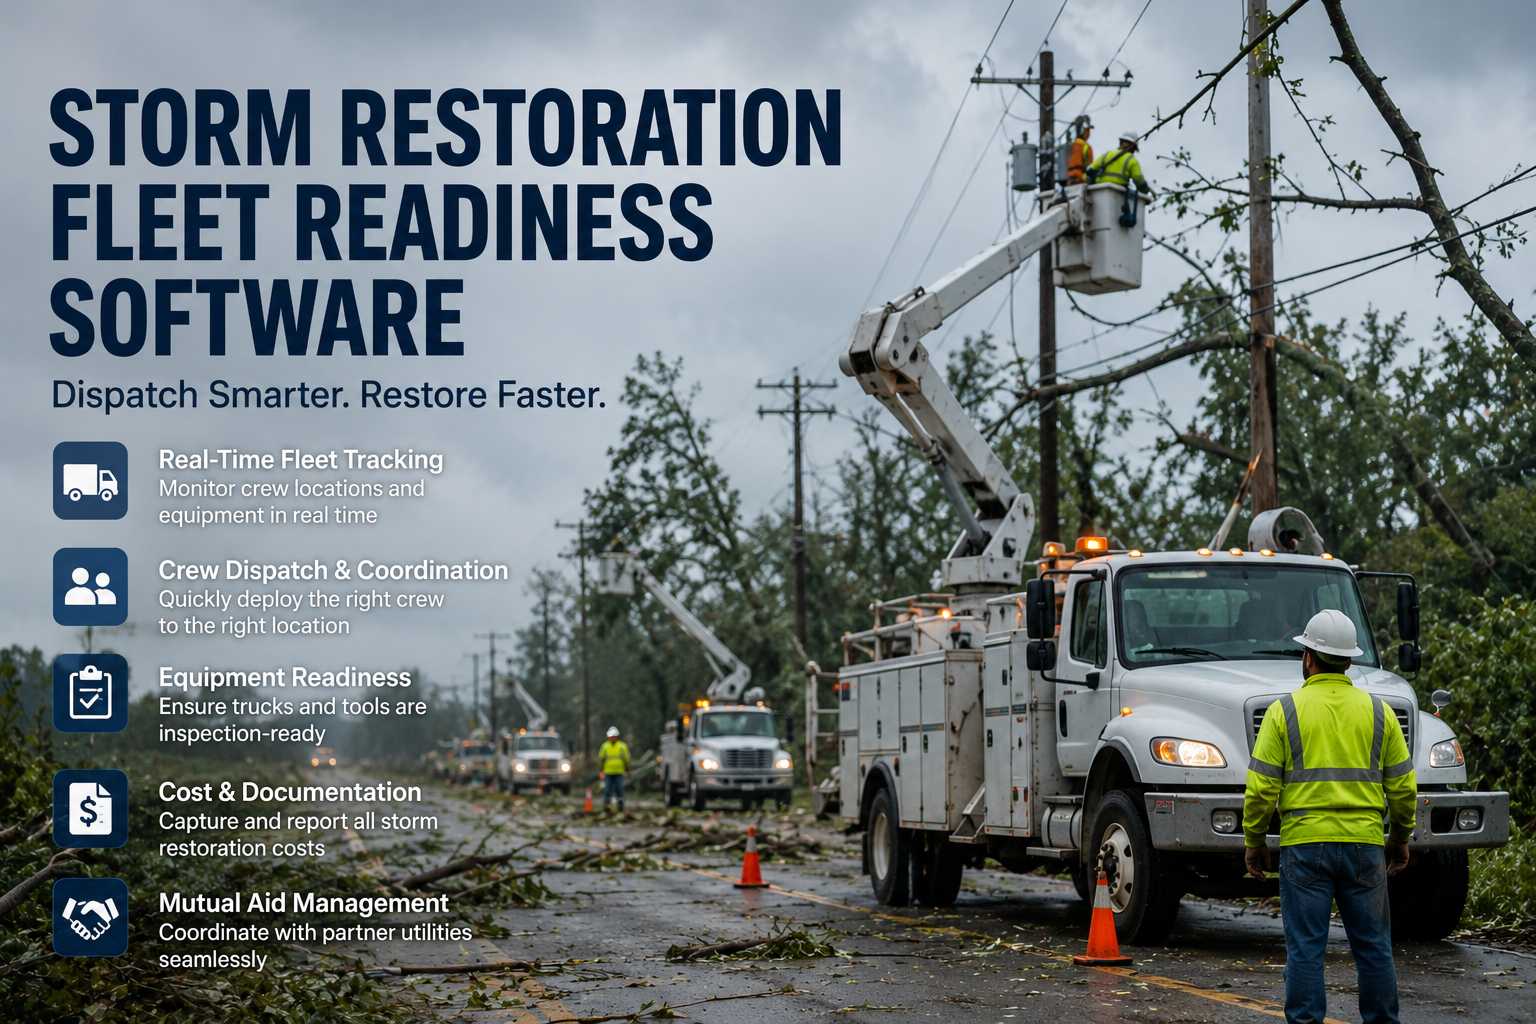
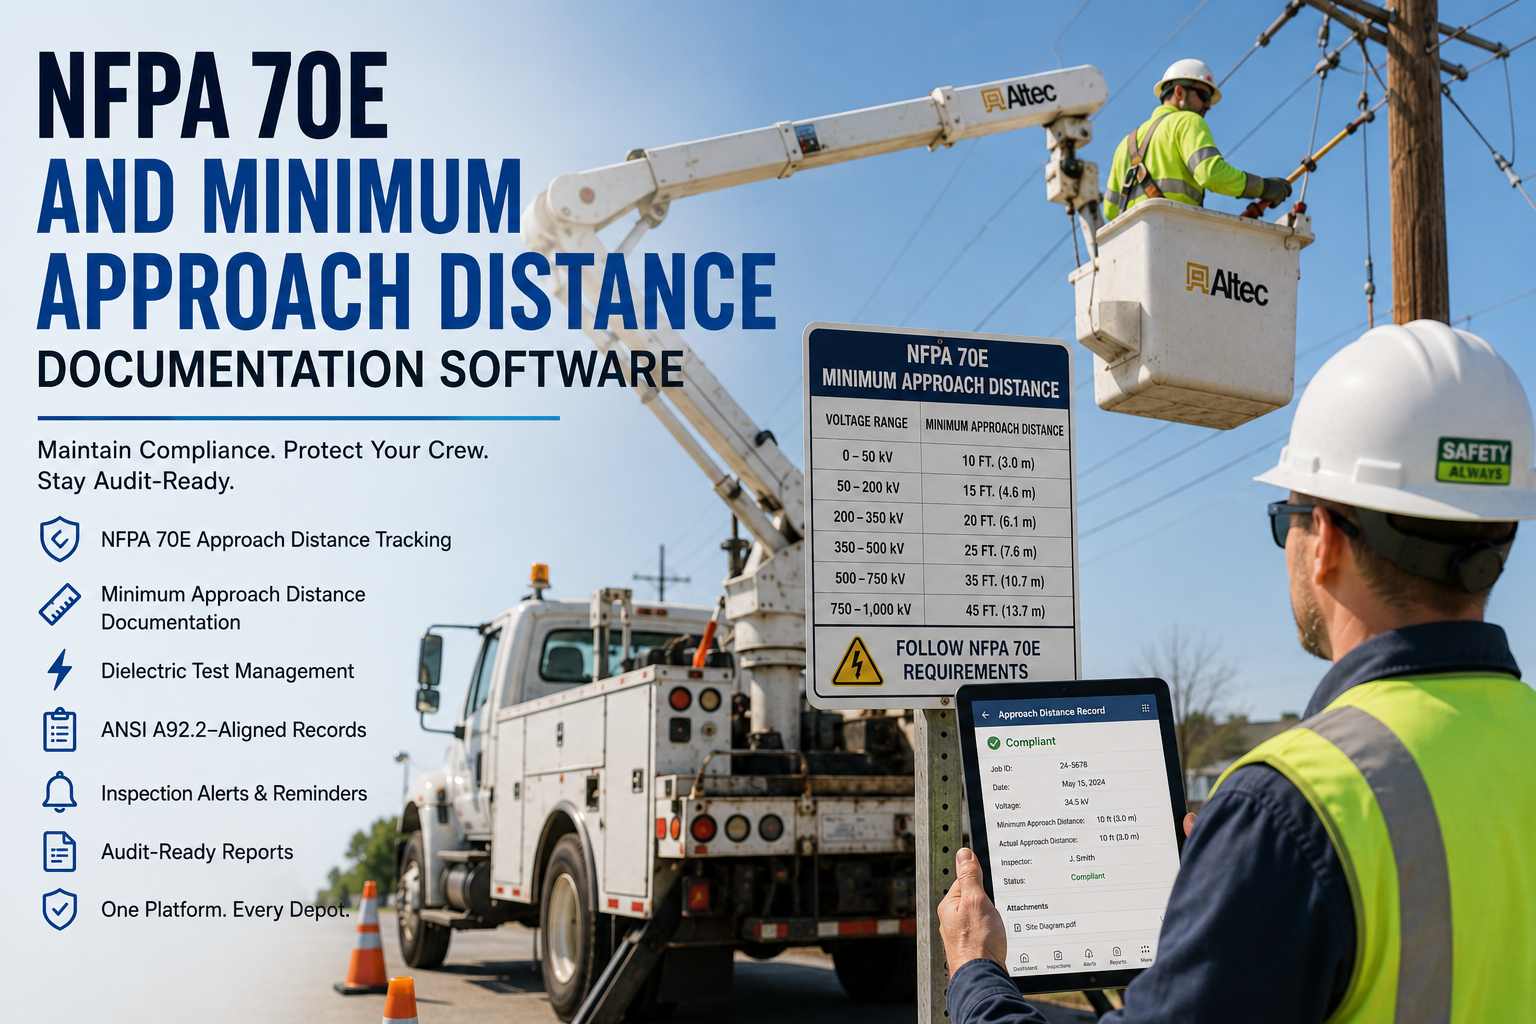
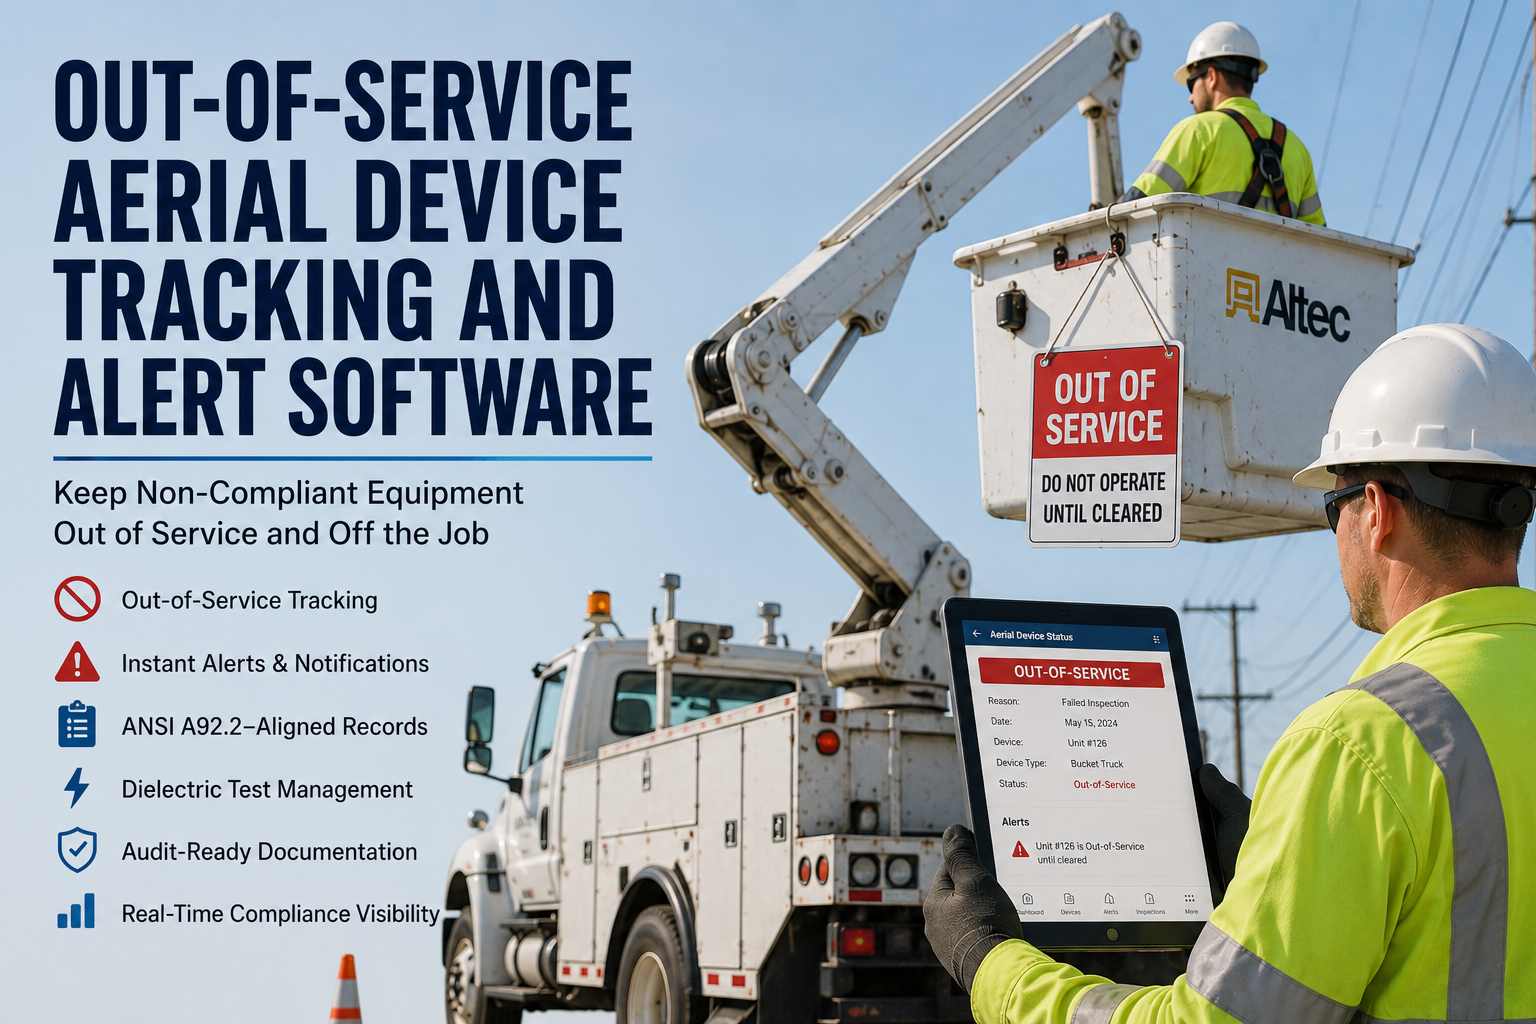
Utilities fleet managers face a persistent challenge: coordinating emergency response vehicles, bucket trucks, and service crews across dispersed territories while maintaining regulatory compliance and controlling operational costs. When maintenance schedules, fuel usage, and crew assignments are tracked in separate systems, critical insights get lost and response times suffer. Fleet Rabbit consolidates telematics, work orders, fuel data, and compliance records into unified analytics dashboards built for utility operations, enabling faster storm response, optimized crew deployment, and data-driven maintenance decisions. Book a Demo to see Fleet Rabbit in action.
75%
Reduction in manual reporting time for storm response and compliance documentation
10–15%
Fuel cost visibility improvement through route optimization and idle reduction analytics
96%
Preventive maintenance compliance rate for critical response vehicles
3.5 hrs
Average weekly time saved per fleet coordinator through automated dashboard reporting
Utility Fleet Analytics Should Support Storm Response, Not Slow It Down. Fleet Rabbit Delivers Clarity Under Pressure.
Fleet Rabbit transforms telematics, work order systems, fuel transactions, and compliance logs into structured, filterable dashboards designed for utility operations. Pre-built templates for bucket truck utilization, storm response tracking, and regulatory reporting require no custom configuration to start generating actionable insights.
Why Generic Fleet Analytics Fall Short for Utility Operations
Utility fleets operate under unique constraints that standard fleet reporting tools aren't designed to address. Understanding these gaps helps clarify what effective analytics should deliver for electric, gas, and water utilities.
Mileage Metrics Miss Equipment Utilization Patterns
Standard dashboards report miles driven, but utility assets like bucket trucks and digger derricks accumulate wear through engine hours and PTO usage. Without equipment-hour analytics, maintenance planning remains misaligned with actual operational demands.
Storm Response Reporting Requires Manual Compilation
Pulling vehicle location data, crew assignments, and fuel logs into post-storm reports consumes hours after events conclude. Delayed reporting impacts regulatory submissions and mutual aid reimbursement documentation.
Work Order Integration Gaps Create Data Silos
When fleet maintenance data lives separate from utility work order systems like Maximo or SAP, coordinating vehicle readiness with job scheduling requires manual reconciliation—introducing delays and error risk.
Regulatory Compliance Spans Multiple Frameworks
Utility fleets must satisfy DOT vehicle regulations, OSHA safety standards, and utility-specific reporting requirements. Managing these across disconnected systems increases administrative burden and audit exposure.
How Fleet Rabbit Delivers Utility-Ready Fleet Analytics
Fleet Rabbit replaces disconnected data sources with a unified analytics platform built for utility operational patterns. Insights flow from raw data to executive dashboards without manual intervention. See a live demo focused on utility fleet analytics workflows.
01
Unified Data Ingestion
Automatically imports telematics, maintenance records, fuel transactions, and work order data via API. Connects to Maximo, SAP, Oracle Utilities, and custom dispatch systems. Data refreshes every 60 seconds for near-real-time visibility during storm events.
02
Utility-Specific KPI Templates
Pre-built dashboards for bucket truck utilization, storm response metrics, equipment-hour maintenance compliance, and territory-level performance comparisons. Customize filters by service area, crew type, or asset category without technical configuration.
03
Automated Regulatory Reporting
Generate DOT inspection summaries, OSHA safety documentation, and utility commission reports with one click. All outputs include tamper-evident timestamps and export in audit-ready formats for regulatory submissions.
04
Fuel Analytics with Territory Attribution
Track fuel consumption by vehicle, crew, route, and service territory. Identify idling patterns at job sites, route inefficiencies, and driver behavior impacts with drill-down capability to individual events for targeted coaching.
05
Specialized Equipment Maintenance Intelligence
Analyze maintenance costs per equipment type—bucket trucks, digger derricks, cable pullers—and track component failure trends. Support lifecycle planning with evidence-based total cost of ownership data for capital budgeting decisions.
06
Role-Based Dashboard Access
Configure view permissions so field crews see only their assignments, mechanics see work orders, dispatchers see real-time availability, and executives see consolidated KPIs. Single platform, tailored visibility for every utility team level.
Regulatory Reporting Support: Built for Utility Compliance
Compliance analytics are pre-configured for common utility regulatory requirements. No custom templates or manual compilation needed.
DOT Vehicle Regulations
Automated DVIR completion tracking, annual inspection scheduling status, and roadside inspection readiness reports. Exportable in FMCSA-approved formats for audit submission.
OSHA Safety Standards
Vehicle inspection records, incident documentation, and operator certification tracking with version control and full audit trails for utility safety program compliance.
Utility Commission Reporting
Storm response metrics, mutual aid deployment documentation, and service territory performance reports formatted for state public utility commission submissions.
Environmental Compliance
Fuel consumption monitoring and emissions calculations auto-generated for federal and state environmental reporting requirements applicable to utility fleets.
Fleet Rabbit Analytics Deployment Roadmap for Utilities
Fleet Rabbit follows a structured analytics deployment approach designed for utility data complexity — delivering initial dashboards within the first week and full KPI coverage within 2–3 weeks. No custom development required for standard utility metrics.
01
Data Source Mapping
Identify telematics, work order, fuel, and compliance systems
02
API Integration Setup
Connect data sources and configure refresh schedules
03
KPI Template Selection
Choose pre-built utility dashboards and customize filters
04
User Access Configuration
Set role-based permissions for crews, mechanics, dispatchers
05
Analytics Go-Live
Enable dashboards and schedule automated report distribution
2–3 Week Analytics Deployment and Insight Timeline
Every Fleet Rabbit analytics engagement for utilities follows a phased program with defined deliverables — and measurable reporting efficiency gains beginning within the first 14 days. Request the full analytics deployment scope document tailored to your service territory and fleet size.
Week 1
Data Integration & Setup
Audit existing data sources: telematics providers, work order systems, fuel cards, and compliance records
Configure API connections for automated data ingestion with 60-second refresh intervals
Select initial KPI templates: equipment-hour utilization, storm response metrics, PM compliance rates
Week 2
Dashboard Configuration
Customize dashboard filters by service territory, crew type, asset category, or time period
Configure role-based access permissions for field crews, maintenance staff, and leadership
Validate data accuracy against source systems and adjust transformation rules as needed
Week 3
Reporting Automation
Schedule automated report distribution: daily operational summaries, weekly KPI digests, monthly compliance packs
Enable mobile dashboard access for field supervisors and remote dispatchers
Deliver analytics baseline report: current performance metrics and improvement opportunity highlights
REPORTING EFFICIENCY GAINS TYPICALLY OBSERVED WITHIN 30 DAYS
Utility fleets completing the analytics deployment program report measurable reductions in manual reporting time, improved data accuracy, and faster access to operational insights. Results vary by fleet size, data source complexity, and adoption consistency.
75%
Manual reporting time reduction
96%
PM compliance rate for critical vehicles
3.5 hrs
Weekly time saved per coordinator
Turn Utility Fleet Data Into Faster Response Times. Deploy Analytics in Weeks, Not Months.
Fleet Rabbit's utility-focused analytics deployment means no custom development for standard metrics, optional advanced configuration for unique requirements, and measurable reporting efficiency within the first two weeks. Pricing starts at $5/vehicle/month with a 14-day free trial for up to 3 assets.
Use Cases and Outcomes from Utility Fleet Analytics Deployments
These outcomes reflect analytics deployments at operating utility fleets. Each use case represents post-deployment observations shared by fleet managers. Request the full case study for the utility type most relevant to your operations.
A regional electric utility with 85 bucket trucks needed better visibility into equipment utilization across service territories. Fleet Rabbit's equipment-hour dashboards revealed underutilized assets and high-wear operating patterns. Maintenance scheduling was adjusted based on actual usage data, improving PM compliance and reducing emergency repairs during peak storm season.
75%
Reporting time reduction
3.5 hrs
Weekly time saved
A natural gas distributor needed to document crew deployment and vehicle usage during emergency response events. Fleet Rabbit's storm response dashboards provided real-time visibility into crew locations, vehicle availability, and fuel consumption. Post-event reporting time was reduced from days to hours, supporting faster regulatory submissions and mutual aid reimbursement.
10–15%
Fuel visibility improvement
Automated
Post-event reports
A municipal water utility needed to coordinate fleet maintenance with scheduled infrastructure work orders. Fleet Rabbit's integration with their work order management system enabled automatic vehicle readiness checks before crew dispatch. Maintenance delays due to vehicle unavailability were reduced, improving overall job completion rates.
96%
Vehicle readiness rate
<2 hrs
Maintenance coordination time
Automated
Readiness alerts
What Utility Fleet Teams Say About Fleet Rabbit Analytics
Before Fleet Rabbit, our storm response documentation required pulling data from three different systems. Now we generate the same reports in minutes with pre-built dashboards. That efficiency lets our team focus on restoring service, not compiling paperwork.
Fleet Operations Manager
Regional Electric Utility, Southeast
Frequently Asked Questions
What utility management systems does Fleet Rabbit integrate with?
Fleet Rabbit connects to major work order and asset management platforms including IBM Maximo, SAP EAM, Oracle Utilities, and custom dispatch systems via REST API. Most integrations are configured within 2–5 business days with implementation support included.
Can I customize dashboards without technical expertise?
Yes. Fleet Rabbit's no-code dashboard builder lets users select metrics, apply filters, and arrange visualizations through a drag-and-drop interface. Advanced users can create calculated fields or custom aggregations using a simplified expression language.
How does Fleet Rabbit handle storm response reporting?
Pre-built storm response dashboards track crew deployment, vehicle utilization, fuel consumption, and service restoration metrics in real time. Reports can be automatically generated post-event with timestamps and location data for regulatory submissions or mutual aid documentation.
Does Fleet Rabbit support GIS or service territory mapping?
Yes. Fleet Rabbit supports GIS integration for service territory visualization and filtering. Analytics can be segmented by district, circuit, or custom geographic boundaries to align with utility operational structures.
Can I export analytics data for external reporting?
Yes. All dashboards support export to CSV, Excel, or PDF formats. Scheduled reports can be automatically emailed to stakeholders or pushed to external systems via webhook integration for utility commission submissions.
What are the pricing options for utility fleets?
Fleet Rabbit's Business Plan includes full analytics capabilities at $5 per vehicle per month, billed annually. A free trial is available for up to 3 assets with no credit card required. Enterprise plans with custom integrations and dedicated support are available upon request.
Make Data-Driven Decisions for Utility Fleet Operations. Deploy Analytics in Weeks, Not Months.
Fleet Rabbit gives utility fleet managers unified data ingestion, utility-specific KPI templates, automated regulatory reporting, and role-based dashboard access — all in a platform built for service territory operations, at $5/vehicle/month, with a 14-day free trial.
Pre-built dashboards for bucket truck utilization and storm response metrics
Automated DOT, OSHA, and utility commission reporting with one-click export
Fuel analytics with crew, route, and territory-level attribution
No-code dashboard customization with GIS and service area filtering
May 26, 2026
By Jason
All Posts