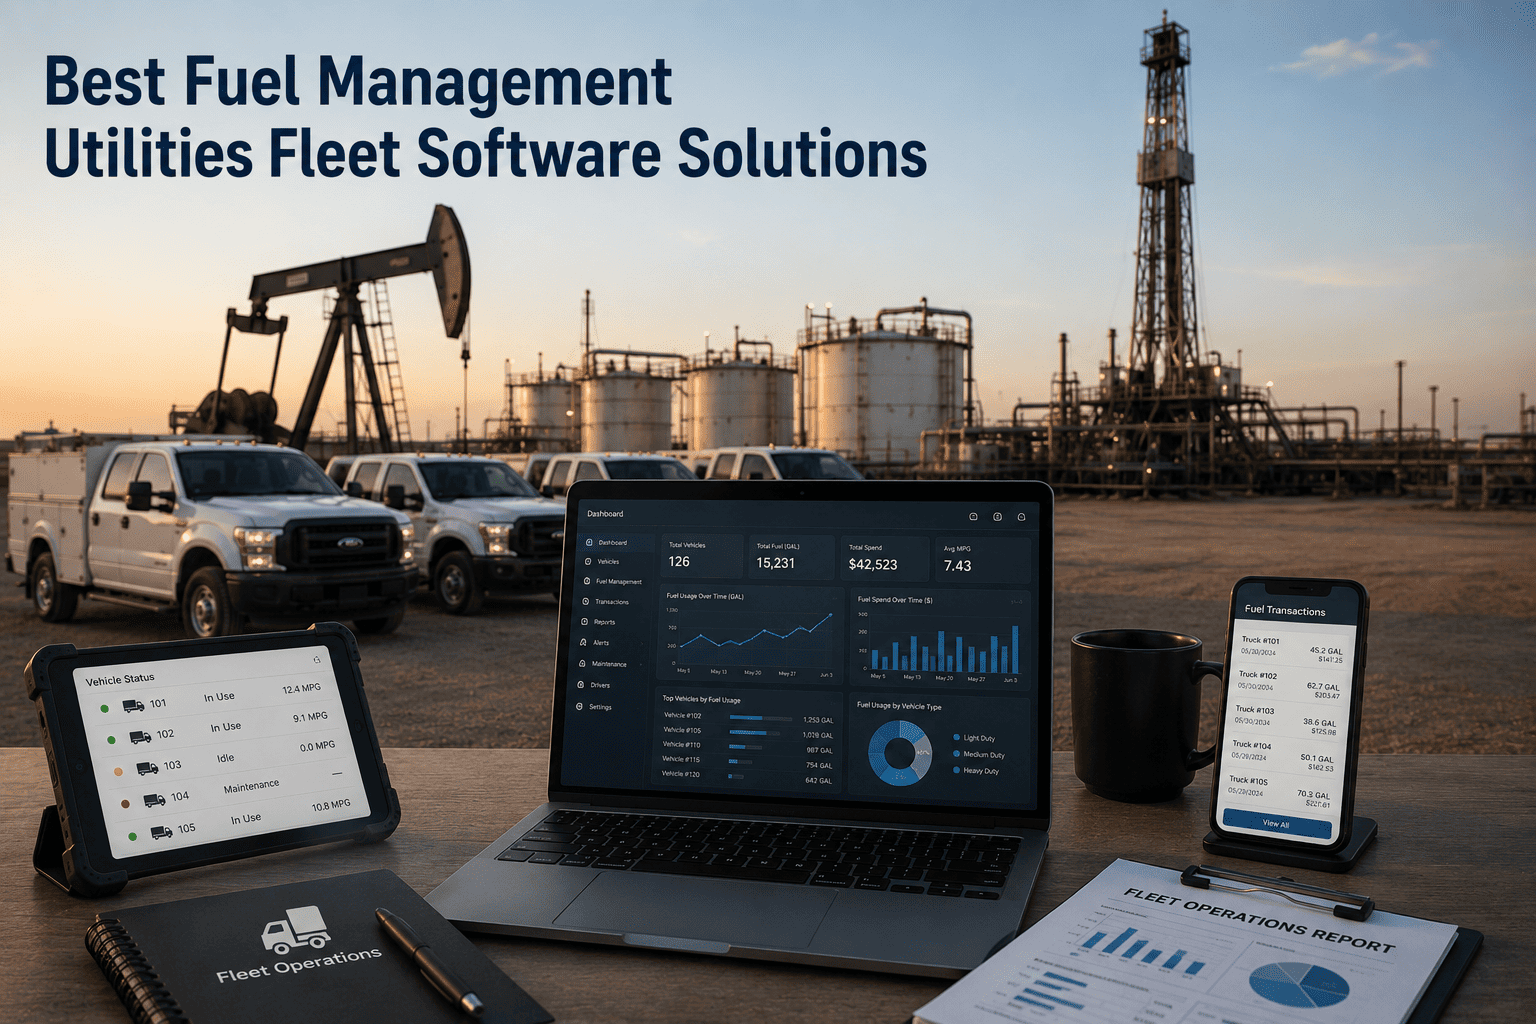
Utilities fleet managers overseeing power line maintenance, water service, and municipal operations face fuel costs that represent 25–40% of vehicle operating budgets — with idling during PTO operations, inefficient service routing, and untracked consumption across dispersed service territories driving avoidable waste. Fleet Rabbit provides fuel analytics integrated with existing telematics and fuel card systems to quantify consumption by vehicle, route, and crew, identify waste patterns specific to utility operations, and support targeted coaching — helping teams improve fuel efficiency without replacing current hardware or disrupting field service workflows. Book a Demo to see fuel analytics for utilities in action.
25–40%
Fuel costs as percentage of vehicle operating expenses in typical utilities fleets
1.0–1.8 gal/hr
Fuel consumed during PTO operation and idle, varying by equipment type and load
8–14%
Typical fuel reduction achievable through structured monitoring and operational adjustments
$5/vehicle/mo
Fleet Rabbit pricing with monthly billing, no hardware requirements, and no long-term contracts
Fuel Waste in Utilities Fleets Is Measurable. Reducing It Starts with Operational Visibility.
Fleet Rabbit captures fuel transactions, engine runtime, location, and crew data from your existing systems to quantify consumption patterns, flag anomalies during PTO use or service calls, and support coaching conversations — all within a platform that integrates with work order systems, compliance workflows, and dispatch tools used by utilities teams.
Understanding Fuel Management Challenges in Utilities Fleet Operations
Effective fuel management for utilities requires understanding the operational realities that drive consumption in service territory contexts. Dispersed service areas, variable duty cycles including PTO operation, and limited real-time visibility combine to create patterns that are difficult to address without structured analytics tailored to utility workflows.
PTO and Equipment Idle Accumulates Without Attribution
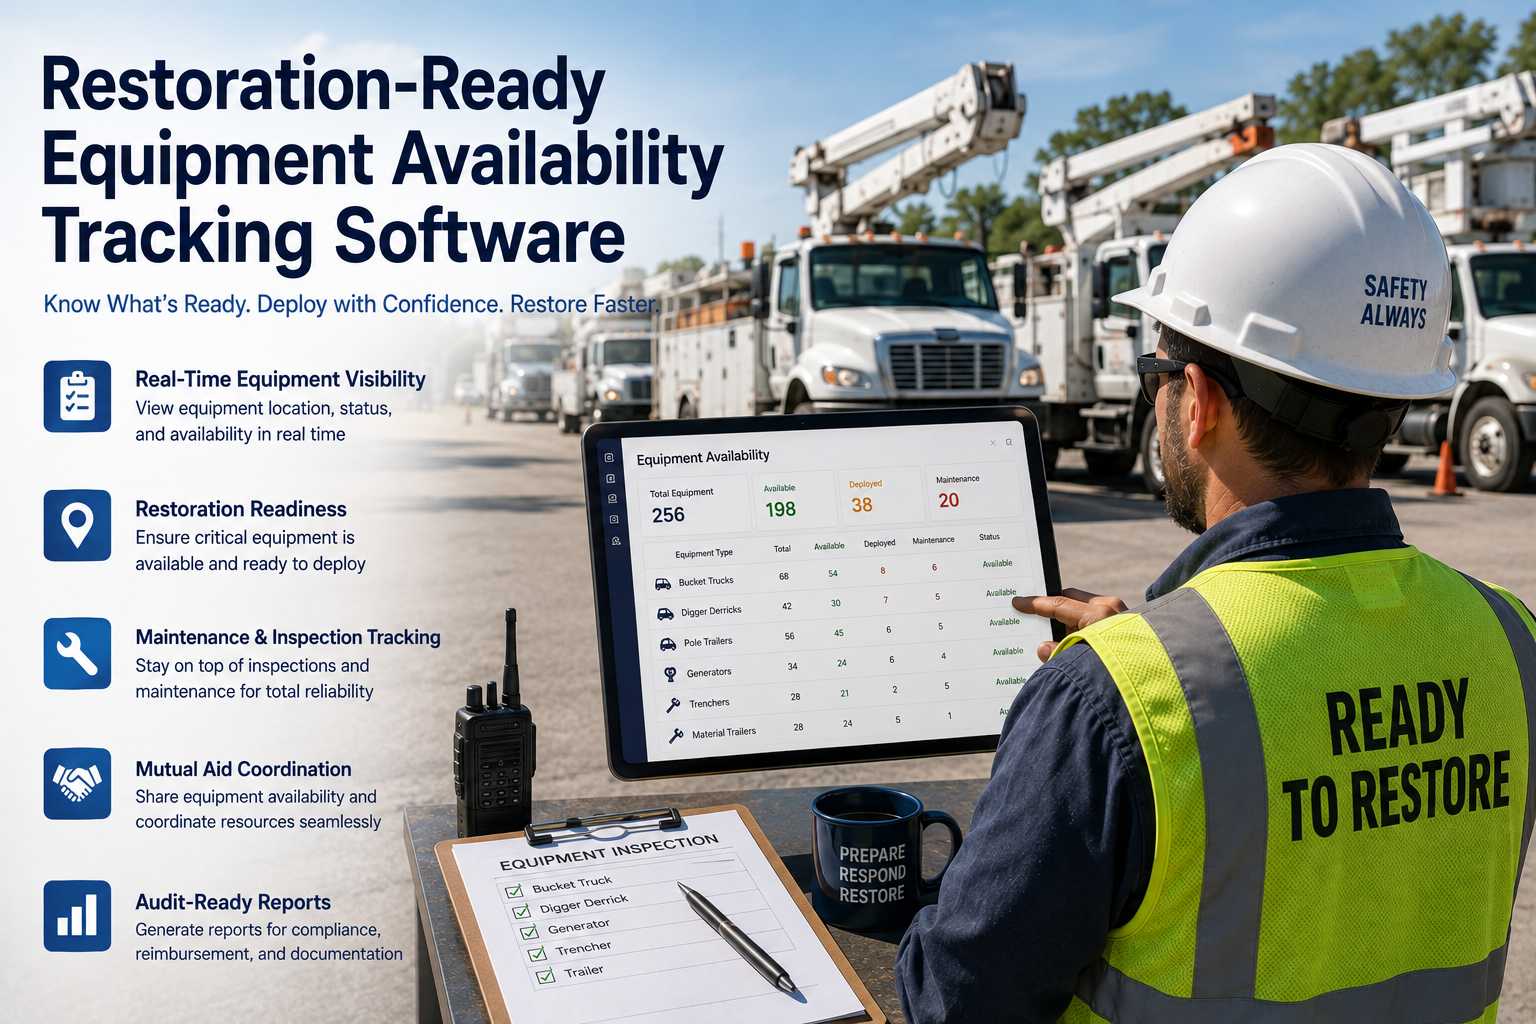
Bucket trucks, digger derricks, and service vehicles idling for PTO operation during line work, meter reads, or emergency response consume fuel without generating productive miles. Without granular tracking that distinguishes PTO idle from unnecessary idling, identifying waste requires manual review.
Service Territory Routing Inefficiencies Increase Fuel Spend
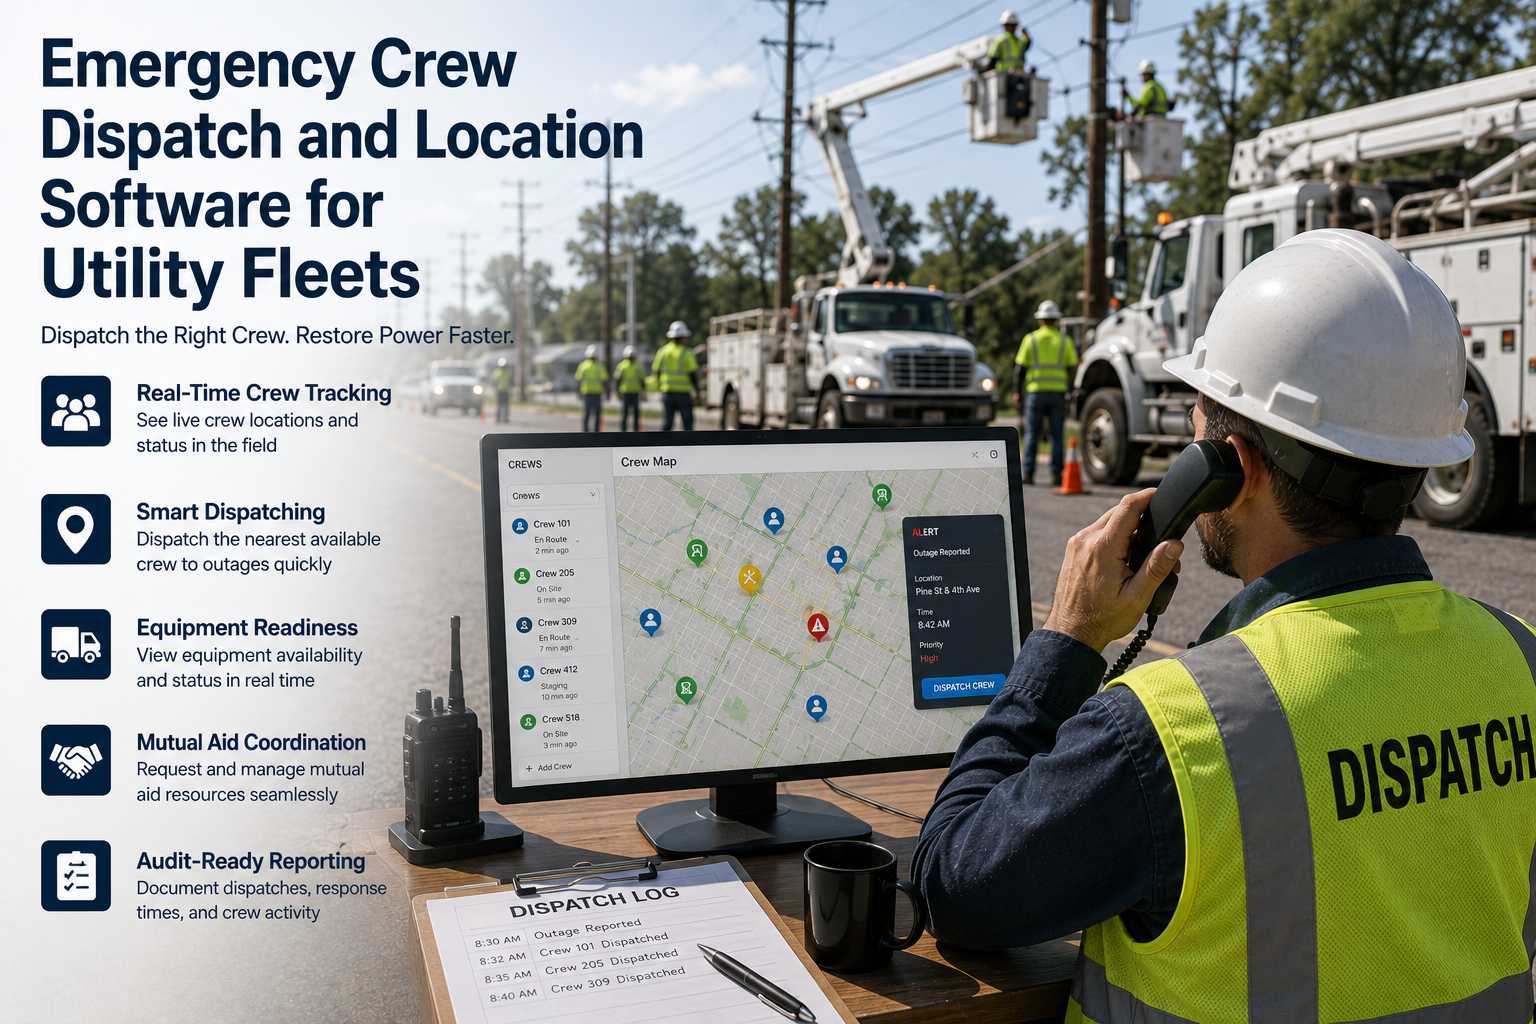
Backtracking between service calls, suboptimal sequencing of work orders, and last-minute dispatch changes add unnecessary miles. Without per-route analytics correlated to work order systems, identifying and correcting these patterns relies on crew recollection or dispatcher observation.
Mixed Vehicle Types Complicate Consumption Benchmarking
Utilities fleets operate bucket trucks, service vans, heavy equipment, and light-duty vehicles with vastly different fuel profiles. Without vehicle-type-specific benchmarks, comparing efficiency across the fleet becomes misleading and limits targeted improvement efforts.
Fuel Transactions Lack Work Order Context
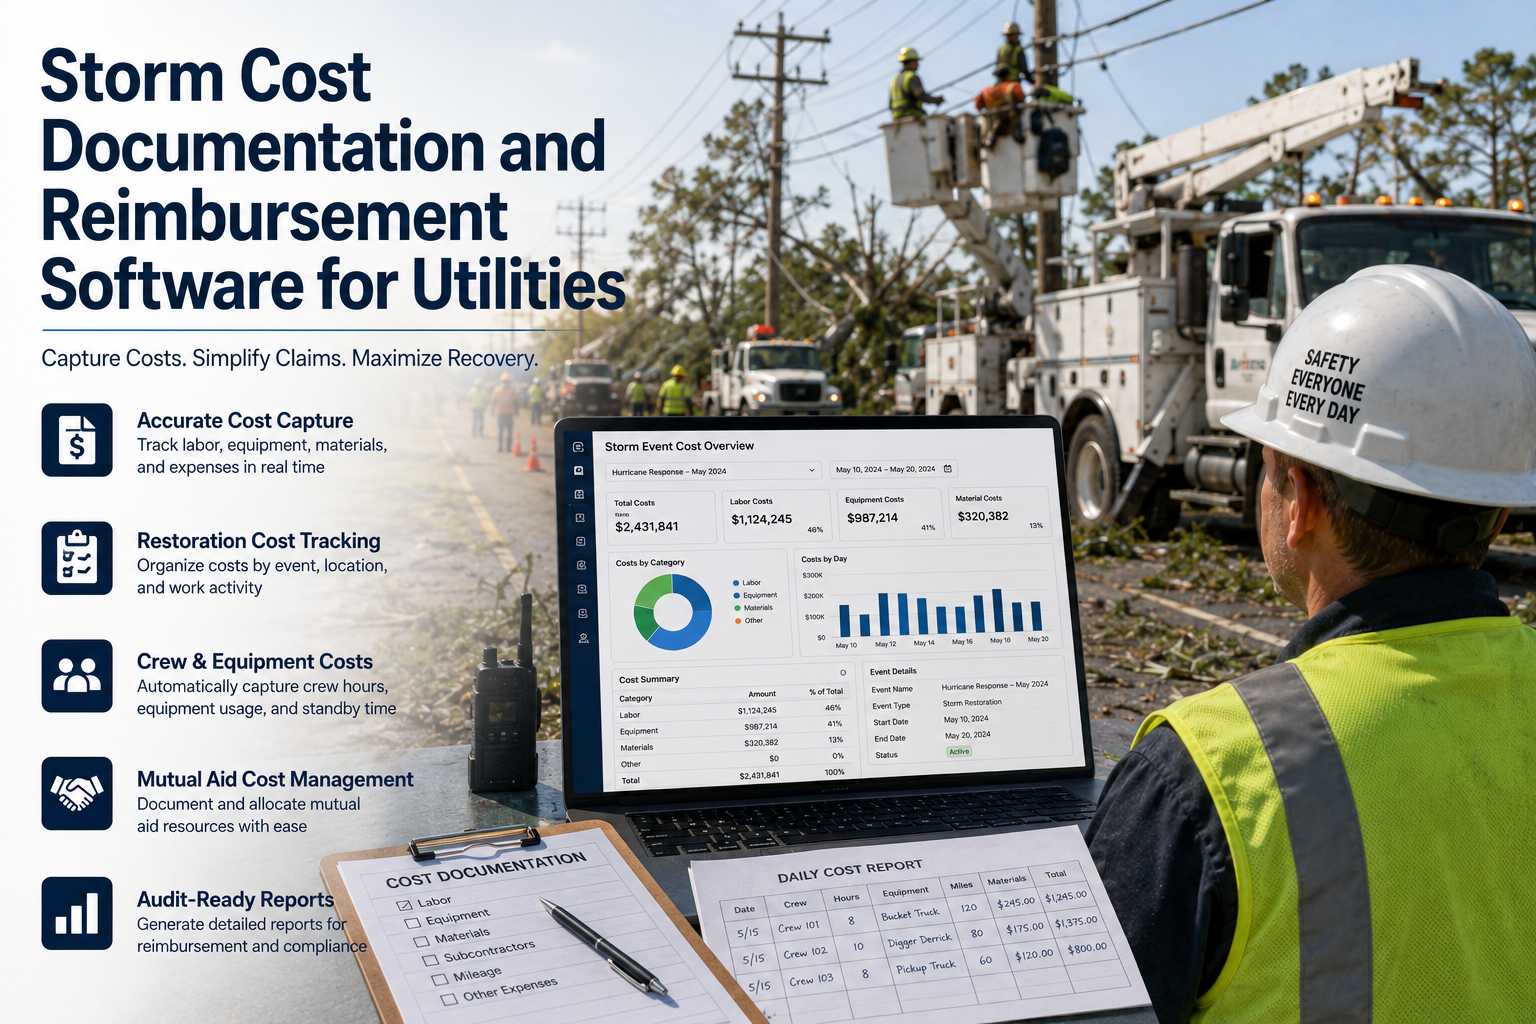
When fuel purchases are aggregated at the account level, correlating spend with specific vehicles, crews, service calls, or operational periods requires manual reconciliation across dispatch, maintenance, and fuel card systems, delaying corrective action.
Key Metrics for Utilities Fleet Fuel Management
Tracking the right metrics enables targeted improvement. The following indicators provide a foundation for fuel management programs in utilities fleet operations.
01
Fuel Consumption per Service Call
Measures gallons used per completed work order or service call. Helps identify routes or crews with unusually high consumption for further investigation.
02
PTO vs. Travel Idle Separation
Distinguishes fuel consumed during productive PTO operation from unnecessary stationary idle. Enables accurate assessment of operational vs. avoidable fuel use.
03
Fuel Cost per Vehicle Type
Tracks fuel spend relative to vehicle class (bucket truck, service van, heavy equipment). Useful for comparing efficiency across equipment categories and informing replacement decisions.
04
Route-Level Fuel Efficiency by Territory
Measures fuel consumption for specific service territories or route sequences. Supports targeted routing adjustments and crew scheduling optimization.
05
Crew-Specific Consumption Patterns
Compares fuel efficiency across crews operating similar vehicles on comparable service calls. Enables focused coaching conversations without penalizing operational necessities.
06
Fuel Transaction Anomalies by Location
Flags purchases that deviate from expected patterns by vehicle, service territory, or time period. Helps identify potential waste, theft, or unauthorized use.
How Fleet Rabbit Supports Fuel Management for Utilities Fleets
Fleet Rabbit does not replace your existing fuel card provider, telematics system, or work order platform. Instead, it layers analytics and alerting on top of data you are already collecting, helping utilities teams act on fuel patterns with operational context and consistency. See how fuel analytics integrates with your current utility fleet setup.
01
Fuel Card Integration for Utilities
Connects to major fuel card providers including WEX and Fleetcor via API. Matches transactions to specific vehicles, crews, and service territories for accurate consumption attribution.
02
Telematics and Work Order Correlation
Integrates with existing GPS/telematics providers including Geotab, Samsara, and Verizon Connect to correlate fuel purchases with location, PTO status, idle time, and work order data.
03
Consumption Reporting by Crew and Territory
Generate weekly or monthly reports ranking fuel efficiency by crew, vehicle type, service territory, or work order category. Export to PDF or CSV for performance reviews or budget planning.
04
PTO-Aware Anomaly Detection
Configurable thresholds flag unusual fuel consumption patterns — such as unexpected purchases, excessive non-PTO idle, or route deviations — with context on estimated impact and operational justification.
05
Geofenced Service Territory Tracking
Apply different fuel expectations to specific service territories or operational zones — for example, higher allowances for rural emergency response versus stricter limits for urban scheduled maintenance.
06
Crew Coaching and Sustainability Reporting
Share fuel reports with crews through the mobile app, enabling targeted conversations about specific patterns. Track progress over time and generate ESG/sustainability reports for municipal or regulatory submissions.
Regulatory and Operational Context for Utilities Fuel Management
While fuel management primarily targets cost efficiency, several regulatory and operational frameworks make accurate tracking valuable for compliance and reporting as well.
Municipal Sustainability Reporting
Fuel consumption data supports accurate emissions calculations and sustainability metrics for municipal ESG reporting, public utility commission submissions, and community transparency initiatives.
State Fuel Tax and IFTA Compliance
Accurate mileage and fuel purchase records support International Fuel Tax Agreement (IFTA) reporting and state fuel tax compliance for utilities operating across jurisdictional boundaries.
DOT Hours of Service for Commercial Units
Correlating fuel transactions with duty status records helps validate operating patterns during FMCSA audits for commercial-class utility vehicles and equipment transporters.
Grant and Funding Accountability
Many utilities receive state or federal funding with fuel efficiency or emissions reduction requirements. Structured fuel analytics provides auditable documentation for grant compliance and renewal applications.
Fleet Rabbit Fuel Analytics: Capabilities Comparison for Utilities
A feature-level summary focused on fuel management capabilities relevant to utilities fleet operations. All capabilities integrate with existing hardware and software where applicable. Competitor data sourced from publicly available documentation as of 2024.
Pricing based on Fleet Rabbit standard rate at $5/vehicle/month. Competitor pricing reflects publicly listed ranges and may vary by feature tier, volume, or region. Feature availability subject to integration configuration.
Implementation Approach for Utilities Fuel Analytics
Fleet Rabbit follows a phased onboarding process designed for dispersed utilities operations—delivering initial fuel visibility within the first week, with full analytics active across the fleet within two to three weeks. No hardware replacement is required when existing telematics and fuel card systems are compatible.
01
System Audit
Confirm fuel card, telematics, and work order data availability
02
Integration Setup
Connect fuel card, telematics, and dispatch APIs
03
Baseline Configuration
Set consumption thresholds and PTO-aware alert rules
04
Pilot Validation
Test with select crews and service territories
05
Full Production
Fleet-wide fuel monitoring go-live with sustainability reporting
Realistic Expectations for Utilities Fuel Efficiency Improvement
Fuel efficiency improvement for utilities is an operational initiative supported by data. Results vary based on fleet size, vehicle mix, service territory geography, and consistency of coaching. The following ranges reflect patterns observed across multiple utilities deployments.
Weeks 1–2
Baseline and Visibility
Fuel analytics activated using existing fuel card and telematics data
Initial reports identify top consumption contributors by vehicle type, crew, and service territory
No crew communication yet — establishing objective baseline metrics with PTO context
Weeks 3–6
Coaching and Adjustment
Share fuel reports with crews through mobile app or team meetings
Adjust geofenced policies for territories with legitimate extended PTO or emergency response needs
Track weekly changes to identify early improvement patterns without impacting service quality
Weeks 7–12
Sustained Practice and Review
Fleet fuel efficiency typically stabilizes after initial adjustments
Fuel transaction data correlated with work order completion and operational patterns for cost validation
Quarterly review to assess maintenance impact, sustainability metrics, and policy refinements
TYPICAL OUTCOMES AFTER 90 DAYS
Utilities fleets implementing structured fuel monitoring and coaching often see average fuel consumption per vehicle decrease by 8–14% from baseline levels. Annual savings typically range from $500 to $1,600 per vehicle, depending on local fuel prices, baseline consumption patterns, vehicle mix, and operational context. Sustainability reporting capabilities support ESG and municipal transparency requirements.
$500–$1,600
Annual savings/vehicle
2–4 weeks
To initial visibility
Use Cases from Utilities Fleet Fuel Management
These examples reflect common patterns observed during fuel analytics implementations in utilities contexts. Individual results depend on fleet composition, service territory complexity, and program consistency.
A regional electric utility supporting line maintenance and meter services had no systematic fuel tracking beyond account-level statements. Initial analytics showed average consumption of 12.8 MPG across mixed vehicle types. After introducing crew reports and PTO-aware idle coaching, average consumption improved to 14.3 MPG within 11 weeks. Fuel spend decreased approximately 11% on comparable operational periods.
11 weeks
To stabilization
A municipal water utility needed to reduce fuel costs without impacting emergency response readiness. Geofenced idle policies allowed longer thresholds for emergency response vehicles while maintaining stricter limits for scheduled maintenance crews. Overall fleet non-PTO idle decreased 39% without impacting operational readiness, contributing to a 10% reduction in fuel spend.
39%
Non-PTO idle reduction
Geofenced
Policy approach
A municipal fleet operator integrated WEX fuel card data with telematics location and PTO reports to support city sustainability reporting. This enabled correlation of fuel purchases with specific service territories, vehicle types, and operational periods, supporting accurate emissions calculations. Fuel spend per mile improved 8% over a 3-month period while generating auditable ESG documentation.
WEX + telematics
Data integration
What Utilities Fleet Teams Note About Fuel Analytics
Having fuel data by service territory and vehicle type helped us identify which patterns were driving our highest consumption. That clarity let us focus coaching where it mattered most, without adding administrative overhead or impacting emergency response readiness.
Fleet Operations Manager
Regional Electric Utility Provider
Frequently Asked Questions
Does fuel analytics require new hardware for utilities fleets?
No. Fleet Rabbit connects to existing fuel card providers and telematics systems via API. If your current systems log fuel transactions, vehicle location, and PTO status, fuel analytics can typically be enabled without hardware changes.
Which fuel card providers does Fleet Rabbit integrate with?
Fleet Rabbit supports integration with major fuel card providers including WEX and Fleetcor via API. Additional providers can be evaluated during the onboarding audit phase.
Can we set different fuel expectations for different service territories?
Yes. Geofencing allows you to define service territories with custom fuel expectations. For example, rural emergency response zones may have different consumption benchmarks than urban scheduled maintenance areas with more routing flexibility.
How does PTO tracking support fuel management for utilities?
PTO operation directly impacts fuel consumption for bucket trucks, digger derricks, and other equipment. By correlating PTO status with fuel transactions, teams can distinguish productive equipment use from unnecessary idle. This supports targeted coaching and policy adjustments without penalizing operational necessities.
What reporting is available for sustainability or municipal compliance?
Reports can be generated by vehicle type, crew, service territory, or time period. Weekly and monthly summaries highlight consumption patterns and trends. Exportable sustainability reports support ESG submissions, municipal transparency initiatives, and grant compliance documentation.
What is the pricing for Fleet Rabbit fuel analytics?
Fleet Rabbit is priced at $5 per vehicle per month, billed monthly with no long-term contract. A free tier is available for up to 3 vehicles to evaluate functionality before scaling across your utilities fleet.
Make Utilities Fleet Fuel Consumption Visible. Support Smarter Operational and Sustainability Decisions.
Fleet Rabbit helps utilities fleet teams quantify fuel patterns using existing fuel card and telematics data, enabling targeted coaching, operational adjustments, and auditable sustainability reporting. Start with a 14-day trial to assess fuel baselines across your fleet — no hardware changes required.
Integrates with WEX, Fleetcor, and major telematics providers
PTO-aware fuel tracking for bucket trucks and equipment
Service territory and work order correlation for accurate attribution
Exportable sustainability and ESG reports for municipal compliance
May 26, 2026
By Jason
All Posts