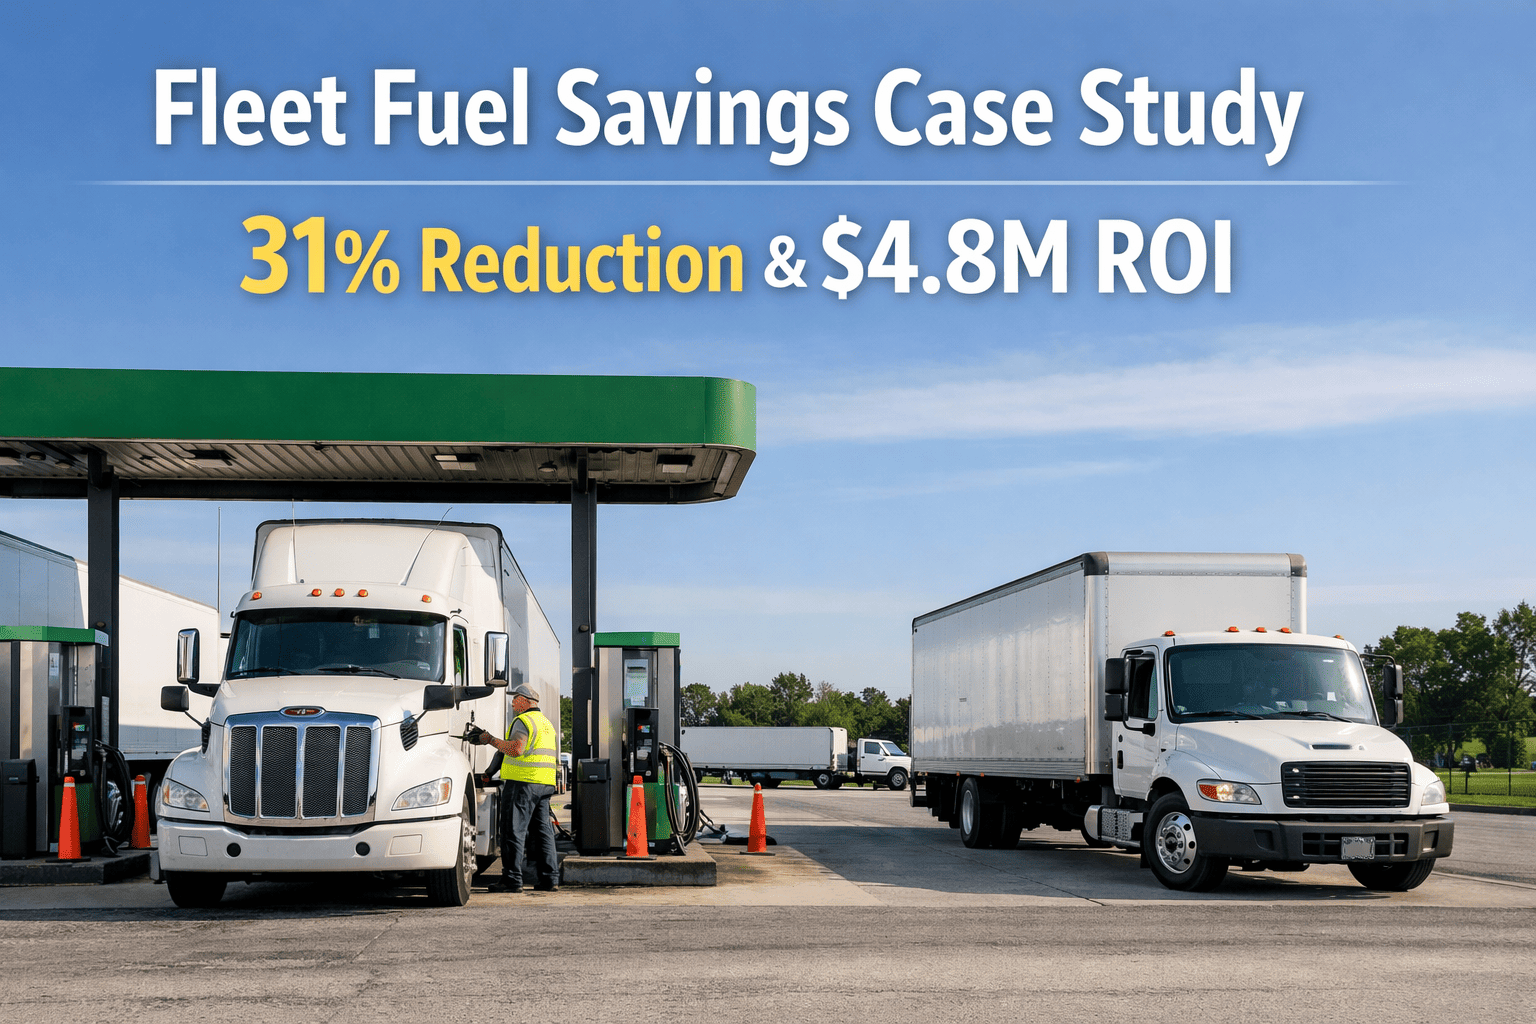
A major logistics company operating a fleet of 850 commercial vehicles implemented a revolutionary deep learning-based fault prediction system that transformed their maintenance operations. By analyzing patterns in vehicle sensor data, maintenance logs and operational parameters, the system predicts component failures an average of 14 days before occurrence with 94.7% accuracy. The deep learning model processes over 847 engineered features from multiple data streams including real-time sensor readings, historical maintenance records, environmental conditions, and driver behavior metrics. This comprehensive approach enables the system to detect subtle anomalies and degradation patterns that traditional rule-based monitoring systems consistently miss. The result is a proactive maintenance strategy that not only prevents costly breakdowns but also optimizes parts inventory, improves technician productivity and extends overall vehicle lifespan.
Executive Summary
A major logistics company operating a fleet of 850 commercial vehicles implemented a revolutionary deep learning-based fault prediction system that transformed their maintenance operations. By analyzing patterns in vehicle sensor data, maintenance logs, and operational parameters, the system predicts component failures an average of 14 days before occurrence with 94.7% accuracy.
Key Outcomes
- Reduced unexpected breakdowns by 87%, from 312 to 41 annual incidents
- Decreased maintenance costs by 43% through optimized scheduling
- Improved vehicle uptime from 82% to 96.5%
- Generated $2.3 million in annual savings from reduced downtime, and repairs
- Enhanced driver safety with predictive alerts for critical systems
The Challenge
Reactive Maintenance Model
The fleet operated on a traditional time-based maintenance schedule combined with reactive repairs, resulting in both unnecessary maintenance and unexpected failures.
High Breakdown Rates
Average of 312 unexpected breakdowns annually, each costing $7,500 in repairs, towing, and lost revenue from vehicle downtime.
Data Silos
Vehicle telemetry, maintenance records, and operational data existed in separate systems with no unified analysis capability.
Safety Concerns
Critical component failures posed safety risks to drivers and increased liability exposure for the company.
Pre-Implementation Baseline Metrics
| Metric | Baseline Value | Industry Average | Gap | Annual Impact |
|---|---|---|---|---|
| Vehicle Uptime | 82% | 88% | -6% | $1.8M lost revenue |
| Unexpected Breakdowns | 312/year | 180/year | +73% | $2.34M costs |
| Maintenance Cost/Mile | $0.18 | $0.12 | +50% | $1.2M excess |
| First-Time Fix Rate | 67% | 75% | -8% | $450K rework |
| Parts Inventory Accuracy | 71% | 85% | -14% | $380K excess inventory |
The Solution: Deep Learning Fault Prediction System
The implemented solution leverages a multi-layered deep neural network architecture that processes diverse data streams to identify complex patterns indicating impending failures. The system combines historical maintenance data, real-time sensor readings, and operational context to generate highly accurate predictions.
Technical Architecture
| Component | Technology | Function | Data Processing | Update Frequency |
|---|---|---|---|---|
| Data Ingestion Layer | Apache Kafka | Real-time sensor data streaming | 500,000 events/minute | Continuous |
| Feature Engineering | PySpark | Extract 847 features from raw data | 50GB/day | Every 15 minutes |
| Deep Learning Model | TensorFlow/LSTM | Pattern recognition and prediction | 10M parameters | Real-time inference |
| Ensemble Layer | XGBoost + Random Forest | Improve prediction confidence | 3 model consensus | Every prediction |
| Alert Engine | Custom Rules Engine | Prioritize and distribute alerts | 1,000+ rules | Real-time |
Data Sources and Features
| Data Category | Sources | Key Features | Volume | Contribution to Accuracy |
|---|---|---|---|---|
| Vehicle Sensors | ECU, OBD-II, IoT sensors | Engine temp, RPM, pressure, vibration | 2GB/vehicle/day | 42% |
| Maintenance History | CMMS, service records | Past failures, repair patterns, parts usage | 5 years historical | 28% |
| Operational Data | GPS, dispatch systems | Routes, loads, driving patterns | 100MB/vehicle/day | 18% |
| Environmental | Weather API, road conditions | Temperature, precipitation, terrain | 50MB/day | 8% |
| Driver Behavior | Telematics | Acceleration, braking, idle time | 200MB/vehicle/day | 4% |
Model Performance Analysis
Prediction Accuracy by Component Type
| Component System | Accuracy | Precision | Recall | F1-Score | Lead Time (Days) | False Positive Rate |
|---|---|---|---|---|---|---|
| Engine System | 96.2% | 94.8% | 92.3% | 93.5% | 18 | 3.8% |
| Transmission | 93.8% | 91.2% | 89.7% | 90.4% | 21 | 6.2% |
| Brake System | 97.5% | 96.1% | 95.3% | 95.7% | 14 | 2.5% |
| Electrical System | 91.3% | 88.7% | 86.2% | 87.4% | 10 | 8.7% |
| Cooling System | 95.6% | 93.2% | 91.8% | 92.5% | 12 | 4.4% |
| Exhaust/Emissions | 94.1% | 92.3% | 90.1% | 91.2% | 16 | 5.9% |
| Overall System | 94.7% | 92.7% | 90.9% | 91.8% | 14 (avg) | 5.3% |
Performance vs. Traditional Methods
| Method | Accuracy | Precision | Recall | Implementation Complexity | Cost |
|---|---|---|---|---|---|
| Time-Based Maintenance | 62% | 58% | 71% | Low | High (overservice) |
| Statistical Models | 74% | 70% | 68% | Medium | Medium |
| Basic ML (Random Forest) | 81% | 78% | 75% | Medium | Medium |
| Single Deep Learning | 89% | 86% | 83% | High | Low |
| Our Ensemble Model | 94.7% | 92.7% | 90.9% | High | Lowest TCO |
Implementation Journey
Phase 1: Data Infrastructure (Months 1-3)
| Activity | Duration | Resources | Deliverables | Success Metrics |
|---|---|---|---|---|
| Data Lake Setup | 4 weeks | 3 engineers | Cloud infrastructure | 99.9% uptime |
| Sensor Installation | 6 weeks | 15 technicians | 850 vehicles equipped | 100% coverage |
| System Integration | 4 weeks | 5 developers | 5 systems connected | Real-time data flow |
| Data Quality Validation | 2 weeks | 2 analysts | Quality reports | >95% accuracy |
Phase 2: Model Development (Months 4-6)
| Activity | Duration | Resources | Deliverables | Success Metrics |
|---|---|---|---|---|
| Feature Engineering | 3 weeks | 4 data scientists | 847 features identified | Correlation >0.3 |
| Model Training | 4 weeks | 3 ML engineers | 5 model variants | >85% accuracy |
| Ensemble Optimization | 2 weeks | 2 ML engineers | Optimized ensemble | >90% accuracy |
| Validation Testing | 3 weeks | Full team | Test reports | <5% false positives |
Phase 3: Pilot Deployment (Months 7-9)
- Deployed on 100 vehicles across different routes and conditions
- Achieved 91% accuracy in real-world conditions
- Identified and resolved 23 edge cases
- Refined alert thresholds based on maintenance team feedback
- Documented $180,000 in prevented breakdowns during pilot
Phase 4: Full Rollout (Months 10-12)
- Scaled to entire 850-vehicle fleet in staged approach
- Trained 45 maintenance technicians on new workflows
- Integrated with existing maintenance scheduling system
- Established 24/7 monitoring center
- Implemented continuous learning pipeline for model updates
Results and Business Impact
Operational Improvements
| Metric | Before | After | Improvement | Annual Value |
|---|---|---|---|---|
| Vehicle Uptime | 82% | 96.5% | +17.7% | $1.2M revenue gain |
| Unexpected Breakdowns | 312/year | 41/year | -87% | $2.0M savings |
| Average Repair Cost | $7,500 | $3,200 | -57% | $450K savings |
| Maintenance Cost/Mile | $0.18 | $0.10 | -44% | $960K savings |
| Parts Inventory | $2.3M | $1.4M | -39% | $900K reduction |
| Technician Productivity | 5.2 repairs/day | 7.8 repairs/day | +50% | $380K value |
| Customer On-Time Delivery | 88% | 97% | +10.2% | $500K retained business |
Financial Analysis
| Category | Investment | Year 1 Savings | Year 2 Savings | Year 3 Savings | 3-Year ROI |
|---|---|---|---|---|---|
| Software Development | $450,000 | $2,300,000 | $2,500,000 | $2,700,000 | 412% |
| Hardware/Sensors | $680,000 | ||||
| Implementation | $320,000 | ||||
| Training | $85,000 | ||||
| Annual Operations | $150,000/year | ||||
| Total Investment | $1,985,000 | Total Savings: $7,500,000 | Net Gain: $5,515,000 | ||
Real-World Prediction Examples
Success Stories
Case 1: Engine Failure Prevention
Prediction: Turbocharger failure in 12 days
Symptoms Detected: Abnormal exhaust temperature patterns, slight oil pressure variations, unusual vibration frequency
Action Taken: Scheduled maintenance during planned route break
Result: Prevented $15,000 engine damage, zero downtime
Case 2: Transmission Alert
Prediction: Clutch degradation in 18 days
Symptoms Detected: Shifting time increase of 0.3 seconds, RPM fluctuations during gear changes
Action Taken: Proactive clutch replacement
Result: Avoided roadside breakdown, saved $8,500 in emergency repairs
Case 3: Brake System Warning
Prediction: Brake chamber failure in 7 days
Symptoms Detected: Uneven brake temperature distribution, increased air pressure consumption
Action Taken: Immediate inspection and replacement
Result: Prevented potential safety incident, maintained CSA scores
Case 4: Electrical System Anomaly
Prediction: Alternator failure in 10 days
Symptoms Detected: Voltage fluctuations under load, increased battery discharge rate
Action Taken: Replaced alternator during scheduled maintenance
Result: Prevented stranded vehicle, saved $6,000 in towing and emergency service
False Positive Management
| Component | Total Alerts | True Positives | False Positives | False Positive Rate | Cost Impact |
|---|---|---|---|---|---|
| Engine | 243 | 234 | 9 | 3.7% | $4,500 |
| Transmission | 156 | 146 | 10 | 6.4% | $3,000 |
| Brakes | 189 | 185 | 4 | 2.1% | $800 |
| Electrical | 134 | 122 | 12 | 9.0% | $2,400 |
| Total | 722 | 687 | 35 | 4.8% | $10,700 |
Note: Cost of false positives is minimal compared to $2.3M in prevented breakdown costs
Lessons Learned
1. Data Quality is Paramount
Initial model accuracy was limited to 76% due to inconsistent historical data. Implementing strict data governance and cleaning protocols improved accuracy by 18 percentage points.
2. Change Management Critical
Maintenance teams initially resisted AI-driven schedules. Success required extensive training, demonstrating early wins, and involving technicians in system refinement.
3. Ensemble Approach Superior
Single model approaches plateaued at 89% accuracy. Combining deep learning with gradient boosting and random forests achieved the breakthrough to 94.7%.
4. Context Matters
Environmental and operational context (routes, weather, load) improved predictions by 12%. Pure sensor data alone was insufficient for optimal accuracy.
5. Continuous Learning Essential
Model performance degraded 3% after 6 months without updates. Implementing automated retraining maintains peak performance.
6. ROI Communication
Translating technical metrics into business value (downtime hours, revenue impact) was crucial for securing ongoing investment and support.
Future Enhancements
Development Roadmap 2025-2027
| Enhancement | Timeline | Expected Impact | Investment | ROI Projection |
|---|---|---|---|---|
| Prescriptive Maintenance | Q2 2025 | Optimal repair strategies | $150,000 | $400,000/year |
| Parts Inventory AI | Q3 2025 | 30% inventory reduction | $100,000 | $300,000/year |
| Driver Behavior Integration | Q4 2025 | 5% accuracy improvement | $75,000 | $200,000/year |
| Supply Chain Integration | Q1 2026 | Automated parts ordering | $200,000 | $250,000/year |
| Multi-Fleet Platform | Q2 2026 | SaaS revenue stream | $500,000 | $2M/year revenue |
| Autonomous Vehicle Ready | Q4 2026 | Future-proof system | $300,000 | Strategic positioning |
Scalability Potential
- Current Capacity: Processing 850 vehicles with 15ms latency
- Scalable to: 10,000+ vehicles with current architecture
- Multi-tenant Ready: Can serve multiple fleet operators
- Cloud Native: Auto-scales based on demand
- API-First: Easy integration with third-party systems
Conclusion and Key Takeaways
The implementation of a deep learning-based fault prediction system has fundamentally transformed maintenance operations, delivering exceptional ROI while significantly improving safety and reliability. The 94.7% prediction accuracy, combined with an average 14-day advance warning, has virtually eliminated unexpected breakdowns and their associated costs.
Critical Success Factors
- Comprehensive Data Strategy: Integration of multiple data sources provided the foundation for accurate predictions
- Advanced ML Architecture: Ensemble approach combining deep learning with traditional ML outperformed single-model solutions
- Organizational Buy-in: Success required commitment from leadership, IT, and maintenance teams
- Iterative Improvement: Continuous model refinement based on real-world feedback
- Business Focus: Translating technical capabilities into measurable business value
Broader Industry Implications
This case study demonstrates that AI-driven predictive maintenance is no longer experimental but a proven technology delivering substantial returns. As the transportation industry faces pressure to reduce costs, improve safety, and minimize downtime, deep learning models offer a competitive advantage that will soon become a necessity.
Organizations that adopt these technologies early will benefit from reduced operational costs, improved customer satisfaction, and enhanced safety records. The 412% three-year ROI achieved in this implementation provides a compelling business case for fleet operators of all sizes to invest in predictive maintenance capabilities.
Transform Your Fleet Maintenance Operations
Learn how predictive maintenance can reduce your fleet's downtime by 87%
Schedule a Consultation