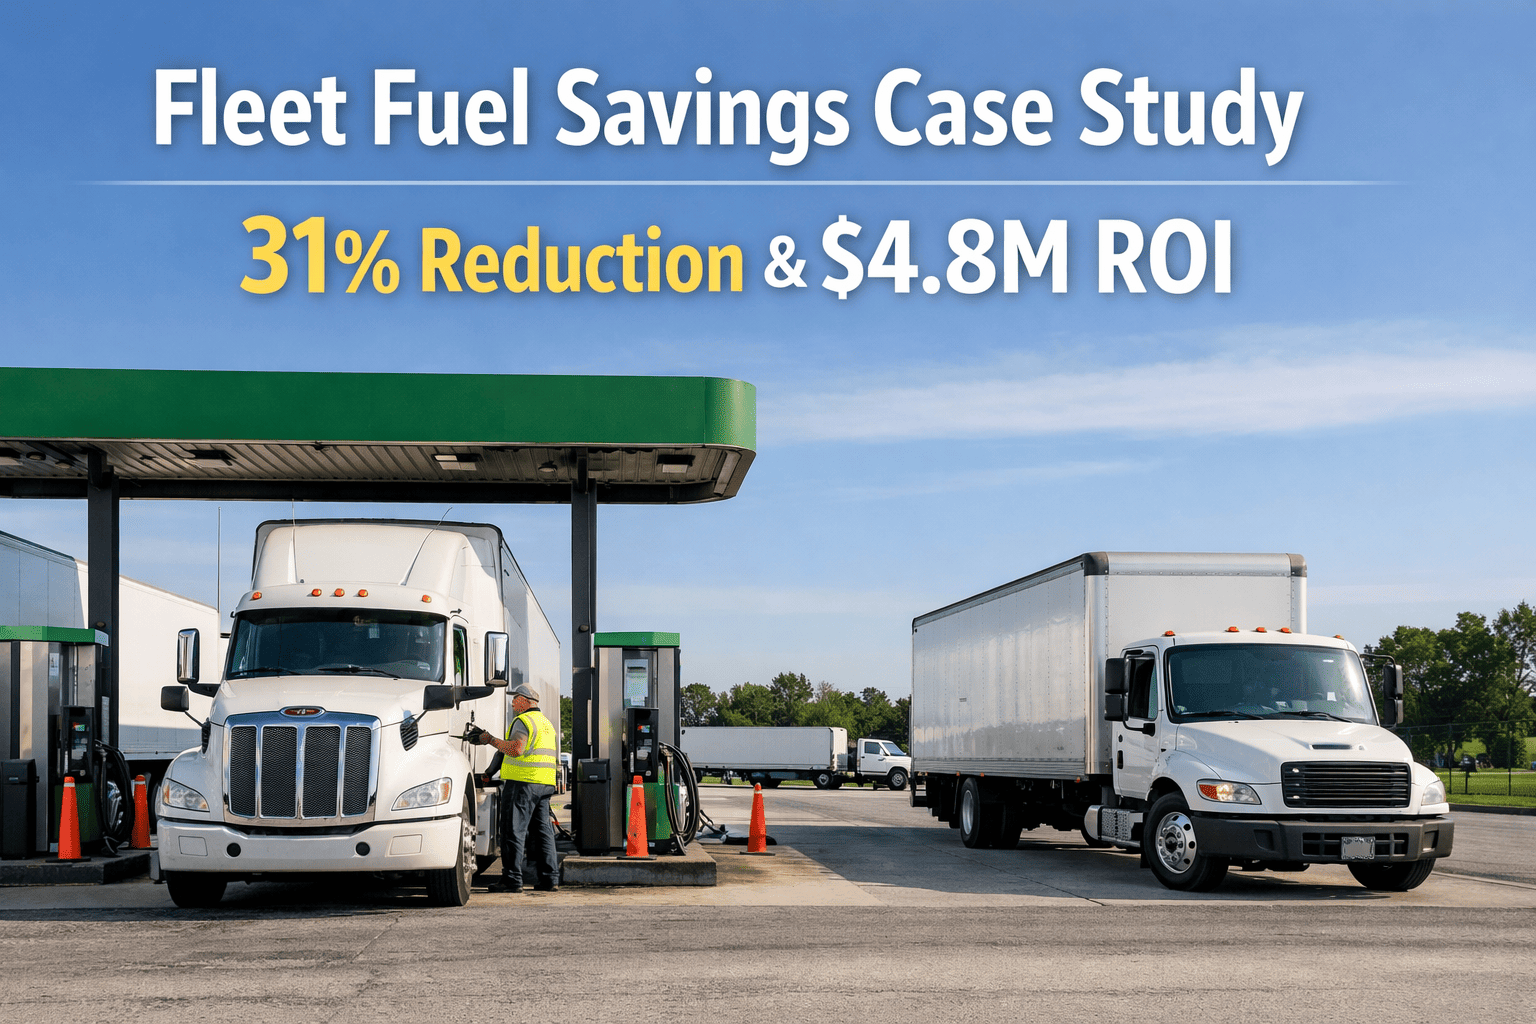
Fuel represents the single largest controllable expense in trucking operations — consuming 21-30% of total operating costs according to the 2025 ATRI Operational Costs report. Yet most fleets leave significant savings on the table through inefficient routing, excessive idling, and inconsistent driver behaviors. The gap between top-performing fleets (7.8 MPG) and the national average (6.9 MPG) represents hundreds of thousands of dollars in preventable fuel waste annually.
This case study documents how Heartland Regional Transport, a 600-truck Midwest carrier, achieved a verified 31% reduction in fuel costs — saving $4.8 million annually through systematic optimization of routes, idle time, and driver performance. The results align with findings from NACFE's 2024 Fleet Fuel Study, which showed 14 major fleets collectively saving $512 million through similar technology adoption.
For fleet managers still relying on manual processes and dispatcher intuition, this case study provides a replicable blueprint. The strategies here require no new trucks — just smarter use of existing assets. Book a demo to see your own savings potential.
How a 600-Truck Fleet Saved $4.8M Annually with 31% Fuel Cost Reduction
A Midwest regional carrier transformed fuel management using AI route optimization, idle reduction technology, and data-driven driver coaching. Real fleet, real data, verified results — and a roadmap any fleet can follow.
The Fleet Before Optimization
Heartland Regional Transport operates 600 Class 8 trucks across 12 Midwestern states, specializing in LTL and regional haul for retail and manufacturing clients. Before implementing systematic fuel management, their metrics lagged significantly behind industry leaders.
Leadership knew fuel costs were high but lacked visibility into root causes. Manual tracking methods, dispatcher-based routing, and no driver accountability systems meant the fleet was operating blind. A deep-dive assessment revealed massive inefficiencies hiding in plain sight — with 23% of total fuel spend entirely preventable.
The 4-Pillar Optimization Strategy
Rather than chasing a single "silver bullet" solution, Heartland implemented a systematic four-pillar approach targeting the biggest fuel waste categories. Each pillar delivered measurable ROI within 90 days. Combined, they produced the 31% total reduction.
Replaced dispatcher gut instinct with AI-powered routing that factors in real-time traffic patterns, elevation changes, fuel station pricing, and delivery windows. The system optimizes not just distance but total fuel consumption — accounting for variables human dispatchers cannot process at scale.
Deployed real-time idle alerts, APU utilization tracking, and driver accountability dashboards. At 0.8 gallons per hour of idle consumption at $3.50/gallon, every percentage point of idle reduction across 600 trucks saves approximately $18,100 annually. The math was undeniable — and the program paid for itself in 6 weeks.
Telematics data revealed that 150 drivers (bottom quartile) were responsible for 41% of excess fuel consumption. Targeted coaching on speed management, acceleration patterns, and anticipatory braking delivered fleet-wide MPG gains without replacing a single driver. Top performers were recognized and incentivized.
Integrated fuel card data with route planning to direct drivers to lowest-cost stations along their routes. Eliminated off-network purchases, identified $47K in suspected fuel card misuse, and negotiated better bulk rates based on accurate consumption data.
What's Your Fleet's Savings Potential?
Every fleet has fuel waste hiding in idle time, inefficient routes, and driver behaviors. We'll analyze your current metrics and show exactly where your opportunities are — free, in 15 minutes.
The Fuel Optimization Flow: How It Actually Works
Systematic fuel optimization isn't about heroic one-time efforts — it's about building a continuous improvement loop. Here's how the data flows through the system to produce sustained savings.
Before vs. After: The Complete Transformation
Here's how every key metric changed over the 12-month optimization period. These aren't projections — they're actual measured results from Heartland's fleet management system.
| Metric | Before (Jan 2025) | After (Dec 2025) | Change | Industry Benchmark |
|---|---|---|---|---|
| Fleet-Wide MPG | 6.2 MPG | 7.9 MPG | +27% | 7.8 MPG (NACFE leaders) |
| Idle Time Percentage | 34% | 9% | -74% | 10% (best practice) |
| Annual Fuel Spend | $15.4M | $10.6M | -31% | — |
| Cost Per Mile (Fuel) | $0.58 | $0.40 | -31% | $0.48 (ATRI 2024) |
| Empty Miles % | 18.4% | 13.1% | -29% | 16.7% (ATRI) |
| Driver MPG Variance | ±28% | ±11% | -61% | ±15% (top fleets) |
| Data Accuracy | 67% | 98% | +46% | 95%+ required |
Implementation Timeline: Key Milestones
Savings Potential by Fleet Size
Heartland's 31% reduction scales proportionally. Whether you operate 50 trucks or 1,000, the same optimization strategies produce similar percentage improvements. Here's what that means in dollars:
These results align with NACFE's 2024 Fleet Fuel Study findings. The 14 participating fleets, operating 75,000 trucks collectively, saved $512 million in 2023 compared to average trucks on the road. Fleets achieving 7.8+ MPG were $6,831 more profitable per truck annually than the national average, assuming 100,000 miles per year.
Quick Wins You Can Implement This Week
You don't need a 14-month implementation to start saving. These quick wins from the Heartland playbook can deliver immediate results with minimal investment:
Idling burns 0.8-1.0 gallons/hour. A simple policy with driver accountability saves 5-15% immediately. No technology required — just clear expectations and enforcement.
Transparency alone improves performance 3-5%. Drivers don't want to be at the bottom of the list. Make it visible, make it fair, and watch behaviors shift.
Every 5 MPH over 60 costs approximately 0.7 MPG. Dropping from 75 to 65 improves fuel economy by up to 27%. Governed speeds enforce compliance fleet-wide.
Under-inflated tires reduce fuel economy by up to 3%. A $20 gauge can save thousands annually. Make it part of pre-trip DVIR inspections.
Cross-reference fuel purchases with GPS location data. Discrepancies often reveal misuse, theft, or inefficient purchasing patterns. Most fleets find 2-5% leakage on first audit.
Frequently Asked Questions
Results vary based on starting point. Fleets with high idle time (>25%) and no route optimization typically see 20-35% reductions. Fleets already running lean might see 10-15%. The industry average gap between top performers (7.8 MPG) and average fleets (6.9 MPG) represents 13% savings potential from efficiency alone — before addressing idle time and routing.
Basic idle reduction and driver visibility can launch in 2-4 weeks. Full AI route optimization takes 2-3 months to deploy and tune. Most fleets see measurable ROI within 60-90 days of starting. Complete implementation with full driver coaching programs runs 6-9 months for enterprise fleets.
No. Heartland achieved 31% savings with their existing 600-truck fleet. The investment was in software, telematics integration, and training — not new iron. Most savings come from optimizing how existing assets are used, not replacing them. Average implementation cost runs $1,500-2,500 per truck including all hardware and software.
The key is making it data-driven, not subjective. Telematics identifies specific behaviors — speeding, harsh braking, excessive idle. Bottom-quartile drivers get targeted coaching on their specific improvement areas. Top performers are recognized and incentivized. Heartland saw 94% driver buy-in after 60 days because the feedback was fair and actionable.
Fuel optimization becomes more valuable as prices rise. At $3.50/gallon, 31% savings equals $4.8M for Heartland. At $5.00/gallon (where prices spiked in early 2026), the same efficiency gains would save $6.9M. The percentage stays constant; the dollar value scales with price — making optimization an even better hedge against volatility.
What Would 31% Fuel Savings Mean for Your Fleet?
Every fleet has fuel waste hiding in idle time, inefficient routes, and driver behaviors. We'll show you exactly where your opportunities are — with real numbers based on your fleet size and current metrics. No commitment, just clarity.