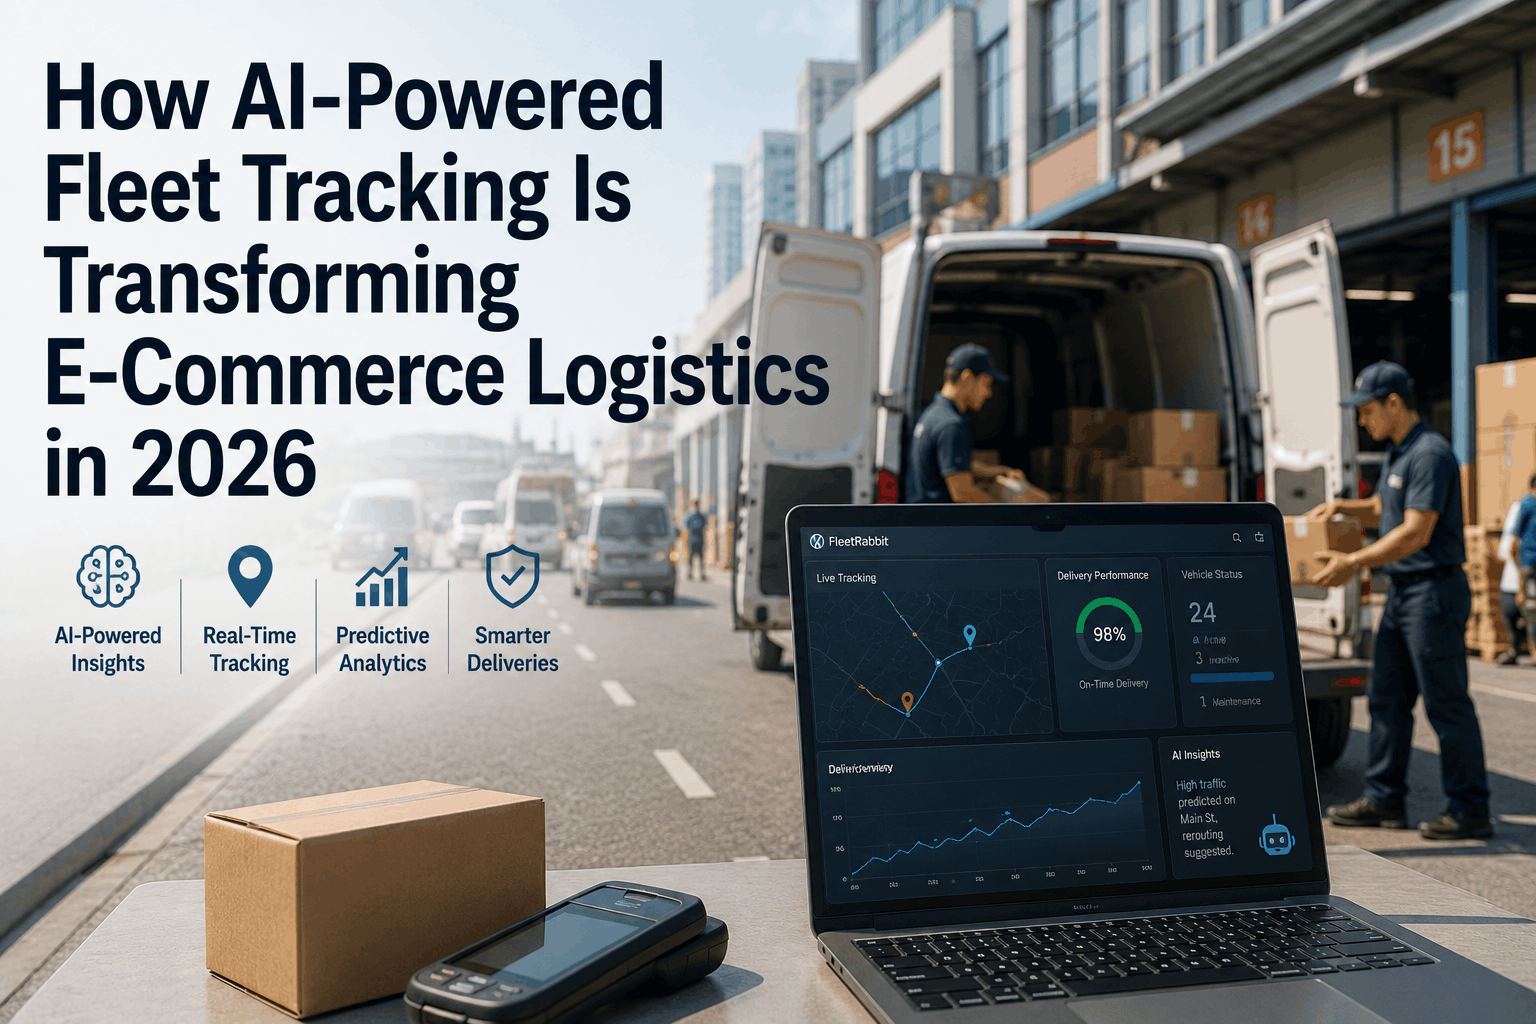
E-commerce logistics in 2026 is running on thinner margins, faster promised delivery windows, and higher customer expectations than any previous era — and the gap between operations that can meet those expectations and those that can't is increasingly determined by a single variable: how well the fleet is managed in real time. AI-powered fleet tracking has moved from competitive advantage to operational necessity for e-commerce logistics providers. When a customer selects same-day or next-day delivery, they're purchasing a promise that depends entirely on whether the fleet manager knows where every vehicle is, how long each driver has been on shift, whether a vehicle is developing a mechanical issue that will strand it mid-route, and whether the route algorithm accounts for the traffic pattern that emerged in the last 45 minutes. Manual dispatch, reactive maintenance, and end-of-day reporting can't support that promise at scale. AI fleet tracking — combining real-time GPS, predictive vehicle health monitoring, dynamic route optimization, and delivery performance analytics — is the operational infrastructure that makes the e-commerce delivery promise economically viable. Fleet Rabbit's AI fleet management platform delivers all of these capabilities through a single integrated system purpose-built for last-mile and middle-mile e-commerce logistics operations. Book a demo to see how Fleet Rabbit transforms e-commerce fleet operations.
Quick Answer
AI-powered fleet tracking transforms e-commerce logistics through four integrated capabilities: real-time GPS visibility that eliminates the dispatcher blind spots causing delivery delays; predictive vehicle maintenance that prevents the mid-route breakdowns that fail delivery SLAs; dynamic route optimization that responds to live traffic, weather, and delivery window constraints; and delivery performance analytics that identify the specific drivers, routes, and time windows where TAT failures concentrate. E-commerce logistics operations using AI fleet management reduce failed deliveries 28–35%, improve on-time delivery rates 18–24%, cut fuel costs 22–30%, and reduce vehicle downtime 35–40% — directly improving the unit economics that determine whether a delivery operation is profitable at current customer acquisition and retention costs.
Why E-Commerce Logistics Demands AI Fleet Management in 2026
The operational requirements of e-commerce logistics have outpaced the management tools that worked for traditional freight and parcel delivery. Four structural changes in the market have made AI fleet tracking not optional but essential for operations competing on delivery speed and reliability.
Delivery Windows Have Compressed to Hours
Same-day delivery expectations — standard on major platforms by 2026 — leave zero buffer for the route deviations, vehicle issues, and dispatch communication gaps that 2–3 day delivery windows absorbed invisibly. A dispatcher who learns about a vehicle breakdown via phone call 40 minutes after it occurred has already missed the window to reroute the affected deliveries before customer-promised times expire. AI tracking surfaces these events in real time, enabling response in minutes rather than discovery in hours.
Customer Retention Depends on Delivery Reliability
Research consistently shows that a single failed or significantly delayed delivery increases customer churn probability 3–4x on e-commerce platforms. At average e-commerce customer lifetime values of $800–$2,400, each delivery failure that churns a customer costs 80–240x the operational cost of the failed delivery itself. Fleet tracking that prevents delivery failures isn't just an operational improvement — it's a customer retention investment with LTV-scale returns.
Fuel and Vehicle Costs Are Compressing Margins
Last-mile delivery costs represent 53% of total supply chain cost in 2026 — and fuel, driver wages, and vehicle maintenance account for 78% of last-mile cost. AI fleet tracking attacks all three simultaneously: route optimization reduces fuel consumption 22–30%, predictive maintenance cuts vehicle repair costs 35–40%, and driver behavior monitoring reduces fuel-wasting driving patterns that inflate per-delivery cost. Margin improvement from fleet optimization is often the difference between profitable and unprofitable delivery economics at current parcel rates.
The 4 AI Capabilities Transforming E-Commerce Fleet Operations
AI fleet management for e-commerce isn't a single technology — it's four integrated capability layers, each addressing a different source of delivery failure, cost overrun, or TAT degradation. Fleet Rabbit delivers all four through one platform.
1
Real-Time GPS Visibility — Eliminate Dispatcher Blind Spots
Fleet Rabbit provides GPS location for every vehicle updated every 30 seconds — giving dispatchers live visibility into the exact position, speed, and stop status of the entire fleet simultaneously. Geofence alerts notify dispatchers when vehicles enter or exit customer delivery zones, warehouse facilities, or restricted areas. Live ETAs calculated from current position and remaining stop sequence replace the static route-time estimates that become inaccurate within 20 minutes of dispatch. Dispatchers using real-time visibility respond to emerging delays 4–6x faster than those relying on driver check-in calls — the speed difference that determines whether a reroute saves a delivery window or misses it.
3:42 PM: Vehicle #18 stationary 14 minutes at Stop 6 of 14 — flagged. Dispatcher contacts driver: tire pressure warning, pulling over. Dispatch reassigns remaining 8 stops to Vehicle #23 (4.2 miles away, 3 stops remaining). All 8 deliveries completed within original windows. Without real-time visibility: discovered at 4:30 PM via driver call, 6 deliveries failed.
2
Predictive Vehicle Health Monitoring — Prevent Mid-Route Breakdowns
Fleet Rabbit monitors engine health parameters, fault codes, battery voltage, and tire pressure in real time across the entire delivery fleet — identifying developing mechanical issues before they strand vehicles mid-route. AI pattern analysis detects the parameter trends that precede specific failure types 1–3 weeks in advance for delivery vehicles, enabling scheduled maintenance during off-hours rather than emergency breakdown response during peak delivery windows. A delivery van that breaks down during the 2–6 PM prime delivery window fails 8–14 customer deliveries, triggers rerouting costs, and may generate same-day redelivery expenses that exceed the vehicle's entire weekly operating cost.
Engine health: real-timeFault codes: immediate alertFailure prediction: 1–3 weeks outMaintenance: scheduled off-hours
3
Dynamic Route Optimization — Real-Time TAT Improvement
Static route plans built at morning dispatch become increasingly inaccurate as traffic patterns, delivery access conditions, and stop durations diverge from assumptions. Fleet Rabbit's route optimization engine recalculates optimal sequences in real time — accounting for current GPS positions, live traffic data, updated delivery window constraints, and stop completion times that feed forward to revise ETAs for all remaining stops. Dynamic rerouting reduces average delivery time per stop 12–18% versus static routing, directly improving TAT performance and enabling higher stop counts per vehicle per shift without SLA compromise.
Recalculation: continuousTraffic: live integrationTAT improvement: 12–18%Stop capacity: higher per shift
4
Delivery Performance Analytics — Find and Fix TAT Failure Patterns
Fleet Rabbit's analytics engine processes every delivery event — stop time, dwell time, departure time, on-time status, failed attempt reason — to identify the specific patterns driving TAT failures. Which routes consistently run late? Which drivers have above-average stop dwell times? Which time windows and postal codes generate the highest failed delivery rates? Which vehicles accumulate delays that cascade through the afternoon sequence? Pattern identification turns TAT improvement from guesswork into targeted intervention — fixing the 20% of variables that drive 80% of delivery failures.
Analytics finding example: Route 7 runs 23 minutes late on average — stop sequence analysis shows 3 consecutive apartment complex stops averaging 8.4 minutes dwell vs. 3.1 minute fleet average. Stop sequence reordering and driver coaching on apartment delivery procedure eliminates the cascade delay. On-time rate for Route 7: 71% → 91% in 3 weeks.
AI Fleet Management for E-Commerce
Real-Time Visibility, Predictive Maintenance, Dynamic Routing — One Platform
Fleet Rabbit delivers all four AI fleet management capabilities through a single integrated platform — GPS visibility, vehicle health monitoring, route optimization, and delivery analytics — giving e-commerce logistics operations the infrastructure to meet same-day delivery promises profitably.
35%
Fewer Failed Deliveries
How AI Tracking Improves TAT at Every Stage of the Delivery Chain
Turnaround time failures in e-commerce logistics don't originate at a single point — they accumulate across the dispatch-to-doorstep chain. AI fleet tracking intervenes at each stage where time is lost, compounding improvements that produce the 18–24% on-time delivery rate improvement that Fleet Rabbit customers measure.
Smarter Dispatch: Right Vehicle, Right Route, Right Sequence
Where time is lost: Manual dispatch assigns routes based on approximate vehicle locations and driver availability without optimizing for stop sequence, delivery window clustering, or vehicle load capacity — producing routes that work on paper but run late in practice.
AI intervention: Fleet Rabbit's dispatch optimization assigns orders to vehicles based on real-time location, current load, remaining shift hours, and delivery window density — clustering time-sensitive stops in the optimal sequence for each vehicle's starting position and capacity. Optimized dispatch reduces total route distance 15–20% versus manual assignment on equivalent order volumes.
TAT impact: 15–20% reduction in total daily route distance per vehicle translates directly to earlier completion times and capacity for additional stops without overtime.
En-Route Rerouting: Responding to Conditions Static Plans Can't Anticipate
Where time is lost: Traffic incidents, road closures, construction, and weather events invalidate static route plans within hours of dispatch — but without real-time visibility, drivers follow the original plan until delays become obvious and irreversible.
AI intervention: Fleet Rabbit monitors live traffic conditions against each vehicle's planned route and automatically generates rerouting suggestions when detected delays will cause delivery window failures. Dispatchers approve reroutes from the dashboard; drivers receive updated navigation instructions without interrupting delivery flow. Proactive rerouting preserves delivery windows that reactive response to traffic would miss.
TAT impact: Proactive rerouting prevents 60–70% of traffic-caused delivery window failures versus reactive driver-initiated route changes.
Stop Dwell Time Analysis: Finding Where Minutes Are Lost Per Delivery
Where time is lost: Average stop dwell time — from vehicle arrival to departure — varies 3–4x across drivers on identical delivery types. Drivers with 6–8 minute dwell times on apartment deliveries versus the 2–3 minute fleet average are adding 30–50 minutes of total route delay that cascades through every subsequent stop.
AI intervention: Fleet Rabbit records dwell time per stop, per driver, per delivery type — identifying systematic outliers that indicate training gaps, process issues, or access problems that coaching can address. Stop-level analytics show not just that Route 7 runs late, but exactly which stops and which driver behaviors are generating the delay.
TAT impact: Targeted dwell time coaching based on Fleet Rabbit analytics reduces average stop time 1.8–2.4 minutes per delivery — 18–24 minutes per 10-stop route, directly improving afternoon completion times.
Failed Delivery Reduction: Fewer Re-Attempts, Lower Per-Parcel Cost
Where time is lost: Failed delivery attempts — customer not home, access denied, address issue — cost $8–$17 per failed attempt in re-dispatch, redelivery fuel, and customer service handling. At 8–12% failed attempt rates on urban residential routes, failed deliveries consume 10–15% of total delivery cost on routes where they concentrate.
AI intervention: Fleet Rabbit's delivery analytics identifies the address types, time windows, and route segments with highest failed attempt rates — enabling time window optimization, customer pre-notification timing adjustment, and access instruction capture that reduces repeat failure at known problem addresses.
TAT impact: 28–35% reduction in failed delivery rate on AI-optimized routes versus historical baseline, directly reducing redelivery cost and improving effective stops-per-vehicle-per-shift metric.
Driver Performance Management: The Human Factor in Delivery TAT
Fleet tracking data reveals that driver behavior variation — not route design or traffic — accounts for 35–45% of TAT variance across equivalent routes. AI fleet management quantifies driver performance in the specific metrics that determine delivery efficiency, enabling targeted coaching rather than generic reminders.
1
On-Time Delivery Rate Per Driver
Fleet Rabbit tracks on-time delivery percentage per driver per route type — distinguishing performance on urban residential, suburban, commercial, and apartment routes separately. Drivers who are on-time on commercial routes but late on apartment deliveries have a specific skill or process gap, not a general performance problem. Targeted coaching based on route-type-specific data produces 2–3x faster improvement than general performance conversations unsupported by analytics.
2
Fuel Efficiency and Driving Behavior Scoring
Harsh braking, aggressive acceleration, and over-speed driving increase fuel consumption 15–25% above smooth-driving equivalents on identical routes — directly inflating per-delivery fuel cost. Fleet Rabbit scores each driver on these behaviors daily, enabling dispatchers to identify the highest fuel-cost drivers for coaching before fuel budget overruns accumulate. Behavior improvement through scorecard coaching typically reduces per-driver fuel cost 12–18% within 30 days of scorecard visibility.
3
Idle Time and Engine-On Efficiency
Delivery vehicles idle during double-parking waits, traffic, and between-stop breaks — burning fuel at $0.24–$0.38 per idle hour with zero delivery progress. Fleet Rabbit's idle monitoring identifies drivers with above-average idle percentage and enables dispatch to identify routes where idle is structurally high (requiring route redesign) versus routes where idle reflects driver behavior (requiring coaching). Idle reduction saves $1,800–$3,200 per vehicle annually across the delivery fleet.
4
Stop Sequence Compliance and Route Adherence
Drivers who deviate from optimized stop sequences — reordering stops based on personal preference rather than algorithm — produce routes that are 8–14% less efficient on average than the optimized plan. Fleet Rabbit's route adherence monitoring tracks deviation from planned sequence, quantifying the time impact of driver-initiated reordering. Operations that enforce sequence compliance through monitoring achieve 8–14% TAT improvement versus those where drivers self-select stop order without accountability.
Delivery Performance Intelligence
Find Exactly Where Your TAT Is Being Lost — and Fix It
Fleet Rabbit's delivery analytics identifies the specific routes, drivers, stop types, and time windows where on-time failures concentrate — turning TAT improvement from guesswork into targeted intervention that produces measurable results within 30 days of deployment.
24%
On-Time Rate Improvement
AI Fleet Tracking ROI for E-Commerce Logistics Operations
The financial case for AI fleet management in e-commerce logistics is built across five measurable savings and revenue protection categories. Each delivers independently measurable ROI; together they produce total annual savings that consistently exceed platform cost by 8–15x.
Fuel Cost Reduction: 22–30% Per Vehicle Annually
Sources: Route optimization reduces total daily kilometers driven 15–20%. Idle reduction from monitoring and coaching cuts unproductive fuel burn 30–40%. Driver behavior improvement reduces aggressive driving patterns that inflate fuel consumption 15–25% above efficient equivalents.
Calculation: Delivery van averaging 180 km/day at 12L/100km consumes 21.6L/day. 18% reduction from route optimization and behavior improvement: 3.9L/day saved at ₹92/L = ₹359/day per vehicle = ₹1,07,700/year per vehicle. 50-vehicle fleet: ₹53.8L annually in fuel savings alone.
Vehicle Maintenance Cost Reduction: 35–40% Per Vehicle
Sources: Predictive maintenance prevents the mid-route breakdowns that generate emergency repair premiums 3–5x above planned maintenance cost. Engine-hour-accurate service scheduling eliminates interval overruns that accelerate component wear. Driver behavior monitoring reduces harsh operation that increases maintenance frequency 40–60% on equivalently-used vehicles.
Calculation: Average delivery vehicle maintenance cost without AI monitoring: ₹1,80,000/year. 35% reduction: ₹63,000 savings per vehicle annually. 50-vehicle fleet: ₹31.5L in annual maintenance cost reduction.
Failed Delivery Cost Elimination: 28–35% Reduction
Sources: Time window optimization reduces not-home failures. Customer pre-notification timing improvement reduces access failures. Address-level failed delivery pattern identification enables proactive intervention at known problem addresses before the delivery is attempted.
Calculation: 50-vehicle fleet at 40 deliveries/vehicle/day = 2,000 daily deliveries. At 9% failed attempt rate: 180 failed deliveries/day at ₹650 re-attempt cost = ₹1,17,000/day. 30% reduction: ₹35,100/day saved = ₹1.05Cr annually in avoided re-delivery cost.
Vehicle Downtime Reduction: 35–40% Fewer Breakdown Events
Sources: Predictive health monitoring identifies developing failures before mid-route breakdowns. Maintenance scheduling during off-hours prevents operational-hours downtime. Early intervention prevents secondary damage that turns minor repairs into extended vehicle-off-road events.
Calculation: Each mid-route breakdown event costs ₹18,000–₹32,000 in recovery, rerouting, failed deliveries, and emergency repair premiums. At 3–4 breakdown events per vehicle annually on unmonitored fleets, 40% reduction saves ₹21,600–₹51,200 per vehicle per year. 50-vehicle fleet: ₹10.8L–₹25.6L annually.
Measured Outcomes: AI Fleet Tracking for E-Commerce Logistics
28–35%
Reduction in Failed Delivery Attempts
18–24%
On-Time Delivery Rate Improvement
22–30%
Fuel Cost Reduction Per Vehicle
35–40%
Vehicle Downtime Reduction
12–18%
TAT Improvement Per Route
45–60
Days to Full Platform ROI Recovery
Frequently Asked Questions: AI Fleet Tracking for E-Commerce Logistics
QHow quickly does AI route optimization show measurable TAT improvement?
Most e-commerce logistics operations see measurable on-time delivery rate improvement within the first 2 weeks of Fleet Rabbit deployment — route optimization effects are immediate from day one of active use. The first week typically shows 8–12% improvement as static routing is replaced by dynamic optimization; improvement compounds in weeks 2–4 as the AI learns specific route conditions, high-traffic windows, and stop dwell time patterns for the operation's specific geography and delivery type mix. Full TAT improvement of 12–18% is typically stable by week 6 as driver behavior coaching reinforces the route optimization gains. Delivery analytics identifying specific failure patterns add a further 4–8% on-time improvement over the following 60–90 days as targeted interventions address the root causes the data reveals.
QDoes Fleet Rabbit integrate with our existing warehouse management and order management systems?
Fleet Rabbit integrates with major WMS and OMS platforms through API connections and webhook delivery — enabling real-time order status updates from delivery events (attempt, completion, failure, signature capture) to flow back into warehouse and order management systems without manual reconciliation. Outbound integrations push optimized route assignments and ETAs to customer notification systems. For platforms not on Fleet Rabbit's standard integration list, a REST API provides the connectivity needed for custom integration with proprietary systems. Integration setup is included in the implementation process and typically activates within the first week of deployment for standard platform connections.
QHow does Fleet Rabbit handle fleets with a mix of owned vehicles and third-party delivery partners?
Fleet Rabbit supports mixed fleet models — tracking owned vehicles through installed telematics hardware and integrating third-party delivery partner location data through API connections where partner platforms support data sharing. For owned fleet vehicles, Fleet Rabbit provides the full GPS, health monitoring, and behavior analytics stack. For integrated third-party partners, the platform provides location visibility and delivery event tracking within the constraints of what the partner platform shares. Operations using both owned and partner delivery resources see the full owned-fleet ROI immediately, with incremental visibility improvement on partner capacity as integration depth expands.
QWhat customer-facing delivery experience improvements come from AI fleet tracking?
AI fleet tracking enables three customer-facing improvements that directly impact satisfaction and retention: accurate live delivery ETAs shared via customer notification systems (replacing static "by 8 PM" windows with "arriving in 23 minutes" precision), proactive exception notifications when a delivery will be delayed beyond its window (allowing customers to plan rather than wait), and higher first-attempt success rates from time window optimization that reduces the "missed delivery" experience that drives the highest satisfaction declines. Operations using Fleet Rabbit report 18–24% improvement in delivery satisfaction scores alongside the operational TAT improvement — the customer experience benefit that converts delivery reliability from an operational metric into a competitive differentiator in markets where multiple e-commerce platforms compete for the same customers.
Related Fleet Rabbit Resources
How AI-driven fault prediction, automated work orders, and continuous health monitoring reduces vehicle downtime and maintenance costs across all fleet types — the vehicle reliability foundation that keeps delivery operations running.
How real-time utilization tracking, idle reduction, and fleet right-sizing analytics reduce ownership cost and fuel waste — the operational efficiency foundation applicable across delivery and construction fleet operations.
The three technology layers behind real-time fleet visibility — GPS, J1939 IoT sensor data, and edge AI anomaly detection — and how they combine to prevent breakdowns, secure assets, and generate the operational intelligence that drives fleet performance.
How telematics hardware, IoT connectivity, and cloud analytics combine to deliver real-time fleet visibility, predictive maintenance, and performance analytics — applicable to delivery fleets and construction equipment operations using the same underlying technology platform.
Transform Your E-Commerce Delivery Operations with AI Fleet Tracking
Fleet Rabbit's AI-powered fleet management gives e-commerce logistics operations real-time vehicle visibility, predictive maintenance that prevents mid-route breakdowns, dynamic route optimization that improves TAT 12–18%, and delivery analytics that identify exactly where on-time failures concentrate. Most operations recover full platform investment within 45–60 days through fuel savings and failed delivery reduction alone.
Real-Time GPS Tracking
28–35% Fewer Failed Deliveries
12–18% TAT Improvement
Predictive Maintenance
Dynamic Route Optimization
May 25, 2026
By Lebron
All Posts