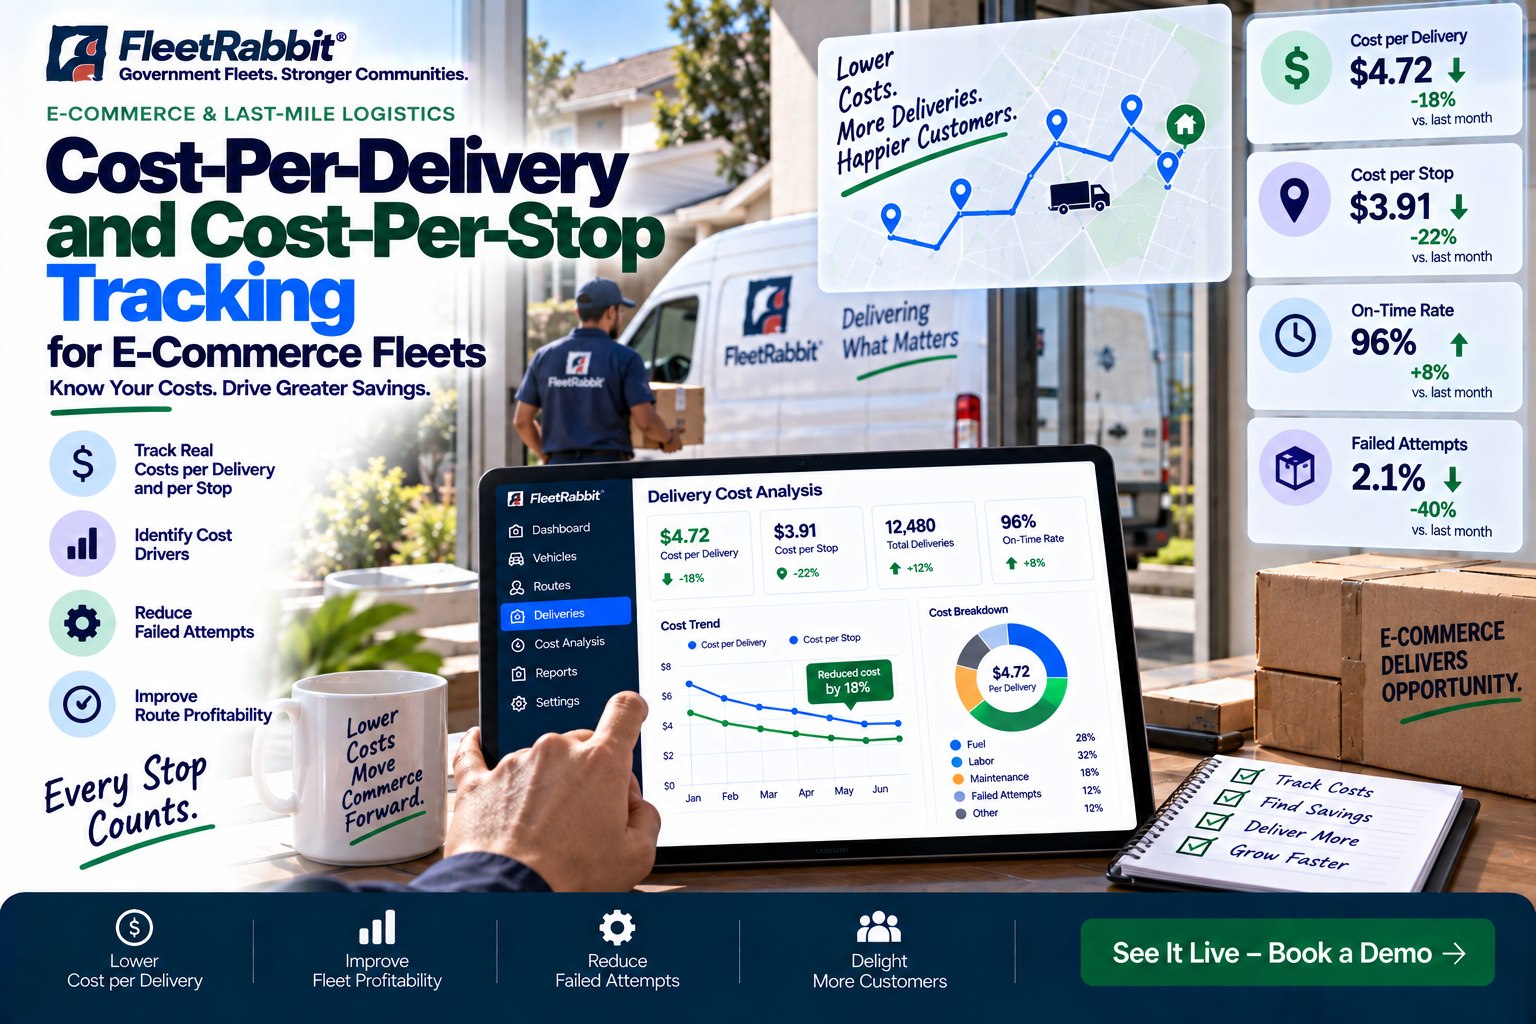
Last-mile parcel networks, contract delivery service partners (DSPs), and e-commerce 3PL carriers face relentless margin pressure: balancing driver hourly wages against fluctuating package drop counts, accounting for urban idle fuel burn, absorbing curbside maintenance wear, and paying client SLA penalties. When delivery fleets track their financial health using blended end-of-month averages, spreadsheet estimates, or basic odometer summaries, operators remain blind to chronic margin leaks. A route that looks profitable on paper often bleeds capital because a driver spends twelve minutes per stop navigating multi-story commercial lobbies, or an older step-van consumes double the brake friction budget on steep residential hills. FleetRabbit provides real-time cost-per-delivery (CPD) and cost-per-stop (CPS) tracking software built specifically for e-commerce parcel operations. By uniting real-time vehicle CAN-bus fuel telemetry, precise GPS stop-and-dwell profiling, automated driver overtime allocation, and component-level maintenance depreciation into a live unit-economics engine, FleetRabbit exposes unprofitable territories down to the individual delivery door. Pinpoint margin-eroding customer contracts, eliminate driver wage bloat, and track cost telemetry completely offline inside subterranean loading bays and concrete sorting concourses with zero cellular connectivity. Book a demo to see FleetRabbit cost-per-delivery tracking software in action.
Cost-Per-Delivery and Cost-Per-Stop Tracking for E-Commerce Fleets
Move beyond blended monthly fleet estimates. Calculate true cost per delivery in real time across fuel burn, driver dwell wages, tire and brake wear, and secondary drop attempts to protect carrier operating margins.
The Anatomy of Real-Time Unit Delivery Costing
FleetRabbit strips the guesswork out of fleet accounting by synthesizing four real-time data streams into an unalterable cost ledger for every delivery pin.
Driver Wage & Dwell Allocation
Calculates paid driver wages down to the second, isolating active driving intervals from stationary door-to-door delivery dwell and high-rise elevator waiting periods.
CAN-Bus Direct Fuel Telemetry
Pulls real-time fuel injector consumption rates directly from the engine ECM, tracking fuel consumed in congested traffic transit separately from auxiliary curbside idling.
Wear & Asset Depreciation
Allocates tire tread life, foundation brake friction burn, fluid life degradation, and routine PM schedules to individual packages based on gross axle payload weights.
Failed-Attempt Penalty Burden
Assigns warehouse re-sorting, dock staging, and redundant secondary attempt miles back to the generating stop, exposing parcels that consume double their delivery budget.
Why Blended Fleet Accounting Bleeds Last-Mile Profits
Relying on fleet-wide averages hides toxic customer contracts and inefficient territory zones that silently consume operating margins.
Unidentified High-Rise Dwell Pits
A driver delivering 30 packages to sprawling suburban doorsteps takes 45 minutes; another driver delivering 30 packages to an urban high-rise with service elevator queues takes two hours. Blended tracking averages these out, masking high-cost territory losses.
The Hidden Expense of Curbside Engine Idling
Leaving delivery step-vans idling while couriers scan packages and obtain signatures burns 0.6 to 1.1 gallons of fuel per hour. Without stop-level fuel logging, carriers absorb thousands in unbudgeted fuel overhead every billing cycle.
Subsidizing Chronic Unprofitable Shippers
E-commerce shippers with heavy, bulky freight or irregular delivery instructions often demand flat-rate carrier pricing. Without stop-level cost telemetry, carriers subsidize unprofitable contracts using revenue earned from easier drops.
Subterranean Garages & Urban Canyon Dead Zones
Deliveries inside multi-level underground parking concourses, concrete loading docks, and freight tunnels routinely lose cellular connections. Cloud-only tracking tools fail, dropping stop timestamps and distorting cost calculations.
Built to Expose and Compress Last-Mile Stop Costs
FleetRabbit connects engine telematics, driver mobile workflows, route clustering, and automated cost ledgers into one dashboard. Request an interactive walkthrough.
Dynamic Stop-Level Cost Ledger
Calculates the exact fully-burdened cost of every individual drop in real time, factoring in driver payroll, fuel burned in transit, curbside idle time, and vehicle depreciation.
Automated Dwell Time Profiling
Automatically detects when a vehicle enters and departs delivery perimeters, segregating actual driving transit from curbside delivery labor without manual driver input.
Engine Idle Burn Interceptor
Monitors stationary engine runtimes and fuel consumption rates, alerting dispatchers to chronic idling habits and helping operators trim fleet-wide fuel spend by up to 22%.
Basement Dock Offline Syncing
Couriers execute delivery manifests, scan package barcodes, and capture proof-of-delivery photos in underground garages with zero cell signal; telemetry auto-syncs on departure.
Shipper Contract Profitability Scorer
Ranks client parcel volume by true net profitability per cubic foot, giving logistics leadership concrete data to renegotiate rates or offload loss-making delivery contracts.
1-Click Unit-Economic Reporting
Export certified cost-per-delivery audit dossiers—broken down by vehicle class, route territory, driver shift, and delivery customer—ready for executive board review.
Cost Tracking Aligned with Federal Commercial Standards
FleetRabbit’s unit-cost tracking architecture operates in complete alignment with commercial motor carrier safety standards and labor mandates.
Integrates driver duty logs, mandatory 30-minute meal breaks, and maximum 14-hour on-duty windows directly into hourly wage allocation models to ensure labor law compliance.
Standardizes mobile pre-trip/post-trip eDVIR walkarounds, certified brake repair sign-offs, and 14-month vehicle maintenance archives to ensure safety alongside cost optimization.
Maintains verified electronic shift records, actual driving timestamps, and automated dwell logs to substantiate payroll records and defend against unverified wage disputes.
Calculates dynamic parcel payload weights against vehicle Gross Axle Weight Ratings (GAWR), preventing suspension overloading and roadside scale penalty fines.
Cost-Per-Delivery Software Benchmark Comparison
A feature-level comparison focused on unit-cost visibility, automated dwell tracking, and telematics integration as of 2026. Request a technical comparison.
| Capability | FleetRabbit | Generic Fleet CAD | Basic Telematics Portals | Spreadsheet Estimations |
|---|---|---|---|---|
| Pricing (per asset/month) | $5/month | $25–$60/month | $15–$35/month | High administrative overhead |
| Dynamic Stop-Level Cost Tracking | Real-time multi-variable ledger | Route-level summary only | Not supported | Blended end-of-month guess |
| Direct Fuel Telemetry Ingestion | Native CAN-bus ECM feed | Manual receipt entry | Raw sensor ping only | Total monthly fuel bills |
| Automated Dwell vs. Transit Split | Sub-second geofence timers | Manual driver tap required | Basic stop ping | None (unmonitored) |
| Concrete Concourse Offline Sync | Full store-and-forward | Network dependent | Data dropped | Paper only |
| Free Trial Access | 14 days, up to 3 assets | Sales demo only | Demo only | None |
| Contract Commitment | Monthly or annual | Multi-year lock-in | 3-year minimum | None |
5-Step Cost Tracking Implementation Pathway
FleetRabbit embeds cleanly into your parcel dispatch operations, vehicle fleets, and driver devices in under two weeks without freight disruption.
Fleet Roster & Telematics Stream Ingestion
Import delivery vans, step-vans, cargo sprinters, driver wage tables, and connect OBD-II/J1939 telematics streams via CSV or direct API integration.
Cost Parameter & Wage Baseline Setup
Configure regional fuel cost benchmarks, driver hourly overtime rates, chassis depreciation schedules, and baseline maintenance allocations per vehicle class.
Geofence & Dwell Perimeter Calibration
Establish automated spatial thresholds for high-density customer stops, apartment complexes, commercial loading docks, and sorting facilities.
Couriers Mobile Application Rollout
Equip last-mile delivery drivers with the offline-first mobile app on standard iOS or Android smartphones for digital manifests, barcode scanning, and proof-of-delivery.
Unit-Economics Command Go-Live
Activate live cost-per-stop telemetry dashboards, automated idle fuel burn alerts, and customer contract profitability reports across central logistics control desks.
2-Week Deployment Plan & Milestones
Modernize your fleet's unit-cost tracking and eliminate hidden operational margin leaks with zero disruption to scheduled distribution shifts. Request an onboarding plan.
Week 1: Data Integration & Cost Calibration
- Audit historical route payroll, monthly fuel invoices, and vehicle maintenance receipts
- Connect vehicle OBD-II/J1939 telematics dongles to verify real-time fuel and idle feeds
- Configure driver wage rates, vehicle depreciation formulas, and territory boundaries
- Assign user access roles for Finance Directors, Dispatchers, and Fleet Managers
Week 2: Yard Rollout & Live Verification
- Distribute mobile app to drivers and conduct 15-minute training on digital deliveries
- Validate store-and-forward offline syncing inside concrete sorting facilities and docks
- Simulate high-dwell commercial stops to verify automated labor wage allocations
- Launch live cost-per-delivery dashboard and automated shipper margin reports
Take Control of Your Fleet's Cost Per Delivery in Less Than 2 Weeks
Expose hidden dwell leaks, eliminate unbudgeted idle fuel burn, and protect parcel delivery margins at $5/asset/month with a 14-day free trial.
Real-World Parcel Carrier Results
Documented unit-cost reductions reported by commercial parcel carriers and e-commerce logistics fleets. Request the logistics fleet case study.
$1.58 Cost-Per-Delivery Reduction Across 75 Vans
A regional last-mile parcel carrier operating 75 delivery vans suffered from declining operating margins driven by unmonitored commercial lobby dwell times and excess vehicle idling. FleetRabbit deployed dynamic stop-level cost tracking, helping dispatchers identify high-dwell territories and trim average cost per delivery from $6.40 down to $4.82, saving $192,000 in year one.
19% Fuel Consumption Reduction via Idle Tracking
An urban parcel delivery service with 40 cargo vans faced escalating fuel bills on downtown delivery loops. FleetRabbit’s real-time engine idle burn interceptor alerted dispatch to chronic curbside idling patterns, reducing fleet fuel consumption by 19% and saving $38,000 in annual fuel spend.
In parcel logistics, if you only look at your profit and loss statement at the end of the month, you're driving with your eyes closed. We had delivery routes that looked great on paper because they hauled high parcel volumes, but when we turned on FleetRabbit, we realized those routes were actually losing money every single day because our drivers were spending ten minutes per stop waiting for high-rise freight elevators. FleetRabbit showed us our exact cost per delivery down to the penny for every single address pin. It let us renegotiate rates with our highest-dwell e-commerce customers, coached our drivers on curbside idle habits, and drove our average cost per drop down by over a dollar and fifty cents. It is the single most valuable operational financial tool our dispatch team has ever used.
Frequently Asked Questions
Start Tracking Your Fleet's True Cost Per Delivery in Less Than 2 Weeks
Expose hidden dwell leaks, eliminate unbudgeted idle fuel waste, and protect parcel operating margins at $5/asset/month with a 14-day free trial.







