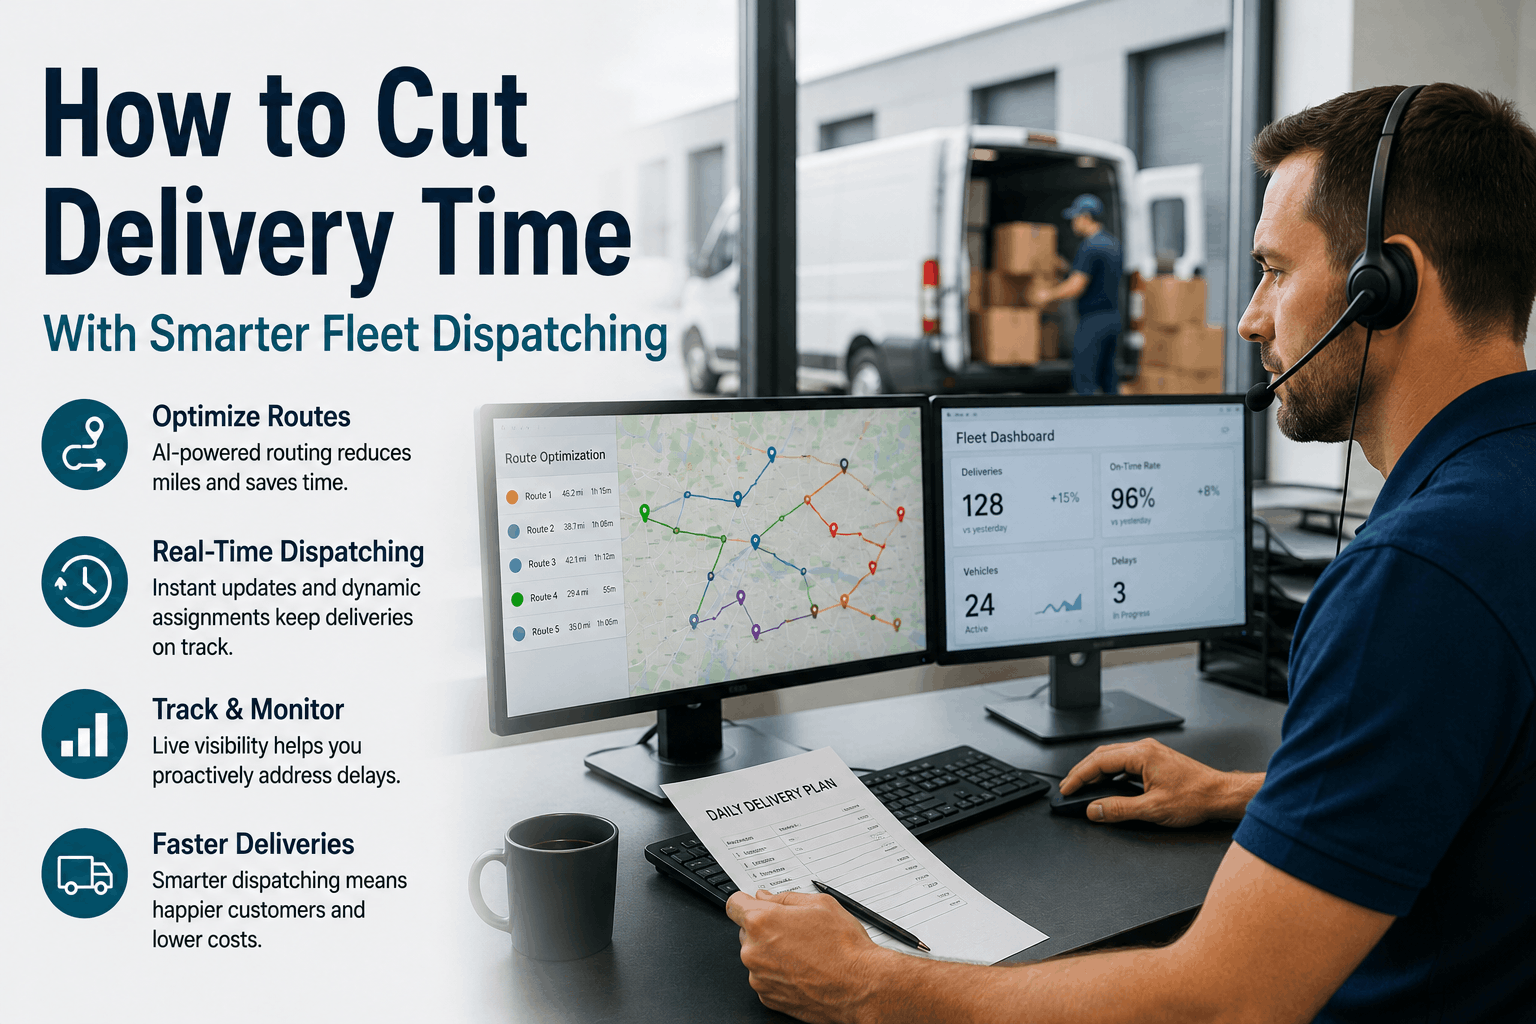
How to Cut Delivery Time With Smarter Fleet Dispatching
Smart dispatching is the operational edge separating Western US delivery fleets that consistently hit time windows from those burning margin on failed attempts and driver overtime. A Los Angeles carrier rerouting 40 stops in real time after a freeway closure, a Phoenix fleet balancing loads across 12 drivers before a peak-hour cutoff, a Seattle operator trimming 22 minutes per route through tighter time-window management — the gains compound fast. Fleet Rabbit's AI dispatching platform layers dynamic routing, load balancing, and time-window intelligence across California, Nevada, Arizona, Oregon, Washington, and Colorado fleets. Book a demo to see Fleet Rabbit's dispatching intelligence applied to your delivery fleet.
Quick Answer
Western US delivery fleets cut 18–34% off average delivery cycle time by combining dynamic dispatching, real-time load balancing, and time-window management. Fleet Rabbit's AI platform continuously reoptimizes route sequences, redistributes stop loads across drivers, and flags time-window conflicts before they become failed attempts — reducing cost-per-delivery and improving on-time performance across California, Nevada, Arizona, Oregon, and Washington fleets.
Why Delivery Cycles Run Long in Western US Fleets
A 30-vehicle delivery fleet across greater Los Angeles or the Phoenix metro generates 600–1,200 daily stop assignments. Static morning dispatch — routes built at 5 AM and untouched through the shift — leaves those fleets absorbing every traffic disruption, cancellation, and late pickup as pure delay. One 40-minute freeway incident on I-10 cascades into 4–6 failed time-window attempts, each triggering a re-delivery at $18–$34 in incremental cost.
Static Routing Waste
23%
avg excess drive time vs dynamic routing
Load Imbalance Cost
$1.9K
monthly overtime per unbalanced driver
Failed Time Windows
$28
avg re-delivery cost per failed attempt
Dispatch Reaction Lag
47 min
avg manual re-dispatch response time
The Three Dispatching Levers That Cut Delivery Time
Dynamic Dispatching
Routes reoptimize continuously against live traffic, new orders, and driver position — not once at 5 AM. Fleet Rabbit re-sequences stops every 4–8 minutes across California and Nevada metro corridors, absorbing disruptions before they compound.
Load Balancing
AI distributes stop assignments by drive time, stop count, and delivery weight. Arizona and Oregon fleets running unbalanced loads see one driver finish 90 minutes ahead while another runs overtime — Fleet Rabbit closes that gap at morning dispatch and adjusts through the shift.
Time-Window Management
Fleet Rabbit ingests customer delivery windows and appointment slots — flagging conflicts before dispatch, not after a failed attempt. Washington and Colorado fleets recover 40–60% of previously missed slots through pre-shift conflict resolution.
On-Time Delivery Rate — Static vs Dynamic Dispatching, Western US Fleets
Fleet Rabbit Dynamic
92%
Manual Re-Dispatch
71%
Static Morning Route
58%
No Dispatching Tool
41%
Fleet Rabbit platform data, Western US delivery fleets 2024–2025.
1
Continuous Route Reoptimization
Fleet Rabbit pulls live traffic data, driver GPS positions, and real-time stop completion status — rebuilding optimal sequences every few minutes. An I-405 slowdown in Los Angeles triggers automatic re-sequencing for affected drivers before the delay hits ETA commitments.
Southern California 3PL, 28 drivers: Fleet Rabbit rerouted 14 drivers around a Riverside County incident in 4 minutes — preserving 89% of afternoon time-window commitments that a static route would have missed.
2
Same-Day Order Insertion
New orders insert into the optimized route at the lowest-cost position automatically. Fleet Rabbit's insertion algorithm evaluates every active driver's current position and remaining stops, placing the delivery where it adds the fewest minutes — no dispatcher intervention required.
When a stop cancels mid-route, Fleet Rabbit pulls the nearest unassigned delivery into the sequence — keeping driver utilization high. Nevada and Arizona fleets with 8–15% daily cancellation rates recover most of that capacity through automated reassignment.
Phoenix metro distributor, 19 drivers: Automated cancellation backfill raised daily stop completion from 87% to 96% — adding 1.7 driver-shifts of productive output per day.
Smart Dispatching Platform
Cut Delivery Cycle Time Across Your Western US Fleet — Free Trial, No Fleet Replacement Required
Dynamic routing. Load balancing. Time-window intelligence. Fleet Rabbit installs on any fleet in days.
Tactics #2–5: Load Balancing, Time Windows, Utilization & ETA Alerts
02
Load Balancing
Tactic #2: AI Load Balancing — End Driver Overload and Underutilization
The imbalance tax: A 20-driver Phoenix fleet dispatched by zone sends 4 drivers into overtime while 3 finish before 2 PM — $2,800–$4,200 in monthly overtime, invisble on traditional reports.
Fleet Rabbit balances by: Drive time, stop count, delivery weight, and service time by stop type — routes where all drivers finish within a 25-minute window of each other.
Result: California and Nevada fleets see overtime drop 35–55% within 60 days.
03
Time Windows
Tactic #3: Time-Window Management — Stop Failing Appointments Before They Start
The failed-attempt math: A Seattle fleet with 200 daily residential deliveries fails 14–22 stops per day on static routing. At $28 per re-delivery, that's $3,900–$6,100 in monthly rework cost.
Fleet Rabbit resolves: Pre-dispatch conflict analysis flags every window-sequence incompatibility before drivers leave the depot. Tight windows sequence first.
Result: Oregon and Washington fleets reduce failed time-window attempts 60–75% within 30 days.
04
Driver Utilization
Tactic #4: Utilization Scoring — Find Capacity Without Adding Headcount
The hidden capacity problem: Most Western US fleets operate at 72–81% theoretical driver capacity due to unbalanced loads and inefficient sequencing — 2–4 unused driver-shifts per 20-vehicle fleet.
Fleet Rabbit measures: Stop-per-hour rate, drive-time ratio, depot dwell, and idle time — surfacing utilization scores that find where capacity is lost before adding routes or headcount.
Result: Colorado and Arizona fleets defer fleet expansion 6–14 months, saving $180K–$340K in capital cost.
05
Customer ETA
Tactic #5: Live ETA Communication — Reduce Inbound Calls and Failed Attempts
The contact center load: A 25-driver California fleet with no live ETA generates 80–140 inbound calls daily — 2–3 dispatcher hours consumed and failed attempts rising when customers are absent.
Fleet Rabbit sends: Automated SMS ETA updates at 60-minute and 15-minute pre-arrival intervals with a live tracking link — reducing receiver-absent failures 45–65%.
Result: Dispatchers reclaim 2+ daily hours for proactive exception management.
Before vs. After Fleet Rabbit — 25-Driver Western US Fleet
Without Smart Dispatching
Route reoptimization: Once, at 5 AM
Load balance variance: 60–90 min driver spread
Failed time windows: 12–18 per day
Same-day order handling: Manual, 30–50 min lag
Driver utilization: 72–78%
Monthly re-delivery cost: $4,200–$7,800
With Fleet Rabbit Dispatching
Route reoptimization: Every 4–8 minutes, live
Load balance variance: Under 20 min driver spread
Failed time windows: 3–5 per day
Same-day order handling: Automated, under 90 seconds
Driver utilization: 91–95%
Monthly re-delivery cost: Under $900
34%
Delivery Cycle Reduction
92%
On-Time Delivery Rate
$5.8K
Monthly Re-Delivery Savings
75%
Fewer Failed Time Windows
55%
Overtime Cost Reduction
30 days
To Measurable ROI
Frequently Asked Questions: Smart Dispatching for Western US Fleets
QHow does Fleet Rabbit handle multi-depot dispatching across California or Nevada?
Fleet Rabbit supports multi-depot configurations natively — assigning stops to the optimal depot origin based on driver availability, load, and geographic proximity. A California fleet running depots in Fresno, Sacramento, and Los Angeles manages all three from a single dispatch dashboard with consolidated load balancing across all locations.
QCan Fleet Rabbit integrate with our existing TMS or order management system?
Yes. Fleet Rabbit connects to major TMS platforms via REST API and pre-built integrations. Stop data, time windows, and customer information flow in automatically — no manual import required. Most Western US fleets complete integration within 3–5 business days.
QWhat happens to route optimization when a driver calls out last-minute?
Fleet Rabbit detects the capacity reduction and redistributes that driver's stop load across remaining active drivers immediately — prioritizing time-sensitive windows and minimizing total added drive time. The rebalance completes in under 90 seconds with updated routes pushed to all affected drivers' mobile apps automatically.
QHow quickly do Western US fleets see delivery cycle improvements?
Most fleets see measurable cycle time improvement within the first full dispatch week. On-time delivery rates typically improve 15–20 percentage points in the first 30 days. Full realization of load balancing and time-window management gains comes in weeks 3–6 as the AI builds historical baseline data for each route corridor.
How GPS hardware, IoT sensors, and cloud analytics deliver real-time fleet visibility and dispatch intelligence across Western US operations.
Cut Delivery Cycle Time Across Your Western US Fleet — See Fleet Rabbit in Action
Fleet Rabbit's AI dispatching platform delivers dynamic routing, load balancing, time-window management, and driver utilization intelligence across California, Nevada, Arizona, Oregon, and Washington delivery operations. Any fleet size. Any vehicle mix. Measurable results in 30 days.