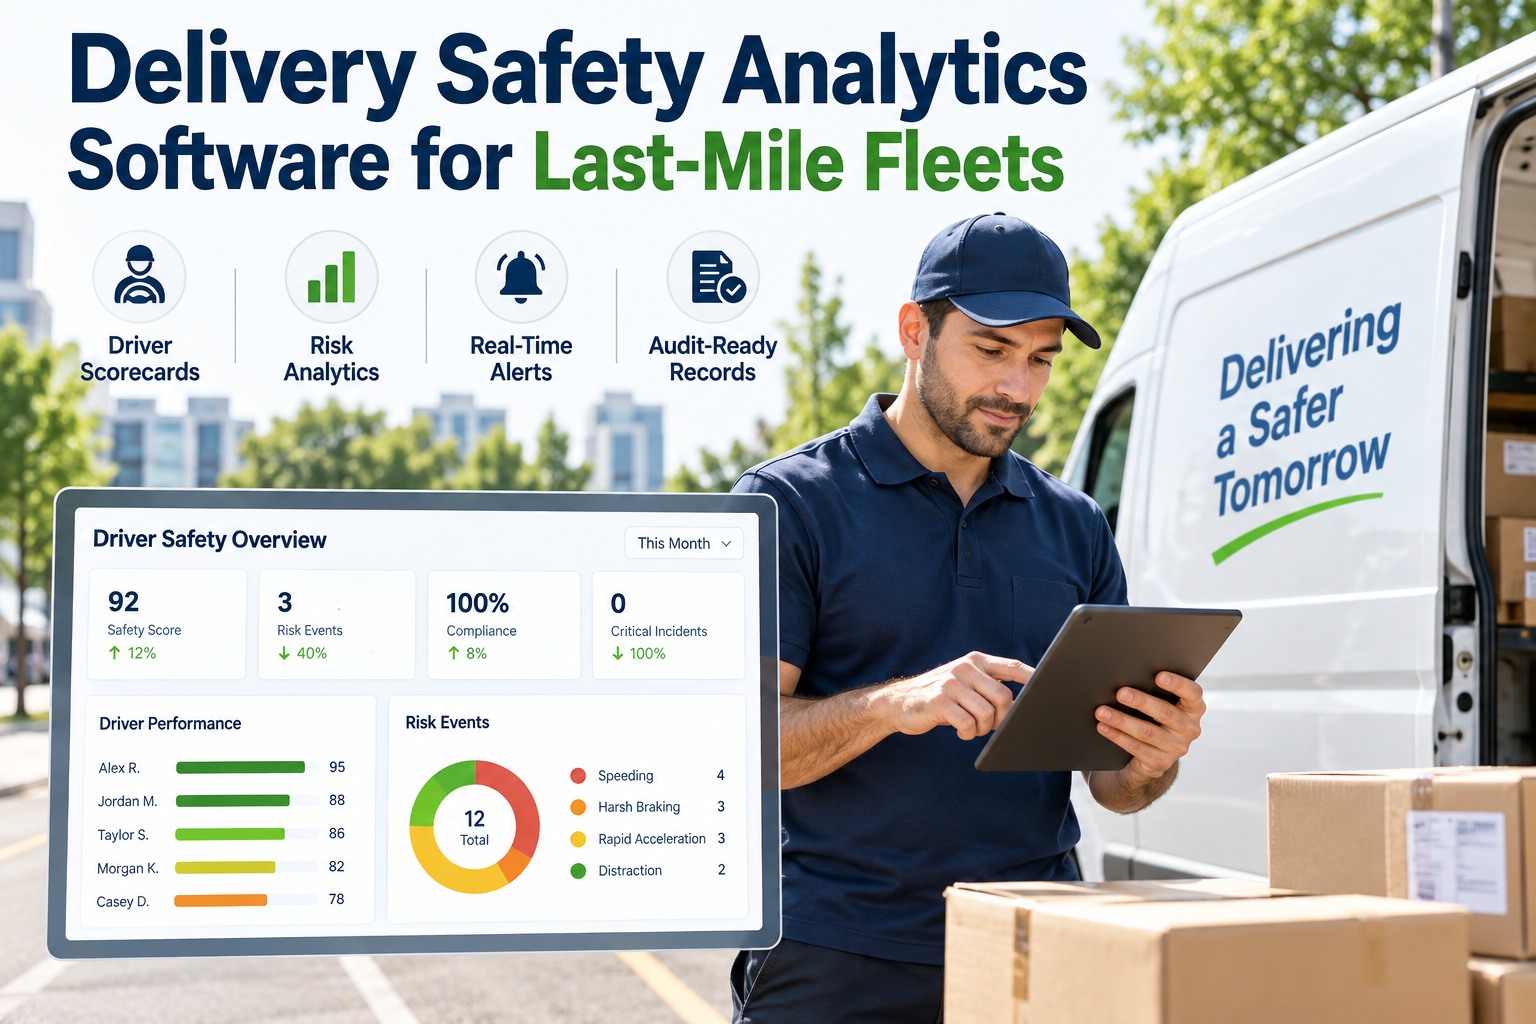
Modern e-commerce carriers, direct-to-consumer parcel couriers, and regional last-mile delivery fleets operate in high-density, unpredictable street environments where driver risk directly dictates commercial profitability. In high-stop residential and urban corridors, delivery operators face sudden pedestrian hazards, tight alley maneuvers, distracted driving temptations, and mounting delivery-window pressures. When logistics leaders rely on reactive safety reviews, uncalibrated telematics pings, or post-accident insurance claims, delivery businesses absorb staggering liability losses, severe vehicle downtime, and escalating insurance premiums. Implementing delivery safety analytics software unifies telematics data, multi-axis accelerometer detection, automated driver safety scorecards, and predictive risk coaching into a single connected operations engine. By turning raw vehicle motion into clear, defensible safety intelligence, fleet directors eliminate unsafe driving patterns before collisions occur. To explore how real-time safety analytics safeguards your drivers and lowers fleet risk profiles, book a technical demonstration with our delivery safety engineering team or launch your dispatch analytics immediately through our free platform sign up.
Delivery Safety Analytics Software for Last-Mile Fleets
An enterprise safety intelligence guide for final-mile logistics executives. Transform multi-axis accelerometer telemetry into objective driver risk scorecards, automated in-cab coaching, and audit-ready commercial fleet defensibility.
Compatible with your existing telematics and mobile devices. Zero hardware lock-in.
The Architectural Pillars of Delivery Safety Analytics
Traditional vehicle tracking merely monitors basic GPS coordinates and highway travel speeds, entirely missing the dynamic micro-behaviors that cause accidents in high-density urban corridors. Last-mile couriers execute 120 to 180 multi-stop residential deliveries per shift, maneuvering through tight cul-de-sacs, backing into active driveways, and navigating crowded pedestrian zones. A delivery van traveling at 25 MPH in an active 15 MPH school zone poses a catastrophic risk, yet generic trackers register it as a normal speed. Advanced delivery safety analytics software continuously ingests 3-axis accelerometer forces, vehicle CAN-bus powertrain metrics, gyroscope orientation, and contextual street-level GIS databases. This multi-stream telemetry allows safety directors to accurately distinguish between necessary evasive maneuvers and chronic reckless habits. You can review your fleet's active risk scores by creating a free account.
Longitudinal G-Force Acceleration & Braking
Measures linear braking deceleration (typically exceeding -0.45G) and aggressive throttle acceleration (above 0.35G), isolating tailgating habits and sudden panic stops from routine traffic slowdowns.
Lateral Centrifugal Force & Aggressive Cornering
Calculates dynamic lateral G-forces during sharp turns and fast roundabout navigation, detecting excessive vehicle lean that causes rear parcel shelf collapses or roll-over hazards on wet asphalt.
Contextual Speed Variance & Zone Mapping
Correlates instantaneous vehicle speed against hyper-local speed limits, actively monitoring violations across school crosswalks, industrial park alleys, and residential neighborhood corridors.
Idling Dynamics & Auxiliary Dwell Safety
Tracks curbside engine run-time while the vehicle is parked, differentiating between auxiliary delivery equipment operation and unnecessary curbside idling that wastes fuel and increases vehicle theft risk.
Subjective Supervisor Reviews vs. FleetRabbit Empirical Analytics
Managing driver safety through random ride-alongs, subjective supervisor impressions, or angry citizen phone calls creates team friction, damages driver retention, and leaves catastrophic fleet liabilities unaddressed. Discover how subjective reviews compare directly against FleetRabbit's automated, objective safety analytics engine. You can book a short demo to inspect our automated driver scorecards.
| Safety Management Dimension | Subjective Reviews & Generic Trackers | FleetRabbit Delivery Safety Engine | Carrier & Safety Advantage |
|---|---|---|---|
| Behavior Detection Fidelity | Speed alerts only; blind to harsh turns and braking | 3-axis accelerometer + CAN-bus powertrain telemetry | 100% detection of aggressive urban maneuvers |
| Driver Feedback Latency | Monthly or quarterly reviews; driver forgets incident | Instant in-cab audio tone + post-shift mobile score | Enables real-time behavioral self-correction |
| Contextual Route Normalization | Equal penalties; ignores traffic and stop density | Normalizes scores based on congestion and stops | Fair, objective metrics that drivers trust |
| Insurance Underwriter Defensibility | Unverified paper logs; carriers pay standard premiums | Cryptographically verified digital safety ledgers | Lowers fleet insurance premiums by up to 28% |
| Hardware & Implementation Cost | Expensive dual-facing cameras ($800+ per vehicle) | Hardware-agnostic; runs on OBD-II or driver phones | Zero proprietary hardware lock-in or capital expense |
Establish an Objective, High-Performance Fleet Safety Culture
Eliminate harsh driving habits, safeguard commercial insurance ratings, and empower couriers with automated micro-coaching starting from $3/vehicle/month with no hardware lock-in.
4-Stage Closed-Loop Safety Coaching & Gamification Flow
FleetRabbit operationalizes fleet safety into an automated, transparent sequence that encourages driver self-correction, provides targeted manager coaching, and rewards safe driving across every shift. Book a live walkthrough to watch an event trigger automated coaching.
Continuous Sensor Ingestion
Telematics modems and mobile devices monitor multi-axis G-forces, speed, and engine RPM at 100Hz frequency, filtering out road potholes and minor pavement vibrations to eliminate false positives.
Instant In-Cab Audio Intervention
When a driver exceeds safe thresholds (such as taking a corner too fast or tailgating), the system plays a subtle, real-time audio alert, prompting the driver to ease off the pedals immediately.
Post-Shift Mobile Scorecard
Upon completing their delivery route, the driver views their personal shift safety score on the mobile app. The dashboard details exact locations where events occurred alongside constructive driving tips.
Targeted Coaching & Rewards
Safety supervisors review aggregated fleet rankings. The platform assigns automated 2-minute video micro-lessons to drivers needing support while creating bonus incentives for top-scoring couriers.
Total Cost of Risk: Where Unmonitored Fleets Bleed Capital
Operating a delivery fleet without behavioral monitoring software creates compounding financial losses across collision insurance claims, rapid mechanical component degradation, and excessive fuel consumption. Identifying these systemic cost drivers helps logistics directors and safety superintendents build an airtight business case for driver safety analytics software. You can quantify your fleet's exact risk recovery with our free platform onboarding.
Top Causes of Fleet Budget Waste from Risky Driving
Safety Engineering Platform Strengths
Normalizes driver performance based on route density, urban congestion, and miles driven to produce fair, transparent scores.
Provides gentle, non-distracting audio cues the instant a harsh maneuver occurs, encouraging driver self-correction on the road.
Enables healthy driver leaderboards, safety badge incentives, and automated micro-training modules directly on mobile devices.
ROI & Scalability Framework for Safety-Conscious Fleets
When investing in delivery driver safety software, fleet leadership must measure financial returns across risk reduction, vehicle maintenance, fuel savings, and driver retention. FleetRabbit delivers quantifiable financial return across all primary final-mile operating metrics. To review your customized fleet safety savings forecast, schedule a one-on-one consultation demo with our team.
Collision Liability Savings
Cutting aggressive driving events by over 50% directly reduces at-fault collisions, property damage payouts, and legal liability expenses, protecting carrier operating cash flow.
Brake & Tire Longevity
Eliminating habitual hard braking and rapid curb acceleration extends the operational service life of commercial delivery van brake pads, rotors, and tires by up to 34%.
Eco-Driving Fuel Economy
Smoothing out driving acceleration profiles and eliminating excessive highway speeding cuts delivery vehicle fuel consumption by an average of 10% to 14% across urban delivery routes.
Frequently Asked Questions
What is delivery safety analytics software?
Delivery safety analytics software is an integrated fleet telematics platform that continuously tracks, measures, and scores driver behavior—such as harsh acceleration, hard braking, sharp cornering, speeding, and vehicle idling. It provides real-time in-cab alerts, generates automated driver safety scorecards, and delivers targeted coaching to reduce fleet collisions, lower commercial auto insurance rates, and optimize operating costs.
How does the software detect harsh driving events accurately?
The platform evaluates dynamic vehicle motion using high-precision 3-axis accelerometers, gyroscopes, and vehicle CAN-bus data. When the rate of speed change or lateral centrifugal force exceeds safe, pre-configured gravitational thresholds (such as deceleration greater than -0.45G during a hard brake or lateral force exceeding 0.40G on a turn), the system logs an event with exact GPS coordinates and timestamps.
Does monitoring driver behavior harm driver morale and retention?
When implemented transparently, driver safety analytics improves morale by replacing subjective supervisor opinions with objective, verified data. FleetRabbit normalizes scores based on route density and traffic conditions, allowing delivery operators to establish fair gamified leaderboards, reward safe driving with performance bonuses, and build a positive safety culture.
Can our fleet run this safety software without installing expensive cameras?
Yes. FleetRabbit is completely hardware-agnostic. The platform captures comprehensive driver safety analytics through standard vehicle OBD-II telematics modems, factory OEM fleet gateways, or directly via the built-in accelerometer and GPS sensors of standard driver iOS and Android smartphones running the mobile application.
How does safety analytics software lower commercial auto insurance premiums?
Commercial auto insurance underwriters evaluate risk based on loss history and verifiable safety controls. FleetRabbit generates cryptographically signed safety scorecards and empirical risk reduction ledgers showing consistent reductions in speeding and harsh driving events, allowing carriers to negotiate significant insurance premium discounts of up to 28%.
Empower Your Delivery Fleet with Real-Time Safety Analytics
Eliminate risky driving behaviors, safeguard commercial insurance profiles, and protect your drivers on every route. Experience FleetRabbit today with zero proprietary hardware lock-in.







