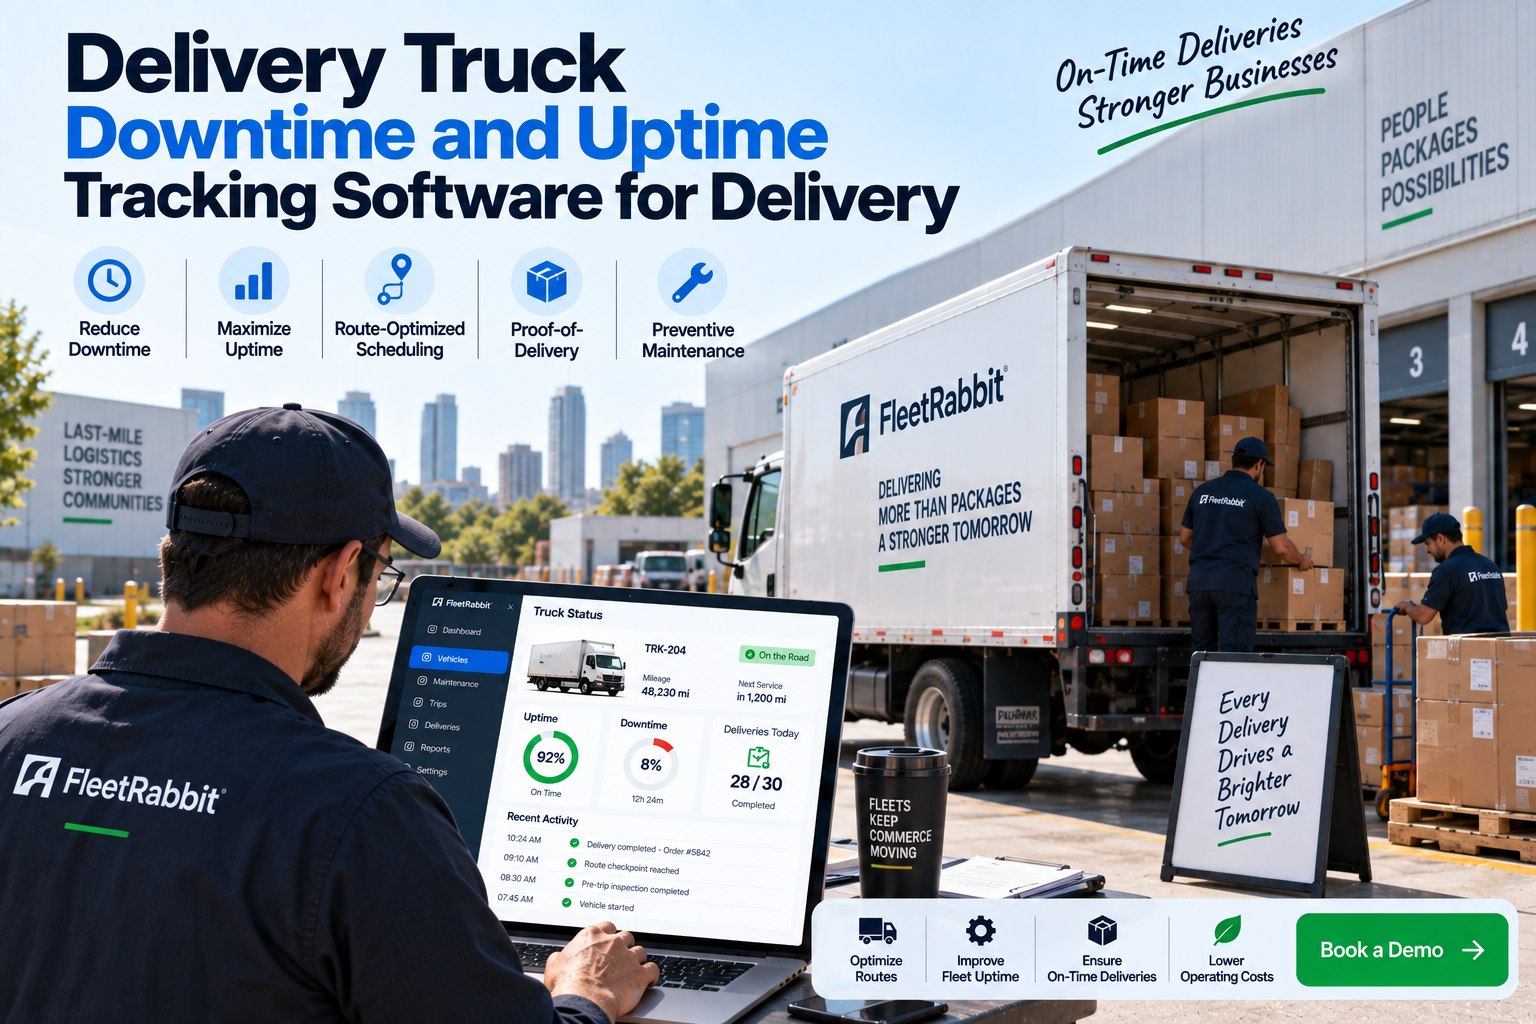
Every hour a delivery truck sits in a bay instead of on a route is an hour of route density, customer promises, and driver hours that nobody gets back. Most fleets can tell you their on-time delivery rate without blinking, but ask them what their fleet-wide uptime percentage was last month and the answer usually comes from memory instead of a report. Downtime tracking is not the same thing as maintenance tracking, it is the number that tells a fleet manager how much of their paid-for capacity actually showed up to work today. This page covers how to actually measure uptime across a delivery fleet, where downtime hides before it becomes a missed route, and how route-optimized scheduling and proof-of-delivery data feed back into keeping trucks moving instead of parked.
That single bar is the number most delivery fleets are missing, because uptime only means something once it is measured the same way every day, across every truck, instead of estimated after the fact from memory and work order dates. A fleet running at 92 percent uptime and one running at 82 percent can have nearly identical maintenance budgets on paper, yet the second one is quietly losing a full extra truck's worth of capacity every week. Fleets ready to see that number update in real time can sign up and connect their existing telematics feed in an afternoon.
A live status board like that turns downtime from a monthly report into a same-day decision. A dispatcher who can see Truck 24 failed its pre-trip brake check at 6 a.m. can reroute its stops to Trucks 12 and 31 before a single customer notices a delay, instead of finding out at noon that a route never left the yard. That is the entire value case for book a demo requests we get from ops teams who are tired of discovering downtime after it has already cost them a route.
Connect your delivery fleet and get a live status board instead of a downtime report that arrives after the damage is done.
Notice how much of that breakdown is preventable rather than random. Overdue preventive maintenance and driver-reported defects sitting unaddressed together account for roughly two out of every five downtime hours, and both are visible days or weeks before the truck actually goes down. A fleet that wants to shrink that first category can sign up for predictive maintenance alerts that flag a component before it fails on route instead of after.
That last row is easy to overlook, but it matters just as much as the maintenance itself. A truck flagged for service at 6 a.m. before its first route costs a fleet nothing, while the same service pulled at 2 p.m. mid-route can cascade into three or four missed delivery windows. Route-optimized scheduling that accounts for a truck's maintenance needs alongside its stop list is how a fleet manager avoids turning one small repair into an afternoon of rescheduled customers, which is exactly what teams see when they book a demo of scheduling that treats maintenance as part of the route plan instead of an interruption to it.
- Uptime estimated monthly from work order dates
- Dispatchers find out about a down truck mid-route
- Maintenance and delivery schedules planned separately
- POD data sits apart from vehicle health records
- Uptime percentage calculated in real time, fleet-wide
- Live status board flags a down truck before dispatch
- Service windows scheduled around the route plan
- POD, telematics, and maintenance data live together
The distance between those two columns is usually the distance between a fleet that reacts to downtime and one that plans around it. Delivery operations live or die on route density, and every truck sitting down unexpectedly is capacity a fleet already paid for and cannot use. Fleets that are still calculating uptime from memory at the end of the month are the ones most exposed to the next surprise breakdown, so this is a good week to sign up and start tracking it in real time instead.
Book a demo and see route-optimized scheduling, proof-of-delivery, and uptime tracking working together, live in days.







