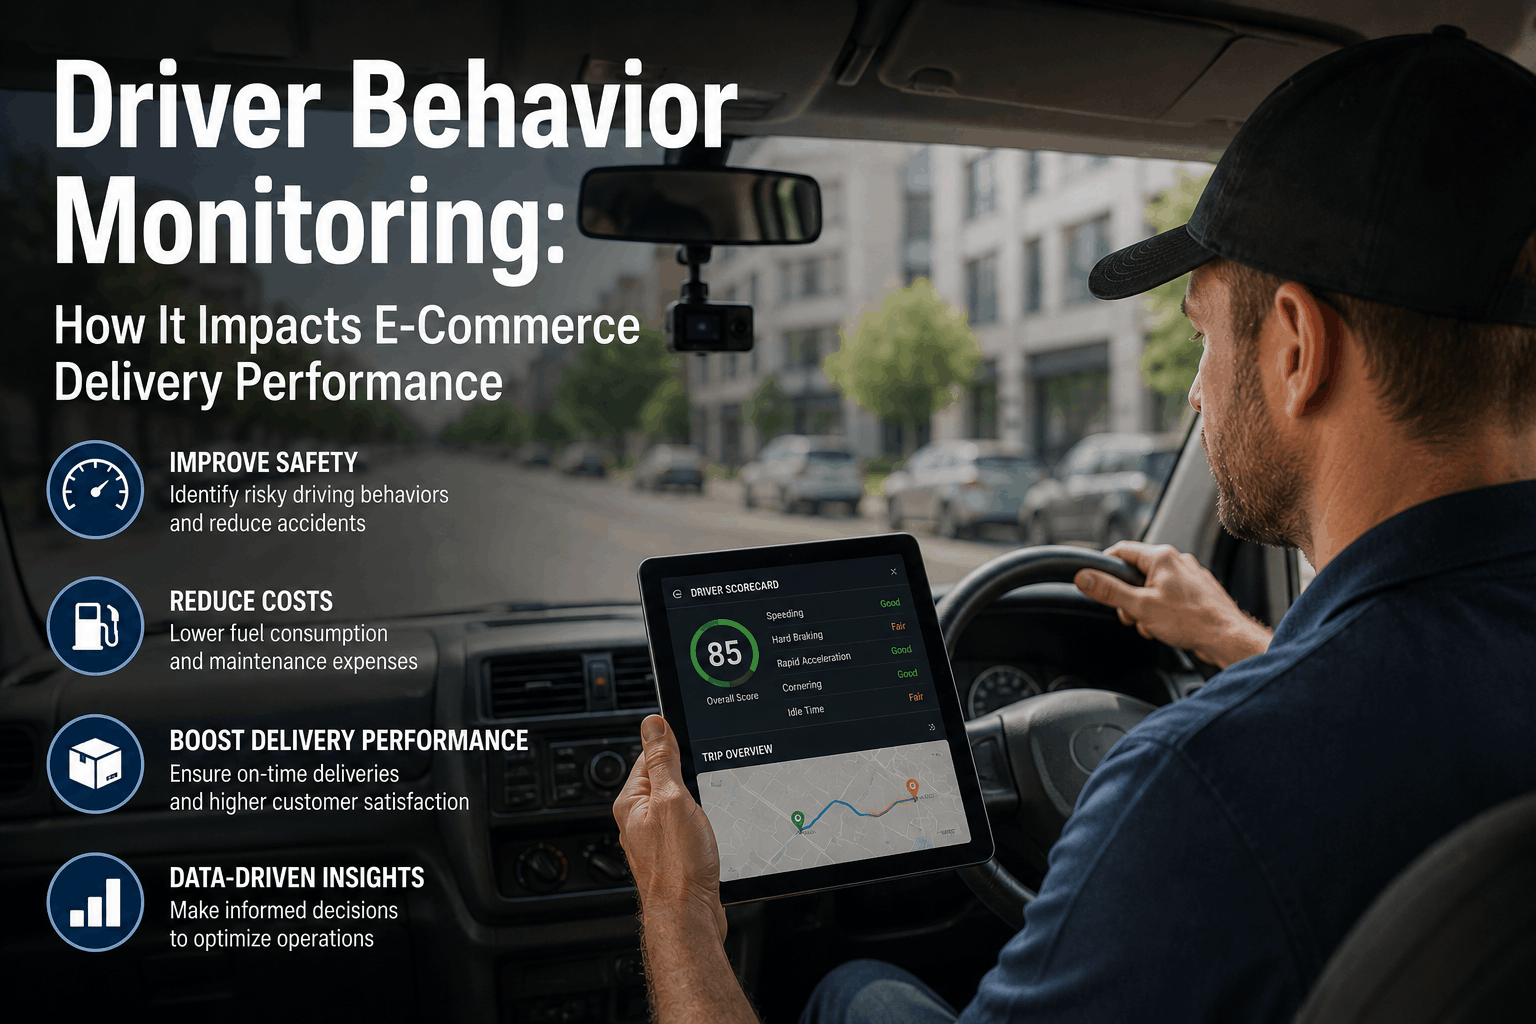
Driver behavior monitoring transforms Western US e-commerce delivery fleets by turning invisible habits — harsh braking on I-5, speeding on Nevada highways, excessive idling in Phoenix staging yards — into measurable, correctable data. Fleet Rabbit's telematics platform captures driver behavior in real time across vans, box trucks, and last-mile vehicles, linking every event to delivery KPIs, fuel costs, and accident exposure. Book a demo to see Fleet Rabbit's driver behavior monitoring applied to your delivery fleet.
Quick Answer
Driver behavior monitoring reduces accident costs by 25–40%, cuts fuel waste by 12–18%, and improves on-time delivery rates by up to 22% across Western US e-commerce fleets. Fleet Rabbit tracks harsh braking, speeding, rapid acceleration, and idle time in real time — scoring every driver, routing alerts to managers, and generating DOT-ready reports across California, Nevada, Arizona, Oregon, and Washington fleets.
The Hidden Cost of Unmonitored Driver Behavior in Western US Delivery Fleets
A 30-vehicle last-mile delivery fleet operating across Los Angeles, Phoenix, or Seattle absorbs $180,000–$340,000 annually in avoidable costs tied directly to driver behavior — accidents, excess fuel burn, accelerated brake wear, and missed delivery windows. Without event-level telematics, these costs appear as overhead, not correctable patterns.
Accident Costs
$9.2K
avg cost per at-fault collision
Excess Fuel Burn
$4.1K
monthly waste per 30-vehicle fleet
Brake & Tire Wear
$2.7K
avg annual cost per aggressive driver
Late Deliveries
18%
avg miss rate tied to route behavior
How Fleet Rabbit Monitors Driver Behavior Across Delivery Fleets
CAN Bus + Accelerometer Fusion
Fleet Rabbit reads engine data via OBD-II and CAN bus while a 3-axis accelerometer captures g-force events in real time — harsh braking, rapid acceleration, sharp cornering across any van, box truck, or sprinter. Compatible with Ford, Freightliner, Mercedes, Ram, and 50+ OEMs.
AI Driver Scoring Engine
Each driver receives a continuous safety score weighted by event severity, frequency, and route context. Scores update every 15 minutes and feed fleet manager dashboards, coaching workflows, and insurance documentation programs.
Idle Time Tracking by Zone
Fleet Rabbit maps idle events to geofenced delivery zones — distinguishing unavoidable traffic idle on I-405 from excessive staging idle at a Sacramento warehouse. Zone-aware reporting eliminates false flags and pinpoints where coaching matters most.
KPI #1: Harsh Braking Detection — The Leading Indicator of Accident Risk
Accident Rate Reduction After Harsh Braking Monitoring — Western US Delivery Fleets
Fleet Rabbit platform data, Western US e-commerce delivery fleets 2024–2025. Harsh braking events above 0.4g correlate with 3.2x higher collision probability on California and Nevada routes.
1
Real-Time Harsh Event Alerts
Fleet Rabbit fires in-cab audio alerts and manager SMS notifications within 8 seconds of a harsh braking or rapid acceleration event. Alerts include driver ID, GPS location, speed at event, and severity classification — giving dispatchers in Los Angeles or Seattle immediate visibility without waiting for end-of-shift reports.
Southern California last-mile operator, 44 drivers: After enabling real-time harsh braking alerts, average events per driver per shift dropped 61% within 30 days — before a single formal coaching session was held. Awareness alone drove the change.
2
Speeding Alerts with Route Context
Fleet Rabbit cross-references GPS speed against posted speed limits updated monthly for California, Nevada, Arizona, Oregon, and Washington road networks — distinguishing highway variance from residential delivery zone violations and filtering alert noise to surface only high-liability events.
Posted limit matchingResidential zone priorityHighway context filtering
3
Idle Time KPI Reporting
Idle events above configurable thresholds log automatically and roll up to per-driver, per-route, and per-site weekly reports. Phoenix and Las Vegas fleets apply adjusted thresholds for cab cooling compliance, keeping idle reporting accurate across the Western US climate range.
Oregon e-commerce distributor, 22 vehicles: Fleet Rabbit idle reporting identified $1,840/month in avoidable fuel burn concentrated in 4 drivers on the Portland metro route — resolved in 6 weeks through targeted coaching.
Driver Behavior Monitoring Platform
Reduce Accidents and Improve Delivery KPIs Across Your Western US Fleet — Free Trial, No Hardware Commitment
OEM-agnostic telematics. Installs on any vehicle in hours. Real-time driver scoring, harsh event alerts, and idle reporting from day one.
37%
Accident Rate Reduction
KPIs #2–5: Speeding Compliance, Delivery Performance, Insurance Impact & Driver Coaching
KPI #2: Speeding Compliance Rate — Protect Liability Across Western US Routes
The liability exposure: A delivery driver clocked at 42 mph in a 25 mph residential zone in Sacramento or Tucson exposes the fleet to $80,000–$400,000 in at-fault liability per incident. California AB-5 and Nevada commercial driver statutes compound employer liability when no monitoring record exists.
Fleet Rabbit tracks: Speeding compliance rates by driver, route, and zone type — with monthly trend lines showing whether coaching is holding. Dashboards export directly for legal discovery and insurer audits.
Western US impact: Fleets with documented speeding compliance programs see 18–28% lower commercial auto premiums with major carriers operating in California and Arizona.
KPI #3: On-Time Delivery Rate — Link Driver Behavior to Customer SLAs
The missed window cost: A fleet missing 18% of two-hour windows in the Los Angeles or Seattle market faces $12–$28 per failed attempt in redelivery cost, plus customer churn at 2–4x the rate of on-time fleets. Route behavior drives the majority of avoidable misses.
Fleet Rabbit links: Driver behavior scores correlate directly with on-time delivery rates per route — identifying whether a missed window was traffic, behavior, or dispatch. Coaching targets the actual cause.
Outcome: Western US fleets using behavior-linked dispatch reporting improve on-time rates by 14–22% within 60 days of deployment.
KPI #4: Insurance Premium Reduction — Document Safety for Carrier Negotiations
Western US insurance context: Commercial auto insurance for California and Nevada delivery fleets has increased 31–48% since 2021. Carriers including Zurich, Sentry, and Progressive Commercial offer 10–22% premium discounts for fleets with verified telematics programs.
Fleet Rabbit provides: Continuous driver safety scores, event frequency trends, and coaching documentation in carrier-accepted export formats — meeting requirements for Zurich SafetyScore and Progressive Snapshot Commercial programs.
Premium benefit: A 30-vehicle fleet saving 15% on $180K annual premium recovers $27,000/year — often exceeding total platform cost.
KPI #5: Coaching Effectiveness — Turn Data Into Measurable Behavior Change
The coaching gap: Without event-level data, coaching relies on memory and observation — capturing under 10% of actual behavior events. Drivers with objective feedback improve 3–4x faster than those without weekly score reports.
Fleet Rabbit enables: Automated weekly driver score reports with event playback clips and ranked peer comparison. Managers receive coaching priority queues — the 3 drivers needing attention this week, with specific events to reference.
Outcome: Telematics-based coaching reduces harsh event frequency by 55–70% within 90 days — sustained improvement, not one-time compliance.
Before vs. After Fleet Rabbit Driver Monitoring — 30-Vehicle Western US Delivery Fleet
Without Driver Monitoring
Harsh braking visibility: End-of-shift reports only
Speeding events caught: Under 15% of incidents
Idle time tracked: Manual spot checks
Driver accountability: Observation-based only
Insurance premium trend: +8–14% annually
On-time delivery rate: 78–82% average
With Fleet Rabbit Monitoring
Harsh braking visibility: Real-time, 8-second alert
Speeding events caught: 98%+ of incidents logged
Idle time tracked: Zone-aware continuous log
Driver accountability: Scored, coached, documented
Insurance premium trend: -10–22% with telematics
On-time delivery rate: 93–96% within 60 days
Frequently Asked Questions: Driver Behavior Monitoring for Delivery Fleets
QDoes Fleet Rabbit work on electric delivery vans alongside diesel trucks?
Yes. Fleet Rabbit supports EV-specific behavior monitoring for Rivian EDV, Ford E-Transit, and Mercedes eSprinter fleets — adapting idle thresholds for regenerative braking and tracking kWh consumption alongside traditional harsh event scoring. Mixed ICE and EV fleets run in the same dashboard with appropriate baselines for each powertrain.
QHow does Fleet Rabbit handle driver privacy under California law?
Fleet Rabbit's platform is designed for California Labor Code compliance and similar statutes in Oregon and Washington. Monitoring is active only during duty hours linked to a driver credential login — the system does not track personal vehicle use or off-duty activity. Driver score reports are shared with the individual driver before escalation to management.
QCan driver scoring integrate with existing HR or dispatch software?
Fleet Rabbit provides REST API access and pre-built integrations with Samsara, Verizon Connect, McLeod, and major WMS platforms used by Western US e-commerce operators. Driver score data, event logs, and coaching records export to standard HRIS formats for performance documentation and disciplinary record-keeping.
QHow quickly does driver behavior improve after Fleet Rabbit deployment?
Western US fleets see a measurable awareness effect within the first 2 weeks — harsh event frequency drops 30–45% before formal coaching begins. Structured coaching using Fleet Rabbit's weekly reports produces sustained 55–70% event reduction within 90 days. Full ROI on insurance, fuel, and accident cost savings typically closes within 60 days for fleets over 20 vehicles.
Related Fleet Rabbit Resources
The four AI capabilities transforming fleet operations — real-time GPS, predictive health monitoring, dynamic route optimization, and delivery performance analytics — with ROI data for each.
AI-driven fault prediction and automated maintenance scheduling that prevents mid-route breakdowns across delivery vans, box trucks, and sprinters.
Real-time utilization tracking, idle reduction analytics, and fleet right-sizing data that reduce total delivery fleet operating cost for Western US e-commerce operators.
How GPS hardware, IoT sensors, and cloud analytics combine to deliver real-time vehicle visibility, driver scoring, and operational intelligence across last-mile delivery fleets.
Improve Delivery Performance and Cut Accident Costs — See Fleet Rabbit in Action
Fleet Rabbit's OEM-agnostic driver behavior platform delivers real-time harsh event alerts, automated driver scoring, idle time tracking, insurance documentation, and coaching workflows across your Western US delivery fleet. On-premise or cloud. Any vehicle. Full ROI in 60 days.
OEM-Agnostic8s Alert TimeAI Driver ScoringCA Privacy Compliant60-Day ROI
May 29, 2026
By Michael Finn
All Posts