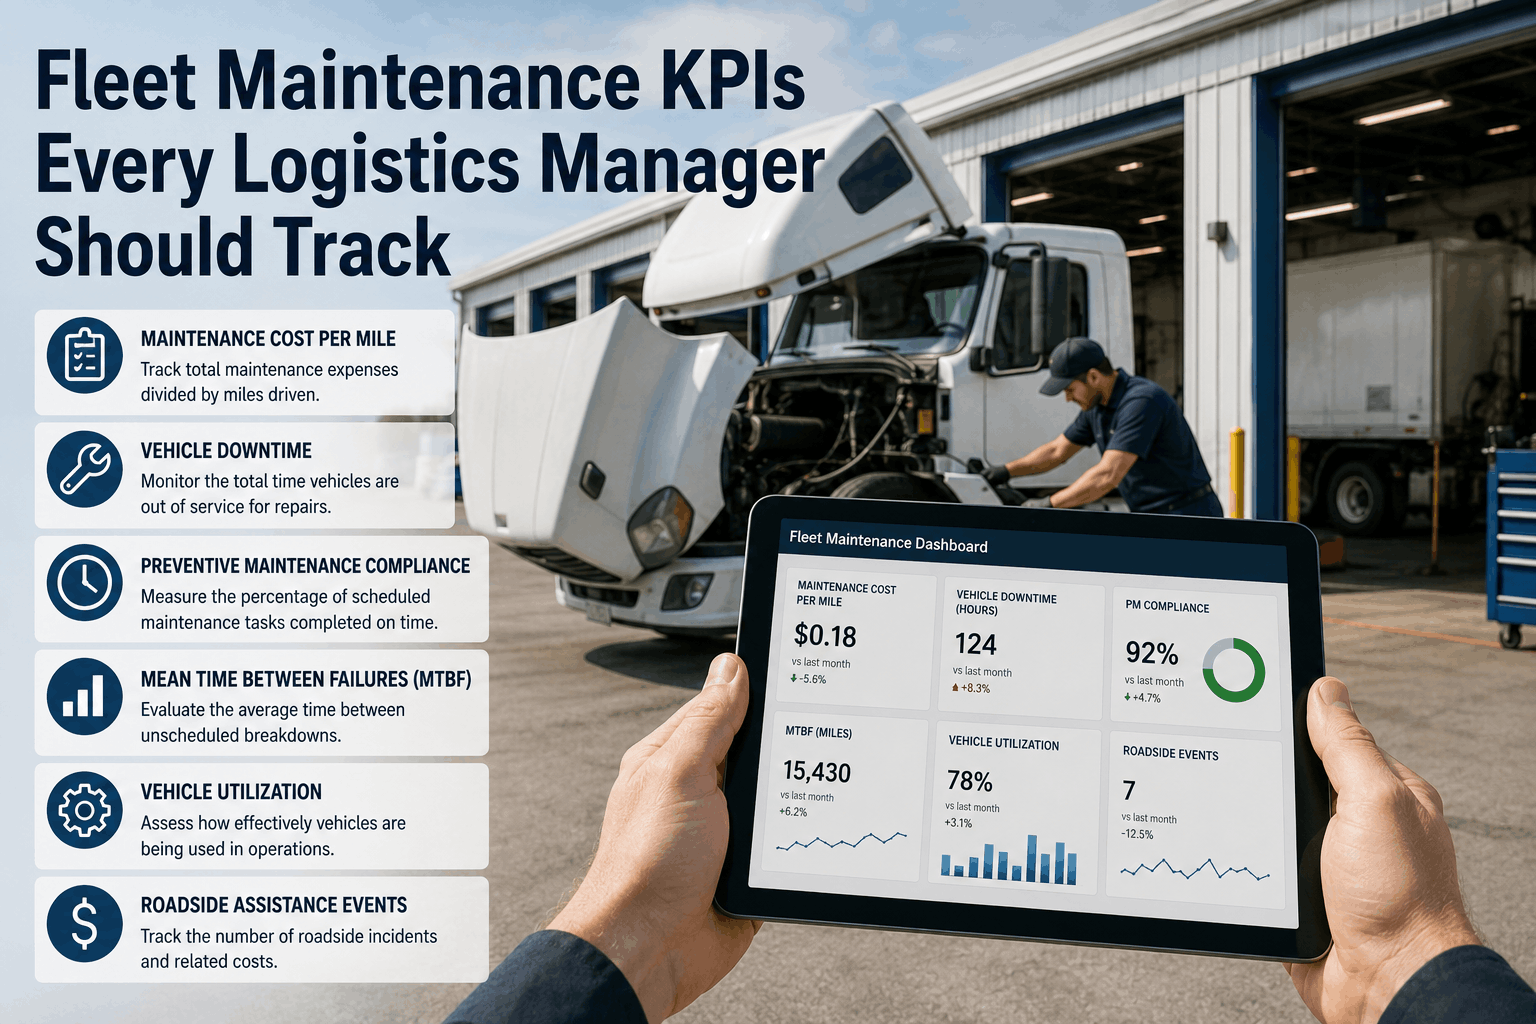
Fleet maintenance KPIs separate Western US logistics operations that control costs from those that absorb them. A Phoenix distribution fleet running 40 trucks without MTBF tracking pays 3–5x more in reactive repairs than a Sacramento competitor measuring the same machines with disciplined KPI dashboards. These 10 metrics give California, Nevada, Arizona, and Oregon fleet managers the visibility to prevent breakdowns, reduce downtime, and defend maintenance budgets. Book a demo to see Fleet Rabbit's maintenance KPI dashboard applied to your logistics fleet.
Quick Answer
The 10 essential fleet maintenance KPIs for Western US logistics managers are: MTBF, MTTR, PM Compliance Rate, Cost Per Mile, Fleet Availability Rate, Breakdown Rate, Warranty Recovery Rate, First-Time Fix Rate, Tire Cost Per Mile, and Fuel Efficiency vs Baseline. Together they give full visibility into reliability, cost control, and technician performance across California, Nevada, Arizona, and Oregon operations.
Why Fleet Maintenance KPIs Matter for Western US Logistics
A 30-truck fleet operating between Los Angeles and Phoenix averages 18,000–24,000 miles per vehicle per month. Without structured KPI tracking, maintenance costs run 22–35% above benchmark — driven by undetected PM drift, reactive repair cycles, and unrecovered warranty claims. The 10 KPIs below form the minimum viable measurement framework for any Western US logistics operation running 10 or more vehicles.
Reactive Repair Premium
3–5x
cost vs planned maintenance
Avg Downtime Cost
$760/day
per unit, Western US logistics
Unrecovered Warranty
$1,200
avg annual loss per vehicle
PM Compliance Gap
28%
avg fleet without KPI tracking
The 10 Fleet Maintenance KPIs Every Logistics Manager Must Track
KPI #1 — Mean Time Between Failures (MTBF)
MTBF measures average operating hours between unplanned failures. A Western US long-haul fleet targeting 95% availability needs MTBF above 420 hours per vehicle. Fleets below 280 hours are in reactive maintenance cycles that compound costs quarterly. Fleet Rabbit calculates MTBF by asset class, route corridor, and driver automatically.
KPI #2 — Mean Time to Repair (MTTR)
MTTR tracks average hours from fault detection to return-to-service. California and Arizona logistics benchmarks sit at 3.8–5.2 hours for Class 8 trucks. MTTR above 9 hours signals technician bottlenecks, parts procurement failures, or shop capacity issues — each a distinct fix requiring different intervention.
KPI #3 — PM Compliance Rate
PM Compliance Rate measures the percentage of scheduled preventive maintenance completed on time. Western US fleets hitting 92%+ PM compliance run 31% lower emergency repair costs than fleets at 70% compliance. Each missed PM pushes a vehicle 18–22% closer to an unplanned failure within the next service window.
4
Cost Per Mile (CPM)
CPM divides total maintenance spend by miles operated per vehicle per period. Western US Class 8 benchmarks run $0.14–$0.19 per mile for maintenance-only CPM. Fleets above $0.24 are carrying undetected inefficiencies — typically aging assets past optimal replacement point, or high tire and brake consumption from mountain corridor routes (I-15, I-5, US-395).
Nevada freight contractor, 22 trucks: Fleet Rabbit CPM tracking revealed their I-15 corridor vehicles ran $0.31/mile vs $0.17 for flat-route units — leading to route-specific PM intervals that cut annual maintenance cost by $88,000.
5
Fleet Availability Rate
Fleet Availability Rate is the percentage of scheduled operating hours a vehicle is ready and fit for service. A 30-truck California distribution fleet needs 91%+ availability to meet contracted delivery SLAs. Availability below 85% forces expensive spot carrier use — typically 40–65% above owned-fleet operating cost per load.
Target: 91%+ availabilitySpot carrier cost: +40–65%Measured per asset
6
Breakdown Rate
Breakdown Rate counts roadside failures per 100,000 miles. Western US logistics operations benchmark at 0.8–1.4 breakdowns per 100k miles for well-maintained fleets. Arizona and Nevada desert heat accelerates coolant system failures in summer — fleets without heat-season PM adjustments see breakdown rates 2.2–2.8x above baseline from June through September.
Oregon logistics operator, 15 trucks: After Fleet Rabbit flagged a 3.1 breakdown rate on their I-84 corridor units, targeted cooling system inspections ahead of summer eliminated 8 roadside events in the following 90 days.
7
Warranty Recovery Rate
Warranty Recovery Rate tracks the percentage of eligible warranty claims successfully submitted and recovered. Western US fleets running Kenworth, Peterbilt, and Freightliner equipment leave $900–$1,800 per vehicle annually in unrecovered warranty — primarily from missed filing windows and insufficient fault documentation. Fleet Rabbit's automated fault logging captures OEM-required evidence at the point of failure, not days later.
California refrigerated carrier, 28 units: Fleet Rabbit warranty documentation increased annual recovery from $12,000 to $41,000 in the first 12 months — pure recovered cost with zero additional spend.
Fleet Maintenance KPI Platform
Track All 10 Fleet Maintenance KPIs Automatically — Free Trial, No Hardware Commitment
OEM-agnostic telematics. Installs on any brand in hours. Real-time KPI dashboards, automated alerts, and full maintenance accountability from day one.
31%
Lower Emergency Repair Cost
KPIs #8–10: First-Time Fix Rate, Tire Cost Per Mile, and Fuel Efficiency vs Baseline
KPI #8 — First-Time Fix Rate (FTFR)
What it measures: The percentage of repairs completed correctly on the first attempt, without rework or return visits within 30 days. Western US benchmark sits at 78–84% FTFR for in-house shop operations.
Why it matters: Each rework event costs 1.8–2.4x the original repair labor. A 15-truck fleet with a 65% FTFR is absorbing $28,000–$44,000 annually in redundant labor and parts.
Fleet Rabbit tracks: FTFR per technician, per fault code, and per vehicle model — identifying whether rework is driven by parts quality, diagnostic accuracy, or specific asset issues.
KPI #9 — Tire Cost Per Mile
What it measures: Total tire spend (purchase, rotation, repair, disposal) divided by miles driven per vehicle. Western US mountain corridors (I-5 Grapevine, I-15 Cajon Pass, US-50 Sierra Nevada) accelerate tire wear 35–55% above flatland benchmarks.
Why it matters: Tires represent 18–24% of total maintenance spend for California and Nevada long-haul fleets. A 0.2¢/mile increase across 30 trucks running 18,000 miles monthly adds $12,960 annually — invisible without per-unit tracking.
Fleet Rabbit links: Tire CPM to route assignments and driver behavior scores — isolating whether wear is geographic or operator-driven.
KPI #10 — Fuel Efficiency vs Baseline
What it measures: Each vehicle's current MPG versus its calibrated baseline, adjusted for load and route type. A 6% fuel efficiency decline signals maintenance issues — DPF buildup, injector wear, tire underinflation — before they become breakdown events.
Why it matters: A 30-truck California fleet burning 10% above efficiency baseline spends $68,000–$94,000 extra annually in diesel. Correcting the underlying maintenance cause costs a fraction of that figure.
Fleet Rabbit integrates: Fuel efficiency KPI with engine fault codes and maintenance history — automatically flagging vehicles where efficiency decline correlates with overdue PM intervals.
Bonus: Maintenance Cost as % of Asset Value
What it measures: Annual maintenance spend divided by current asset replacement value, per vehicle. Western US benchmarks run 12–18% for trucks in years 3–7 of service life. Assets exceeding 28% signal replacement candidacy — keeping them in service costs more than cycling them out.
Why it matters for Western US fleets: California and Nevada equipment replacement cycles are distorted by used truck market volatility and EPA CARB compliance requirements — making asset value benchmarking critical for replacement timing decisions.
Fleet Rabbit calculates: This ratio automatically per vehicle, flagging replacement candidates before they become cost anchors on your P&L.
KPI Benchmark Table: Western US Logistics Fleet Targets
Fleet Maintenance KPI Benchmarks — California, Nevada, Arizona, Oregon
MTBF
420+ hours
Below 280 hrs
MTTR
Under 5.2 hrs
Above 9 hrs
PM Compliance Rate
92%+
Below 75%
Cost Per Mile
$0.14–$0.19
Above $0.24
Fleet Availability Rate
91%+
Below 85%
Breakdown Rate
Under 1.4 / 100k mi
Above 2.5 / 100k mi
Warranty Recovery Rate
85%+
Below 55%
First-Time Fix Rate
82%+
Below 68%
Tire Cost Per Mile
Under $0.038
Above $0.055
Fuel Efficiency vs Baseline
Within 3%
6%+ decline
Fleet Rabbit platform benchmarks, Western US logistics fleets 2024–2025. Class 8 and mixed-fleet operations, California, Nevada, Arizona, Oregon.
Before vs. After KPI Tracking — 30-Unit Western US Logistics Fleet
Without KPI Tracking
Maintenance cost insight: Monthly invoice totals only
Breakdown detection: Roadside call or driver report
PM scheduling: Manufacturer interval, unadjusted
Warranty recovery: 40–55% of eligible claims
Technician accountability: None — no per-tech data
Annual maintenance overspend: $48,000–$92,000
With Fleet Rabbit KPI Tracking
Maintenance cost insight: Per-vehicle, per-mile, per-fault
Breakdown detection: Predictive — before roadside event
PM scheduling: Route and load-adjusted intervals
Warranty recovery: 85–95% of eligible claims
Technician accountability: FTFR and MTTR per tech
Annual maintenance overspend: Under $8,000
31%
Lower Emergency Repair Cost
94%
Warranty Recovery Rate
91%+
Fleet Availability Target
10
KPIs Tracked Automatically
$0.17
Benchmark CPM Target
Frequently Asked Questions: Fleet Maintenance KPIs
QWhich fleet maintenance KPI should a Western US logistics manager track first?
Start with PM Compliance Rate. It directly controls downstream KPIs — MTBF, breakdown rate, and CPM all degrade in proportion to PM compliance gaps. A fleet hitting 92%+ PM compliance typically outperforms on every other metric without additional intervention. Fleet Rabbit surfaces this KPI on the main dashboard with per-vehicle drill-down.
QHow does Fleet Rabbit calculate MTBF and MTTR automatically?
Fleet Rabbit's telematics platform captures fault code timestamps, engine-off events during unplanned stops, and return-to-service ignition events via CAN bus integration. MTBF and MTTR are calculated per vehicle and rolled up to fleet level in real time — no manual log entry required. Compatible with Kenworth, Peterbilt, Freightliner, Volvo, and 40+ OEMs.
QDo California CARB compliance requirements affect how fleet maintenance KPIs are tracked?
Yes. CARB-compliant fleets must document PM intervals, engine fault responses, and emissions-related repair events with timestamps and technician credentials. Fleet Rabbit's immutable maintenance logs meet CARB documentation requirements automatically — reducing compliance preparation time from 8–12 hours per audit to under 30 minutes via dashboard export.
QCan Fleet Rabbit track these KPIs across mixed fleets with different OEMs?
Yes. Fleet Rabbit is OEM-agnostic and installs on any brand — Kenworth, Peterbilt, Freightliner, International, Volvo, and 40+ others — in a single unified dashboard. A 30-truck California fleet with 4 different OEMs runs all 10 KPIs on one screen, normalized to the same measurement framework. Installation averages 4–6 vehicles per day with no equipment downtime.
Fleet Maintenance KPI Platform
Start Tracking All 10 Fleet Maintenance KPIs — Free Trial, No Hardware Commitment
OEM-agnostic sensors. Installs on any brand in hours. Automatic KPI dashboards, predictive maintenance alerts, and full fleet accountability from day one.
Related Fleet Rabbit Resources
The four AI capabilities transforming fleet operations — real-time GPS, predictive health monitoring, dynamic route optimization, and delivery performance analytics — with ROI data for each.
AI-driven fault prediction and automated maintenance scheduling that prevents mid-project breakdowns — the reliability layer IoT sensor data powers across trucks, trailers, and mixed fleets.
Real-time utilization tracking, idle reduction analytics, and fleet right-sizing data that reduce total operating cost for Western US logistics and contractor fleets.
How GPS hardware, IoT sensors, and cloud analytics combine to deliver real-time fleet visibility, predictive maintenance, and operational intelligence for logistics managers.
Track All 10 Fleet Maintenance KPIs Automatically — See Fleet Rabbit in Action
Fleet Rabbit's OEM-agnostic telematics platform delivers automatic MTBF, MTTR, PM compliance, CPM, and 6 more KPIs across your Western US logistics fleet. On-premise or cloud. Any brand. Full ROI in 45 days.
OEM-Agnostic10 KPIs Auto-TrackedCARB-Ready LogsOn-Premise Option45-Day ROI
May 29, 2026
By Lebron
All Posts