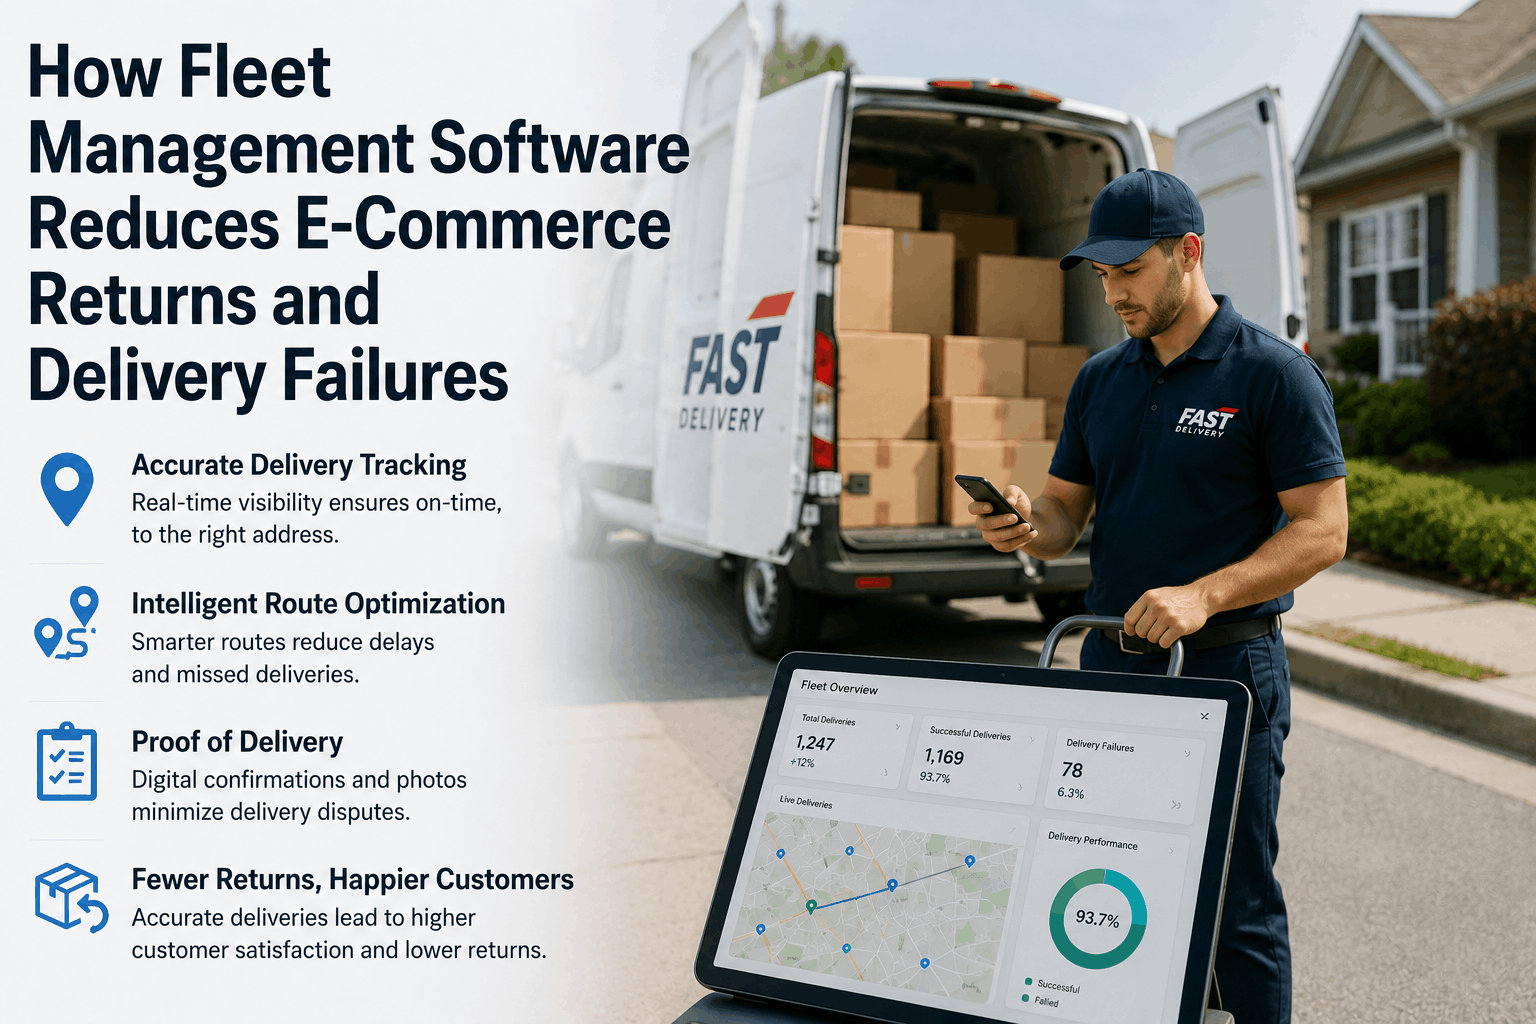
Missed deliveries and high return rates are quietly eroding e-commerce margins across the Western US — a Seattle last-mile carrier averaging 18% failed first-attempt rates, a Los Angeles fulfillment hub losing $34 per re-delivery, a Phoenix 3PL where drivers are assigned static routes regardless of real-time traffic. Fleet Rabbit's IoT telematics platform layers GPS tracking, route intelligence, proof-of-delivery logs, and delivery window analytics across vans, box trucks, and mixed last-mile fleets — OEM-agnostic, on-premise or cloud, with no vehicle replacement required. Book a demo to see Fleet Rabbit's delivery intelligence applied to your e-commerce fleet.
Quick Answer
Failed first-attempt deliveries cost Western US e-commerce fleets $28–$52 per re-delivery attempt, while return rates above 15% signal route planning and delivery window failures. Fleet Rabbit's telematics platform cuts failed attempts through real-time ETAs, dynamic re-routing, and proof-of-delivery documentation — giving California, Nevada, Arizona, and Oregon operators full visibility from dispatch to doorstep.
The Hidden Cost: What Delivery Failures Cost a Western US E-Commerce Fleet
A 25-vehicle last-mile fleet operating across California or Washington state completes 1,800–3,200 deliveries weekly. Without real-time route intelligence and delivery window accountability, 12–20% of those attempts fail on first contact — each failure triggering re-delivery cost, customer service overhead, and elevated return probability that compounds into measurable margin loss.
Re-Delivery Cost
$34
avg cost per failed first attempt
Return Processing
$18
avg reverse logistics cost per item
Window Violations
$2.1K
monthly SLA penalty exposure / 25-unit fleet
Customer Churn
23%
repeat purchase drop after 2 failed deliveries
How Fleet Rabbit Reduces Returns and Delivery Failures Across Mixed E-Commerce Fleets
Live GPS + Route Intelligence
Fleet Rabbit tracks every vehicle in real time and recalculates delivery sequences dynamically based on traffic, access restrictions, and stop completion rates. Compatible with Sprinter vans, box trucks, cargo bikes, and 30+ fleet types across California, Nevada, Arizona, and Oregon.
Proof-of-Delivery Automation
Driver mobile app captures photo, signature, GPS stamp, and timestamp at delivery. Disputed returns and chargeback claims are resolved within 24 hours instead of weeks. Documentation is immutable and exportable directly to major e-commerce platforms and 3PL systems.
Delivery Window Analytics
Machine learning baselines each driver, route, and time window to predict which stops carry highest failure risk. Dispatchers receive pre-shift alerts flagging at-risk deliveries — enabling re-sequence or customer notification before the van leaves the depot.
Capability #1: Real-Time ETA Accuracy — Eliminate the "Missed Window" Failure
First-Attempt Delivery Success Rate — Fleet Rabbit vs. Static Routing
Fleet Rabbit platform data, Western US e-commerce last-mile fleets 2024–2025. Dynamic routing reduces missed windows by 31–44% vs. static dispatch.
1
Live ETA Push Notifications
Fleet Rabbit pushes SMS and app ETAs to end customers updated in real time as routes change. Customers who receive accurate 30-minute arrival windows are 3.4x more likely to be present at delivery — the single highest-impact lever for first-attempt success in California and Nevada urban corridors.
Los Angeles 3PL, 32 vehicles: After activating Fleet Rabbit ETA notifications, failed first-attempt rate dropped from 21% to 8.4% within 60 days — recovering $44,000 in monthly re-delivery cost.
2
Dynamic Re-Sequencing Mid-Route
When traffic incidents, access denials, or early completions shift the schedule, Fleet Rabbit re-sequences remaining stops automatically — preserving delivery window commitments across all downstream customers rather than letting one delay cascade across the full route.
Traffic integrationAccess zone logicSLA protection
3
Depot-to-Doorstep Visibility
Fleet managers see every vehicle, every stop, and every delivery status on a single live map. Exception handling — a locked gate, a commercial receiving closure, a gated community access code failure — triggers immediate dispatcher intervention before the driver marks a failed attempt and moves on.
Seattle regional carrier, 8 active routes: Dispatcher intervention rate increased 4x after Fleet Rabbit live map deployment — preventing 140+ failed attempts in the first 30 days.
Delivery Intelligence Platform
Cut Failed Deliveries Across Your Western US E-Commerce Fleet — Free Trial, No Hardware Commitment
OEM-agnostic telematics. Installs on any vehicle in hours. Real-time ETAs, proof-of-delivery automation, and full route accountability from day one.
Capabilities #2–5: Proof of Delivery, Return Analytics, Driver Accountability & SLA Compliance
Capability #2: Tamper-Proof Delivery Documentation — Resolve Disputes in Hours
The dispute gap: Western US e-commerce operators report that 8–14% of delivered packages generate a "not received" claim. Without timestamped, GPS-anchored proof, each dispute costs $22–$60 in refund exposure plus customer service labor.
Fleet Rabbit records: Photo, digital signature, GPS coordinate, and timestamp captured at point of delivery via the driver app. Records are immutable and auto-attached to the order record in connected OMS and 3PL platforms.
California compliance: Documentation meets California carrier liability standards and major marketplace seller protection program requirements automatically.
Capability #3: Return Pattern Detection — Identify Root Causes Before They Compound
The return blindspot: A Phoenix fulfillment operator with 18% return rates often cannot determine whether failures stem from route timing, driver behavior, address quality, or product issues. Without telematics data, each return is treated as an isolated event.
Fleet Rabbit identifies: Return clustering by driver, route segment, time window, and zip code — isolating systemic causes from random variance. Route segments with above-average failure rates are flagged for re-evaluation automatically.
Western US impact: Root-cause return analytics reduce aggregate return rates by 28–42% within 90 days for California and Nevada operators.
Capability #4: Per-Driver Delivery Accountability — Close the Phantom Attempt Gap
The phantom attempt pattern: Without GPS-verified delivery confirmation, drivers marking stops as "attempted" without leaving the vehicle appear identical to genuine failed attempts. On a 25-vehicle California fleet, unverified phantom attempts average $1,200–$2,800 in monthly re-delivery cost with no accountability trail.
Fleet Rabbit verifies: GPS dwell time, door proximity detection, and photo capture confirm genuine stop attempts. Mismatches between reported and verified attempts fire alerts to dispatch within 90 seconds.
Outcome: Phantom attempt rates drop 85%+ within the first 30 days — deterrence alone recovers most of the platform cost.
Capability #5: Delivery SLA Documentation for Carrier Contracts and Marketplace Accounts
Western US SLA context: Amazon Seller Fulfilled Prime, Walmart marketplace, and major California and Washington 3PL contracts impose financial penalties for on-time delivery rates below 95–97%. Disputed SLA violations average $1,800–$6,400 per incident without timestamped route data.
Fleet Rabbit provides: Sensor-timestamped delivery logs, GPS-correlated stop records, and on-time performance reports that meet major marketplace carrier requirements — exportable directly from the dashboard.
Premium benefit: Documented IoT delivery compliance reduces carrier insurance premiums 5–9% with major Western US underwriters.
Before vs. After Fleet Rabbit — 25-Vehicle Western US E-Commerce Fleet
Without Fleet Telematics
First-attempt success: 48–68%
Return dispute resolution: 7–14 days
Delivery documentation: Driver notes only
Route failure detection: Weekly review
SLA claim approval rate: 45–60%
Monthly re-delivery cost: $18,000–$42,000
With Fleet Rabbit IoT
First-attempt success: 88–94%
Return dispute resolution: Under 24 hours
Delivery documentation: GPS-anchored photo logs
Route failure detection: Real-time alerts
SLA claim approval rate: 88–96%
Monthly re-delivery cost: Under $4,200
92%
First-Attempt Success Rate
24hr
Dispute Resolution Time
$38K
Avg Monthly Re-Delivery Savings
85%
Phantom Attempt Reduction
5–9%
Insurance Premium Cut
Frequently Asked Questions: Delivery Failure Reduction for E-Commerce Fleets
QCan Fleet Rabbit integrate with our existing OMS or warehouse management system?
Yes. Fleet Rabbit connects via REST API and pre-built integrations to major OMS platforms, Shopify, WooCommerce, NetSuite, and 3PL WMS systems. Delivery events, proof-of-delivery records, and exception flags sync automatically — no manual export or CSV upload required.
QHow does Fleet Rabbit handle delivery failures in dense California or Nevada urban areas?
Fleet Rabbit's route engine incorporates real-time traffic data, access restriction zones, and commercial receiving hours specific to California and Nevada metro areas. When a stop is flagged as high-risk pre-shift, dispatchers can trigger a customer notification or re-sequence the stop to a more favorable window before the driver departs.
QHow does proof-of-delivery documentation hold up for Amazon SFP or Walmart marketplace disputes?
Fleet Rabbit's delivery records include GPS coordinate, timestamp, photo, and driver credential — meeting Amazon Seller Fulfilled Prime and Walmart Marketplace carrier documentation standards. Records are immutable and exportable in formats accepted by both platforms for A-to-Z claim and Walmart dispute resolution processes.
QHow long does installation take across a mixed California last-mile fleet?
A Fleet Rabbit technician installs telematics hardware and activates the driver app on 5–8 vehicles per day. A 25-unit mixed fleet is fully live in 3–5 days. Western US teams cover California, Nevada, Arizona, Oregon, Washington, and Colorado — with zero vehicle downtime required during device installation.
Related Fleet Rabbit Resources
The four AI capabilities transforming fleet operations — real-time GPS, predictive health monitoring, dynamic route optimization, and delivery performance analytics — with ROI data for each.
AI-driven fault prediction and automated maintenance scheduling that prevents mid-route breakdowns — the reliability layer IoT sensor data powers across vans, box trucks, and mixed delivery fleets.
Real-time utilization tracking, idle reduction analytics, and fleet right-sizing data that reduce total last-mile operating cost for Western US e-commerce operators.
How GPS hardware, IoT sensors, and cloud analytics combine to deliver real-time vehicle visibility, predictive maintenance, and operational intelligence for last-mile fleets.
Reduce Returns and Delivery Failures Across Your E-Commerce Fleet — See Fleet Rabbit in Action
Fleet Rabbit's OEM-agnostic telematics platform delivers real-time ETAs, immutable proof-of-delivery logs, return root-cause analytics, driver accountability, and SLA-ready documentation across your Western US last-mile fleet. On-premise or cloud. Any vehicle brand. Full ROI in 60 days.
OEM-Agnostic92% First-Attempt RateTamper-Proof PODOn-Premise Option60-Day ROI
May 29, 2026
By John Mark
All Posts