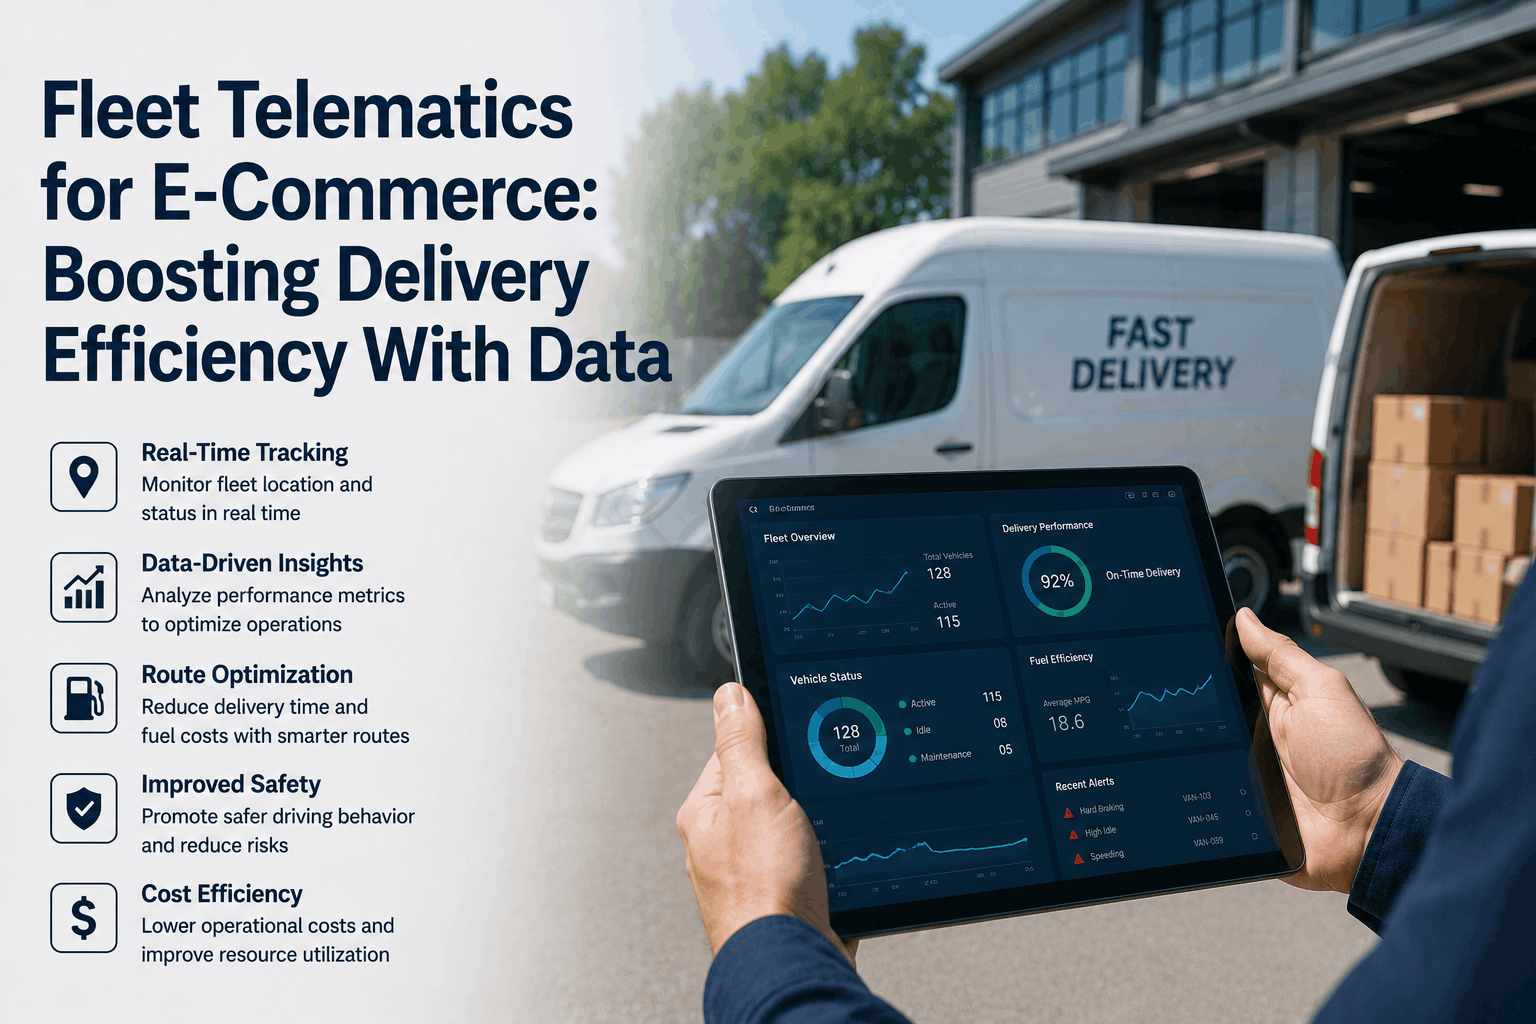
Telematics data is transforming how US e-commerce fleets operate — turning raw signals from every vehicle into decisions that cut cost, reduce failed deliveries, and give dispatchers visibility that manual processes never could. For West Coast operators running routes from Seattle to San Diego, or hubs pushing volume through Denver and Phoenix, the gap between a telematics-equipped fleet and a blind one is measured in dollars per stop. Fleet Rabbit's telematics platform gives US e-commerce operators a unified data stack — speed monitoring, idle analytics, harsh braking detection, and route benchmarking — purpose-built to convert raw vehicle data into measurable delivery efficiency gains. Book a demo to see Fleet Rabbit telematics applied to your delivery fleet.
Quick Answer
Fleet telematics for e-commerce delivery covers five core data streams: real-time GPS tracking, speed and harsh braking behavior scoring, idle time analytics, route efficiency benchmarking, and predictive vehicle health monitoring. US e-commerce operators using Fleet Rabbit reduce cost-per-stop 18–26%, improve on-time delivery rates 20–35%, cut idle fuel waste 30–40%, and achieve full platform ROI within 45–60 days.
What Telematics Data Measures — And Why It Matters for E-Commerce
Telematics is the continuous collection of vehicle data — GPS position, engine speed, braking force, idle status, fuel consumption, and fault codes — transmitted in real time to a fleet management dashboard. For delivery operations across the US West and Southwest, this data replaces guesswork with precision at every stop.
Speed & Harsh Braking
Speed events above 65 mph and harsh braking are logged per driver per shift. On high-volume routes like LA to the Inland Empire or Phoenix metro corridors, aggressive driving cuts MPG 15–30% and increases accident risk — costs that compound directly into cost-per-stop.
Idle Time Analytics
Every idle minute burns $0.05–$0.08 with zero delivery progress. Fleet Rabbit separates behavior idle from structural congestion idle — giving dispatchers the data to fix each cause differently rather than applying a one-size penalty.
Route Efficiency Data
Telematics benchmarks actual route performance against planned — showing miles driven versus optimal and time lost to diversions. Seattle and Denver fleets using route benchmarking reduce excess mileage 12–18% within the first month of deployment.
Signal #1: Speed Data — From Risk Metric to Fuel Efficiency Tool
Speed is the most visible telematics signal — and most directly connected to fuel cost and liability. At highway speeds on Western US routes (I-5, I-10, I-25), every 5 mph above 65 reduces MPG by roughly 7–14%. Fleet Rabbit logs every speeding event with GPS context showing exactly where on the route it occurred.
1
Speed Scoring by Driver and Route
Dispatchers reviewing a Phoenix driver's scorecard see not just "speeding events" but which segments of the I-10 or Loop 101 produced the most incidents — making coaching conversations specific and actionable.
Phoenix operator, 28 vehicles. Post-telematics speed coaching reduced fleet-average MPG loss from speeding by 11% within 6 weeks — saving $8,400 annually in fuel on highway segments alone.
2
Harsh Braking — Hidden Wear and Fuel Cost
Harsh braking wastes kinetic energy that fuel already paid for, accelerates brake wear, and increases rear-end risk. Fleet Rabbit scores each event by severity and frequency — distinguishing occasional hard stops from systemic patterns requiring intervention.
Fuel waste per event: $0.12–$0.28Brake wear: 2–4x fasterIncident reduction: 35–50%
3
Scorecards That Drive Real Change
Fleet Rabbit's driver scorecards cite exact events — route, time, severity — so coaching conversations are grounded in data. "Your harsh braking on the Denver downtown route Tuesday cost $14" changes behavior faster than general reminders.
Fleets in the top MPG quartile after 90 days of telematics coaching show 12–18% better fuel efficiency versus their own pre-deployment baseline.
Telematics + Driver Performance
Turn Vehicle Data Into Delivery Efficiency — Starting Week One
Fleet Rabbit converts speed, idle, and braking data into driver scorecards, route benchmarks, and fuel analytics that reduce cost-per-stop across your entire US delivery fleet.
18–26%
Cost-Per-Stop Reduction
20–35%
On-Time Rate Improvement
Signals #2–5: Idle, Route, Maintenance & Delivery Performance Data
Speed and braking are the most visible signals — but idle analytics, route benchmarking, vehicle health monitoring, and delivery performance data account for 45–60% of the total efficiency improvement US operators capture from full telematics deployment.
Signal #2: Idle Time Data — Quantify What's Burning Fuel at Zero Progress
The West Coast idle problem: Dense zones — downtown Seattle, SF Bay Area, LA's Westside, Portland — generate structural congestion idle that behavior coaching can't fix. Fleet Rabbit separates these two causes so operators apply the right solution.
Behavior idle fix: Automated alerts trigger at 3–5 minutes engine-on with no movement, notifying the driver in-cab and the dispatcher on-screen. Fleets deploying idle alerts reduce behavior-driven idle 35–50% within two weeks.
Structural idle fix: Route redesign — shifting delivery windows to off-peak or splitting urban dense zones into smaller micro-routes — addresses congestion-forced idle that alerts alone cannot eliminate.
Signal #3: Route Benchmarking — Actual vs. Planned Mile-by-Mile
The deviation cost: On a 45-stop Seattle suburban route, an 8% sequence deviation adds 11–15 miles and 22–35 minutes. Across a 40-vehicle fleet running 250 days, that costs $38,000–$54,000 annually — invisible without telematics.
How Fleet Rabbit benchmarks it: Every completed route is compared to the planned sequence — showing miles over, stops reordered, and time lost to diversions. Route managers identify systematic patterns versus one-off traffic events that don't require intervention.
Southwest context: Altitude changes on Denver metro routes and extreme heat in Phoenix and Las Vegas affect consumption in ways flat-state benchmarks miss. Fleet Rabbit's analytics use elevation and temperature-adjusted baselines.
Signal #4: Engine Fault Monitoring — Catch Degradation Early
The hidden fuel drain: Under-inflated tires, worn oxygen sensors, dirty air filters, and degraded oil compound into 8–15% MPG losses that accumulate invisibly across a fleet on manual maintenance schedules. A van 6 PSI below optimal burns 3% more fuel on every route.
How Fleet Rabbit catches it: OBD-II devices read engine fault codes continuously — triggering alerts before degradation impacts delivery capacity. TPMS integration catches tire pressure drift before it becomes a fuel cost or blowout on the I-5.
Financial impact: A 15-vehicle fleet running undermaintained vehicles wastes $6,300–$11,700 annually in excess fuel — before counting $2,000–$4,500 per breakdown incident when deferred maintenance causes mid-route failure.
Signal #5: Stop-Level Data — From Dispatch to Door, Measured Precisely
What stop-level telematics reveals: Geofenced arrival and departure timestamps show dwell time per stop — identifying which stops take 3 minutes and which take 12. Extended dwell at specific addresses flags where pre-delivery coordination eliminates repeated attempts.
Failed delivery reduction: US e-commerce fleets average 6–9% failed first-attempt rates — costing $3–$8 per failed stop in redelivery expense. Fleet Rabbit's stop-level GPS timestamps and proximity-triggered customer notifications reduce failed attempts 25–40% in dense West Coast urban zones.
EV route matching: Stop-level consumption data identifies which daily routes are EV-viable on current battery range — giving fleet managers data-driven deployment decisions rather than guesswork.
Telematics ROI: The Combined Efficiency Impact
18–26%
Cost-Per-Stop Reduction
20–35%
On-Time Rate Improvement
30–40%
Idle Waste Eliminated
12–18%
MPG Improvement Per Driver
25–40%
Failed Delivery Reduction
45–60
Days to Full Platform ROI
Frequently Asked Questions: Fleet Telematics for US E-Commerce Delivery
QHow does telematics hardware install across a mixed delivery fleet?
Fleet Rabbit uses OBD-II plug-in devices requiring no custom installation — they plug into the diagnostic port present in every vehicle manufactured after 1996. Installation across a 50-vehicle fleet typically takes one day, with GPS data, speed events, idle logs, and engine fault codes appearing in the dashboard within 24 hours. For mixed fleets including EVs, Fleet Rabbit reads kWh consumption and battery state of health alongside ICE engine data in the same dashboard.
QHow do West Coast operators handle telematics in high-congestion zones like LA and Seattle?
Fleet Rabbit's idle analytics separate structural congestion-forced idle from behavior-driven idle — critical in LA Basin, Bay Area, and Seattle where traffic makes idle unavoidable on certain corridors. The platform identifies which idle is addressable through driver coaching versus which requires route redesign — shifting delivery windows to off-peak, splitting dense zones into micro-routes, or rerouting around chronically congested corridors. Seattle and Portland operators additionally benefit from elevation-adjusted consumption baselines that account for Pacific Northwest terrain variance.
QWhat's the fastest telematics win for a fleet new to vehicle data?
Idle reduction delivers the fastest visible ROI — typically within 2–3 weeks of alert deployment. The second-fastest win is driver behavior scoring: fleets that run a 30-day baseline collection period and then begin weekly scorecard reviews see 12–18% MPG improvement within 6 weeks. Route benchmarking delivers the largest long-term efficiency gain but requires 4–6 weeks of baseline data before deviation patterns are statistically reliable enough for route redesign decisions.
QCan telematics data support EV fleet expansion planning?
Fleet Rabbit's stop-level consumption analytics identify which daily routes are EV-viable on current battery ranges — showing average miles per route, stop density, idle time, and elevation change. Southwest operators in Phoenix, Las Vegas, and the Inland Empire additionally use temperature-adjusted range estimates to account for extreme heat's impact on battery performance, replacing guesswork with data-driven EV deployment decisions as fleets transition from ICE to electric vehicles.
Related Fleet Rabbit Resources for E-Commerce Logistics
The four AI capabilities transforming e-commerce fleet operations — real-time GPS visibility, predictive vehicle health monitoring, dynamic route optimization, and delivery performance analytics — with ROI data for each.
AI-driven fault prediction and automated maintenance scheduling that prevents mid-route breakdowns — the vehicle reliability foundation that telematics-driven efficiency depends on.
How real-time utilization tracking, idle reduction analytics, and fleet right-sizing data reduce total fleet operating cost — directly applicable to delivery vehicle telematics and route optimization.
How GPS hardware, IoT vehicle data, and cloud analytics combine to deliver real-time fleet visibility, predictive maintenance, and fuel performance analytics — the technology behind every capability in this guide.
Turn Fleet Telematics Into Delivery Efficiency — See Fleet Rabbit in Action
Fleet Rabbit's telematics platform delivers all five data signals through one integrated system — speed and braking scoring, idle analytics, route benchmarking, vehicle health monitoring, and stop-level delivery performance working simultaneously across your entire US delivery fleet. Most operations recover full platform investment within 45–60 days.
18–26% Cost-Per-Stop Reduction
30–40% Idle Reduction
25–40% Fewer Failed Deliveries
Real-Time Vehicle Data
45–60 Day ROI
May 26, 2026
By John Mark
All Posts